Daily Graphing – Edgar Renteria
After just one season with the Red Sox, Edgar Renteria and his four year 40 million dollar contract were shipped off to Atlanta for third base prospect Andy Marte. In 2002 and 2003 Edgar Renteria posted back to back season with a batting average over .300. Since then, he's reverted to his pre-2002 days where he was a around a .275 hitter for five straight years. Is there any hope him ever doing as well as his 2003 season?
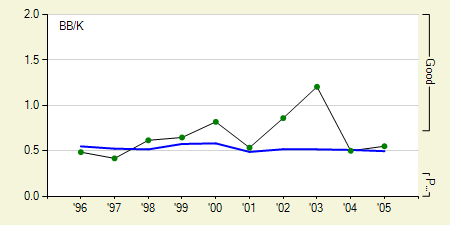
In 2003 he had a tremendous spike in his walk to strikeout ratio (BB/K) which validated his .330 batting average that year. What this graph doesn't show is just how out of whack is 2003 season was. Here's a little sneak preview of our right handed/left handed split graphs.
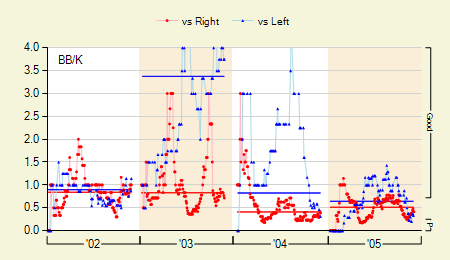
Most of that spike in his his BB/K was due to a incredibly dominant year against left handed pitchers. In 2003 he was an amazing .391/.507/.669 against lefties. I think we can safely say that is not going to happen again.
With a return to his 2003 season likely out of reach, considering his career averages, I'd say the best you can expect out of Edgar Renteria is a return to his 2002 season. The good news is, besides his 2002 and 2003 seasons, he's been incredibly consistent. I doubt he'll be worse than he was in 2005, and chances are he'll be a little bit better next year
David Appelman is the creator of FanGraphs.