Daily Graphing – Mulder vs. Oswalt
Tonight's NLCS game 6 matchup of Mark Mulder vs. Roy Oswalt appears to be an intriguing one. Roy Oswalt has had about as quiet a season any 20 game winner has had. He's been absolutely phenomenal and though he probably won't win the Cy Young award, he deserves to be in contention. Mark Mulder on the other hand has had another solid season winning 16 games, but how well has he really pitched?

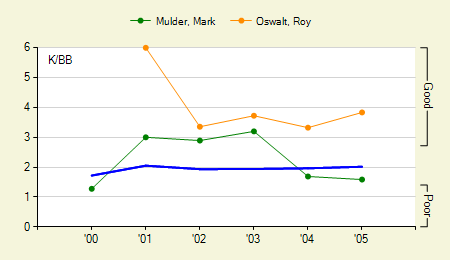
Comparing the two's strikeout to walk ratio shows there is little in common between the two pitchers. Roy Oswalt's superb 3.8 K/BB ratio (the highest of his career) shows that he has full command of the strike zone. Mark Mulder on the other hand has really dropped off in the past two years, falling to a poor 1.6 on the season. That is not the K/BB ratio of a great pitcher (let alone an average pitcher), yet Mark Mulder has a respectable ERA of 3.64 for the season.
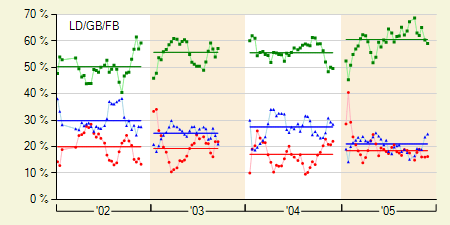
Mark Mulder's BABIP (Batting Average on Balls in Play) of .292, is a little lower than average, but in a very realistic range, so it's hard to say he's just gotten lucky. Taking a look at his Ground Ball/Fly Ball/Line Drive percentages it becomes quite clear what makes Mark Mulder successful.

He has always been a ground ball pitcher, but he has taken it to the extreme this year. Since the damage done on ground balls is minimal, falling for extra base hits around 8% of the time, chances are any base runner isn't going to get too far. In fact, he ranks 6th highest in ground ball percentage with pitchers who pitched over 100 innings for the 2005 season. Combine 61% ground balls with the good St. Louis defense and you should have a fairly successful pitcher.
There's no doubt in my mind that I'd rather have Roy Oswalt on the mound. He has everything you look for in an true ace, and he's no slouch at inducing ground balls either.
David Appelman is the creator of FanGraphs.