Daily Notes: Three True Outcome Leaders and Laggards So Far
Table of Contents
Here’s the table of contents for today’s edition of the Daily Notes.
1. Three True Outcome Leaders and Laggards So Far
2. Today’s MLB.TV Free Game
3. Today’s Complete Schedule
Three True Outcome Leaders and Laggards So Far
Introduction
Recently in these pages, Cleveland corner infielder Mark Reynolds characterized his hitting approach for the benefit of David Laurila, saying, “I would say my swing is… a controlled train wreck. I just get it down and let it eat.” Will the comment win him a much deserved Pulitzer Prize for Joyous Remarks? It remains to be seen. What it reveals beyond his gift for the language, though, is the means by which he has consistently found himself among the league’s leaders both in strikeouts and home runs.
Below are the current leaders and laggards by all three true outcomes — both by overall percentage and then by averaged z-score (i.e. average standard deviations from the mean in all three categories). Numbers don’t include Wednesday games.
Three True Outcomes by Percentage: Leaders
Here are the three-true-outcome leaders by percentage among qualified batters:
| Name | Team | PA | HR | BB | K | TTO | TTO% |
|---|---|---|---|---|---|---|---|
| Chris Carter | Astros | 196 | 9 | 20 | 75 | 104 | 53.1% |
| Dan Uggla | Braves | 193 | 10 | 26 | 64 | 100 | 51.8% |
| Adam Dunn | White Sox | 188 | 12 | 19 | 66 | 97 | 51.6% |
| Justin Upton | Braves | 212 | 14 | 33 | 57 | 104 | 49.1% |
| Josh Willingham | Twins | 194 | 9 | 31 | 52 | 92 | 47.4% |
| Colby Rasmus | Blue Jays | 182 | 8 | 14 | 64 | 86 | 47.3% |
| Pedro Alvarez | Pirates | 172 | 10 | 13 | 57 | 80 | 46.5% |
| Mike Napoli | Red Sox | 222 | 8 | 21 | 74 | 103 | 46.4% |
| B.J. Upton | Braves | 176 | 4 | 16 | 60 | 80 | 45.5% |
| Brandon Moss | Athletics | 181 | 7 | 21 | 54 | 82 | 45.3% |
Three True Outcomes by Percentage: Laggards
And here are the laggards by the same method:
| Name | Team | PA | HR | BB | K | TTO | TTO% |
|---|---|---|---|---|---|---|---|
| Jeff Keppinger | White Sox | 175 | 1 | 2 | 17 | 20 | 11.4% |
| Placido Polanco | Marlins | 196 | 0 | 10 | 14 | 24 | 12.2% |
| Marco Scutaro | Giants | 216 | 1 | 16 | 13 | 30 | 13.9% |
| Alcides Escobar | Royals | 216 | 3 | 8 | 22 | 33 | 15.3% |
| Juan Pierre | Marlins | 176 | 1 | 9 | 17 | 27 | 15.3% |
| Norichika Aoki | Brewers | 221 | 4 | 18 | 12 | 34 | 15.4% |
| Omar Infante | Tigers | 189 | 3 | 12 | 17 | 32 | 16.9% |
| Andrelton Simmons | Braves | 204 | 5 | 10 | 20 | 35 | 17.2% |
| Yadier Molina | Cardinals | 198 | 3 | 13 | 18 | 34 | 17.2% |
| Nick Markakis | Orioles | 239 | 5 | 18 | 19 | 42 | 17.6% |
Three True Outcomes by Z-Score: Leaders
Because strikeouts naturally occur more frequently (the average among qualified batters is around 19%) and home runs less frequently (around 3%), considering only overall three-true-outcome percentage naturally skews the odds in favor of high-strikeout batters, even if they lag behind in the other two categories. Roy Halladay, for example, has 11 strikeouts in 11 plate appearances. One-hundred percent of his plate appearances have ended in one of the true outcomse. It wouldn’t be fair, though, to characterize him as a three-true-outcome hitter.
To adjust for that effect, we can look at a player’s true-outcome performance relative to the mean in each category by using z-scores (basically just standard deviations from the mean). Here are the top-10 qualified batters by that methodology:
| Name | Team | HRz | BBz | Kz | TTOz |
|---|---|---|---|---|---|
| Justin Upton | Braves | 2.1 | 2.2 | 1.3 | 1.8 |
| Dan Uggla | Braves | 1.3 | 1.5 | 2.2 | 1.7 |
| Adam Dunn | White Sox | 2.0 | 0.5 | 2.5 | 1.7 |
| Chris Davis | Orioles | 2.8 | 1.5 | 0.6 | 1.6 |
| Josh Willingham | Twins | 1.0 | 2.3 | 1.3 | 1.5 |
| Chris Carter | Astros | 0.9 | 0.5 | 3.0 | 1.5 |
| Jose Bautista | Blue Jays | 1.7 | 2.3 | -0.2 | 1.3 |
| Lucas Duda | Mets | 1.1 | 1.7 | 1.0 | 1.3 |
| Mark Reynolds | Indians | 1.7 | 0.8 | 1.2 | 1.2 |
| Bryce Harper | Nationals | 2.2 | 1.7 | -0.3 | 1.2 |
Three True Outcomes by Z-Score: Laggards
And the laggards, as well:
| Name | Team | HRz | BBz | Kz | TTOz |
|---|---|---|---|---|---|
| Jeff Keppinger | White Sox | -1.4 | -2.2 | -1.3 | -1.6 |
| Placido Polanco | Marlins | -1.7 | -1.0 | -1.7 | -1.5 |
| Juan Pierre | Marlins | -1.4 | -1.0 | -1.3 | -1.2 |
| Salvador Perez | Royals | -1.3 | -2.0 | -0.4 | -1.2 |
| Marco Scutaro | Giants | -1.4 | -0.3 | -1.9 | -1.2 |
| Alcides Escobar | Royals | -0.9 | -1.4 | -1.3 | -1.2 |
| Ben Revere | Phillies | -1.7 | -0.9 | -0.9 | -1.2 |
| Alexei Ramirez | White Sox | -1.4 | -1.0 | -1.0 | -1.1 |
| Ruben Tejada | Mets | -1.7 | -0.4 | -1.2 | -1.1 |
| Ichiro Suzuki | Yankees | -1.1 | -1.0 | -1.1 | -1.0 |
Notes
• In light of the above, it would probably be most accurate to say that Atlanta outfielder Justin Upton is currently the champion of the three-true-outcome hitters, having recorded home-run, walk, and strikeout rates on average about 1.8 standard deviations above the mean for qualified hitters.
• Both Jose Bautista and Bryce Harper actually hurt their claims to three-true-outcome glory by striking out too infrequently.
• Carlos Peguero appears to be the hitter with the fewest plate appearances to have recorded one of each of the three true outcomes. In seven plate appearances, he has a home run, a walk, and two strikeouts.
Today’s MLB.TV Free Game
Boston at Philadelphia | 19:05 ET
Franklin Morales (76.1 IP, 101 xFIP- 0.8 WAR in 2012) faces Jonathan Pettibone (42.0 IP, 117 xFIP-, 0.0 WAR). The former, after recovering from multiple injuries, is making his 2013 debut. The left-hander sat at ca. 94 mph over his last four starts of 2012.
Readers’ Preferred Broadcast: Philadelphia Radio.
Today’s Complete Schedule
Here’s the complete schedule for all of today’s games, with our very proprietary watchability (NERD) scores for each one. Pitching probables and game times aggregated from MLB.com and RotoWire. The average NERD Game Score for today is 5.1.
Note: the following table is entirely sortable.
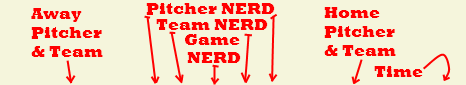
| Away | SP | Tm. | Gm. | Tm. | SP | Home | Time | ||
|---|---|---|---|---|---|---|---|---|---|
| Brandon McCarthy | AZ | 6 | 4 | 6 | 4 | 6 | TEX | Justin Grimm | 14:05 |
| Jake Peavy | CHA | 7 | 0 | 4 | 5 | 3 | CHN | Travis Wood | 14:20 |
| Felix Hernandez | SEA | 10 | 6 | 8 | 7 | 6 | SD | Andrew Cashner | 15:40 |
| A.J. Griffin | OAK | 5 | 6 | 4 | 4 | 2 | SF | Barry Zito | 15:45 |
| Franklin Morales* | BOS | 7 | 7 | 5 | 1 | 4 | PHI | Jonath. Pettibone | 19:05 |
| Homer Bailey | CIN | 8 | 6 | 7 | 9 | 6 | CLE | Scott Kazmir | 19:05 |
| Doug Fister | DET | 6 | 7 | 5 | 7 | 3 | PIT | Jeff Locke | 19:05 |
| Dillon Gee | NYN | 3 | 6 | 4 | 5 | 5 | NYA | Vidal Nuno* | 19:05 |
| Dan Haren | WAS | 5 | 2 | 4 | 9 | 1 | BAL | Freddy Garcia | 19:05 |
| Alex Colome* | TB | 9 | 7 | 6 | 1 | 5 | MIA | Ricky Nolasco | 19:10 |
| R.A. Dickey | TOR | 9 | 6 | 8 | 9 | 7 | ATL | Mike Minor | 19:10 |
| Kyle Lohse | MIL | 5 | 5 | 4 | 2 | 4 | MIN | P.J. Walters* | 20:10 |
| Jeremy Guthrie | KC | 2 | 6 | 5 | 2 | 8 | STL | Michael Wacha* | 20:15 |
| Lucas Harrell | HOU | 0 | 4 | 3 | 7 | 3 | COL | Juan Nicasio | 20:40 |
| Ted Lilly* | LAN | 4 | 2 | 3 | 5 | 2 | LAA | Jason Vargas | 22:05 |
To learn how Pitcher and Team NERD Scores are calculated, click here.
To learn how Game NERD Scores are calculated, click here.
* = Fewer than 20 IP, NERD at discretion of very handsome author.
Carson Cistulli has published a book of aphorisms called Spirited Ejaculations of a New Enthusiast.
The St. Louis game looks to be the most Wachable.
Wacha wacha!
Eh.
I love the Cardinals, and I think the kid will be a solid 4-5 type guy for years, in the Westbrookian vein, but I don’t see him coming out and setting the world on fire like Miller and Harvey have.