Forget MeatWaste, Who’s Crushing Shadowballs?
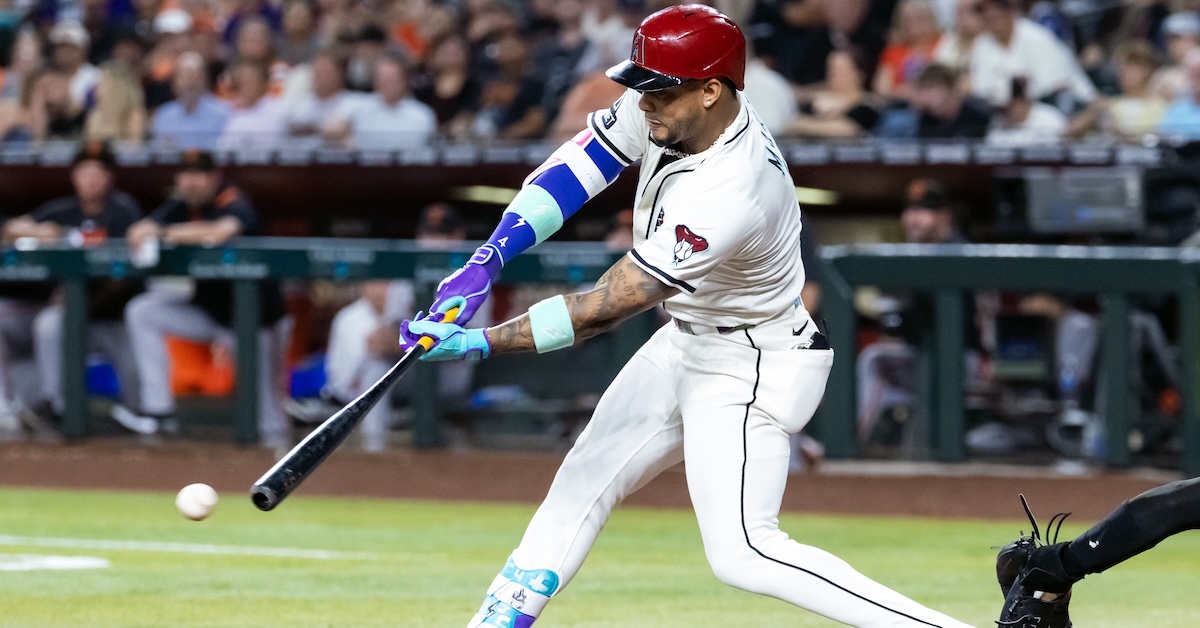
As you surely know, Michael Baumann has been writing about MeatWaste for two weeks now. Specifically, he’s been writing about who is great at hitting pitches in the Meatball and Waste portions of the strike zone, according to Statcast’s Attack Zones diagram. Those are hitter’s pitches. The meatball zone right down the middle (zone five in the diagram below) is where batters crush the baseball, and the waste zone far away from the strike zone is where they have no trouble laying off pitches that are certain to be called balls. Baumann wrote about how the Brewers are great as a team at capitalizing on those pitches last week, and then today he ran down the individual MeatWaste leaderboard, a phrase I didn’t know I needed in my life until Tuesday.

This is useful information with a delightfully repulsive name, and it made me wonder about the opposite leaderboard. MeatWaste tells you who’s crushing hitter’s pitches, but let’s find out who’s excelling against pitcher’s pitches. Technically, that isn’t the opposite of MeatWaste. MeatWaste makes up just nine of Statcast’s 33 attack zones. The true opposite would include the other 24 that make up the Chase, Shadow, and Heart zones (except for zone five, the spot right over the very middle). It would also look very, very similar to the list of the best hitters in the game.
| Player | Run Value/100 |
|---|---|
| Aaron Judge | 1.83 |
| Vladimir Guerrero Jr. | 1.72 |
| Shohei Ohtani | 1.72 |
| Nick Kurtz | 1.56 |
| Juan Soto | 1.47 |
This list isn’t telling us anything we don’t already know because we’re looking at too much of the zone. If we want the opposite of MeatWaste, we need to look at the edges of the strike zone, where swing decisions are difficult and loud contact is hard to come by. Statcast calls this the shadow zone, and it includes any pitch within one baseball’s width (or 2.9 inches) of the edge of the strike zone.
What do we call the opposite of MeatWaste? Is it meat that’s the opposite of waste, like filet mignon? If we acknowledge vegetables as the opposite of meat (though you could make a strong argument for pudding), does that mean it’s veggie waste, like edamame shells? Or does that mean it’s the opposite of both meat and waste, like an artichoke heart? In the end, I decided to keep it simple and just follow Statcast’s taxonomic principles. These aren’t Meatballs, they’re Shadowballs, and if you know anyone who goes by that nickname, I urge you to explain in the comments how they came by it.
If you’re starting to wonder whether I’m vamping here, you’re right on the money. I have avoided showing you the Shadowball leaderboard for one reason in particular. Especially if you focus on run value per 100 pitches, it’s not a close competition at all.
| Player | wOBA | xwOBA | Run Value | RV/100 |
|---|---|---|---|---|
| Ketel Marte | .409 | .394 | 14 | 1.58 |
| José Ramírez | .375 | .367 | 11 | 1.12 |
| Jurickson Profar | .384 | .322 | 7 | 1.08 |
| Mike Trout | .355 | .345 | 10 | 0.90 |
| Roman Anthony | .376 | .366 | 4 | 0.80 |
| Daylen Lile | .358 | .319 | 4 | 0.76 |
| Juan Soto | .330 | .336 | 7 | 0.61 |
| Trent Grisham | .351 | .347 | 6 | 0.60 |
| Shohei Ohtani | .363 | .354 | 5 | 0.46 |
| Pete Alonso | .373 | .386 | 5 | 0.44 |
We’ve got plenty of the best-in-baseball names you’d expect: José Ramírez, Juan Soto, and Shohei Ohtani. Even though he’s having a down season, Mike Trout is still formidable on the edges of the zone. We’ve also got young guns like Roman Anthony and Daylen Lile. But one name is so, so far ahead of the others here. Ketel Marte is absolutely dominating this list.
As of Wednesday morning, 293 batters have seen at least 1,000 pitches this season. Of those 293, just 22 have a positive run value against pitches in the shadow zone. That’s to be expected. Those are the tough pitches! Just two batters, Marte and Ramírez, have been worth more than a run per 100 pitches. But look how big the gap is between them. Marte’s mark is more than 40% higher than Ramírez’s! He leads all batters in terms of wOBA, xwOBA, and run value. He’s in his own galaxy. He’s more than triple Ohtani’s mark in ninth place. The gap between him and Pete Alonso in 10th place is the same as the gap between Alonso and Nolan Schanuel in 63rd place. Marte’s 1.58 run value mark is the 13th highest since 2015, just ahead of Mookie Betts’ during his 2018 MVP season.
So what is Marte doing so well against those pitches? He’s making great swing decisions, though not necessarily in the way that we normally think about swing decisions. When those shadow zone pitches are outside the strike zone, he’s chasing 36% of the time, which puts him in the 18th percentile of batters who’ve seen at least 250 such pitches. That’s great. When they’re in the strike zone, his 57% swing rate puts him in the 31st percentile. In other words, he’s being extra patient. If we were talking about the entire strike zone, we might say he’s being too patient; it’s great to avoid chases, but you don’t want to lay off too many strikes. That’s not the right way to think about the shadow zone, though. Even when they’re in the strike zone, shadow zone pitches aren’t that great to swing at. Often, the batter would be better served by taking a strike in the hopes of getting something better to hit later in the count. Marte is doing an excellent job laying off those pitches, even though it means taking some called strikes.
Now to the most obvious point of all. When he does swing at those shadow zone pitches, Marte is crushing the ball. He’s running a .377 wOBA when he swings at shadow zone pitches outside the zone, the second-highest mark in baseball. He’s running a .398 wOBA when he swings inside the strike zone, the 11th best. If it’s near the plate, he’s doing damage. His .575 slugging percentage is the highest in baseball, and his .309 batting average and .386 on-base percentage are both in the top 10. His hard-hit rate and barrel rate are in the top 20. Knowing the strike zone is important, but knowing which pitches you can do damage against is every bit as important. Marte knows.
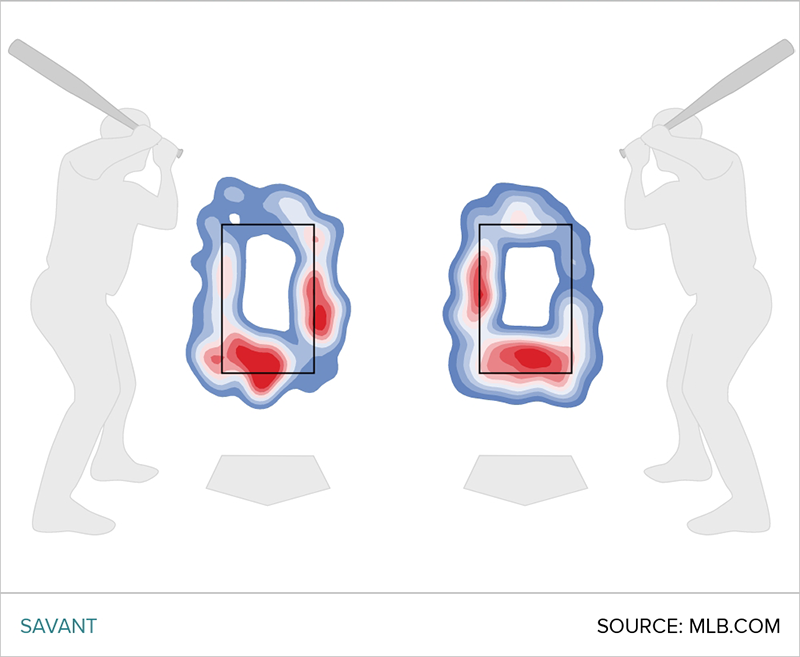
That brings us to our last point. Marte is cheating a little bit! Here are heat maps that show where he’s swinging at pitches in the shadow zone both from the right and left side of the plate. As you can see, they’re pretty much mirror images. He likes the ball low and he likes the ball out over the plate.
There’s a good reason for this. Marte stands just 22 inches from the plate as a lefty, the fourth closest of all batters from that side. He stands just 25 inches from it as a righty, 12th closest from that side. He crowds the plate like crazy, and Ramírez is right up there at the top of the list with him. Maybe this would be a more accurate version of that heat map.
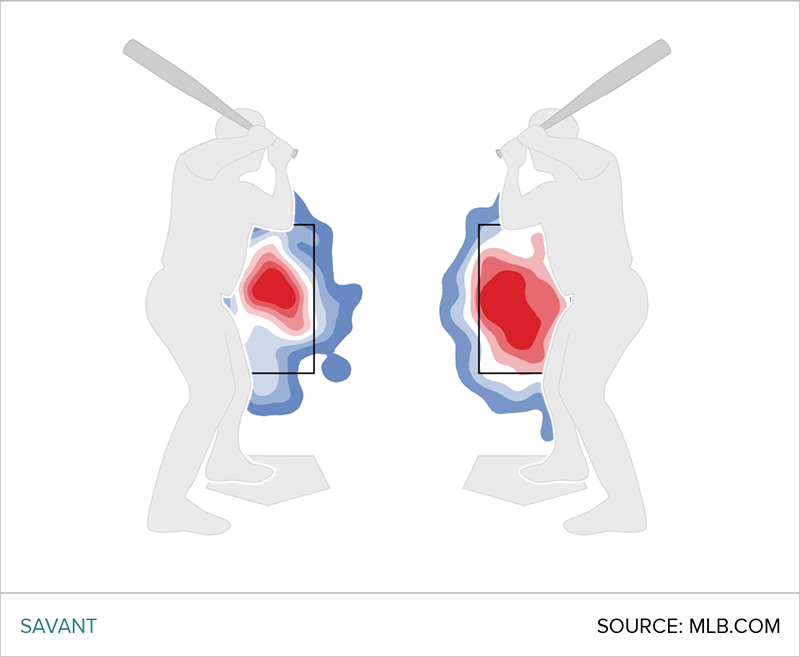
When you’re right on top of the plate like that, the outside pitch doesn’t feel that far outside. The shadow zone is just the canary in the coal mine here. When you look at a heat map that shows all of Marte’s swings, you can see that his entire focus is shifted over toward the opposite side of the plate.
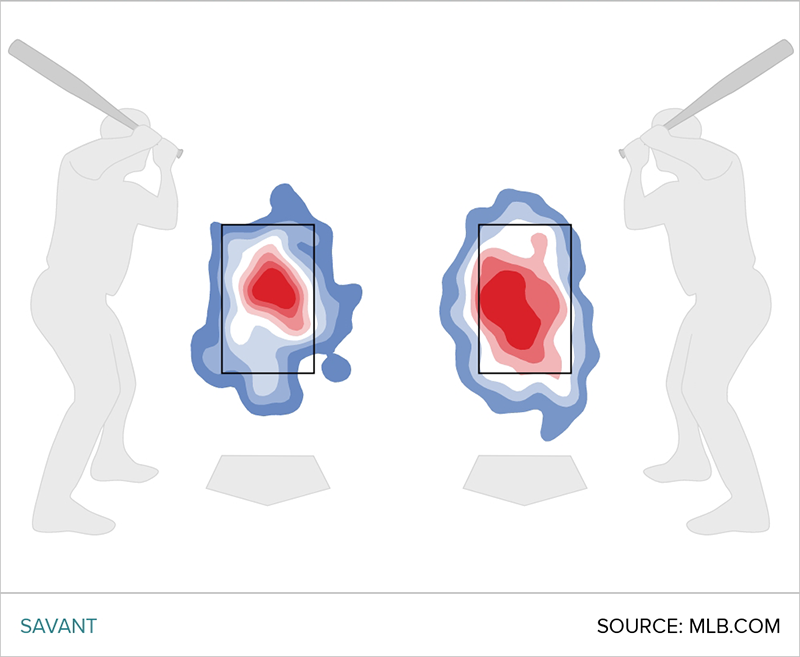
That explains a lot, and it’s almost certainly the secret to turning outside pitches like these ones into pull-side home runs.
I don’t know if Marte is crowding the plate because (like Ramírez, though to a lesser degree) he’s shorter than the average player and worries about covering the outside part of the plate. Maybe he loves the outside pitch and wants to force pitchers into throwing it. Maybe this is just where he’s comfortable, and he doesn’t mind shifting his nitro zone over a bit, strike zone be damned. Whatever the reason, it’s certainly working. Marte is once again putting up one of the year’s best performances at the plate, and he’s the undisputed king of the shadow zone.
Davy Andrews is a Brooklyn-based musician and a writer at FanGraphs. He can be found on Bluesky @davyandrewsdavy.bsky.social.
I would be very interested to see the full list of who hits Shadowballs, and see how it compares to their run values on other pitches.
To some extent, it’s just true that better hitters are better at hitting Shadowballs, I’m not seeing any real commonalities here. If you someone were to say “here is a list of hitters who score well in this metric, they include Daylen Lile and Pete Alonso” wouldn’t you think maybe there’s something weird going on here? I would be very curious to see the broader distribution due to this.
Right now, all I see is “switch hitters who came up as shortstops and are probably under six feet tall are at the very top of the list, except Xavier Edwards is not.”
Although I admit that seeing Daylen Lile on this list is probably a very positive bit of evidence about future. If he could just play an actual position…
Alonso makes do with his power. Without looking at the details I’m going to assume he gets a goodly amount of his Shadowball marks from the contact he makes, and somewhat less from the pitches he lays off. But he isn’t a crazy hacker, so yeah some.
Daylen Lile is too new to know much. He’s indubitably performed well to date. Is he an up and comer? It certainly isn’t impossible. He wouldn’t be the first hit-tool first guy who grew into some power and exceeded expectations as a result.
I think a useful follow-up would be to examine this over multiple years. See if being a Shadowballer is particularly sticky.
Here’s the thing: The profiles in terms of power, bat control, strike zone judgment, etc are all over the place for these guys.
Almost everyone on this list is on it because they are elite hitters already. Except this is also not the list of the most elite hitters. Aaron Judge, Cal Raleigh, Kyle Schwarber, George Springer, Vlad Jr, Kyle Tucker, Rafael Devers, Corbin Carroll, Manny Machado, Matt Olson…
What causes hitters to be good hitters in the shadow zone?
What indeed? I’d bet looking at a multiyear data set, and seeing who shows up often, would help to suss it out.
I’d expect it’s having a swing geared towards an edge of the zone (the low shadow zone might as well be down the middle for Trout)