Fun With Meaningless Splits: Half Edition
“I will start with the easy answer:” wrote Jeff Zimmerman back in 2014. The next part was bolded: “No, first and second half stats are not as important as the entire season for pitchers and hitters.” Jeff was talking about fantasy baseball, and whether you should consider a particularly strong or weak second half more relevant to a player’s future performance, but the lesson was clear. Overall stats tell you a lot more about a player than half a season of stats.
The same lesson is true over the course of a career. Since 1933, the year of the first All-Star Game, Stathead says that 2,146 players have made at least 900 career plate appearances in both the first half and the second half. Just under 93% of those players have a second half OPS that’s within 10% of their first half OPS. (We’re using percentages here rather than raw points in order to create a level playing field for players of varying skill levels. I calculated them by subtracting each player’s first half OPS from their second half OPS, then dividing the difference by their first half OPS.) Only 15 players – again, that’s 15 players out of a sample of 2,146 – saw their second half OPS differ from their first half OPS by more than 20%.
All of this makes sense. There’s no reason that a batter should be consistently better at the beginning or end of the season. As Eno Sarris once reminded us, seasons themselves are arbitrary endpoints. Most of the 15 outliers I mentioned in the previous paragraph are the results of short, noisy samples, either because they had short careers or they’re still in the early stages of their career right now. The longer your career, the more likely that your true talent level will shine through, regardless of the date on the calendar.
These days, there’s even less reason for players to be hot or slow starters. Once upon a time, players had to take offseason jobs at the slaughterhouse back home in Fargo to make ends meet, and Whitey Ford was telling anyone who would listen that the secret to looking like you kept in shape over the winter was getting a good suntan. Nowadays, everybody trains year-round and works with professional trainers and nutritionists. Nobody’s ever that far away from playing shape at the beginning of the year, and nobody’s ever had better in-season maintenance. Players spend their offseasons in the gym and the cages, and they spend the regular season drinking personalized recovery smoothies and resting in nap pods.
For example, Elly De La Cruz has huge splits, with a 128 wRC+ in the first half and an 84 wRC+ in the second half. However, he’s only played three seasons. In 2023, he had an electric debut, then collapsed amid widespread reports of fatigue. In 2025, he was playing through an injury and the death of his sister in the second half. It’s possible that De La Cruz will continue to be a hot starter and slow finisher. He plays the game at a million miles an hour, taking the extra base, stealing, laying out. Maybe he’ll always spend the second half a bit more banged up than the average player. For now, though, it’s way too early to say. He looks primed to have a long career, and at some point things will probably balance out. (As for whether there’s a correlation between basestealing and second half decline, I’d note that Rickey Henderson had better first half numbers, but Lou Brock and Tim Raines were better in the second half. Even Cal Ripken Jr., who put his body through more punishment than just about anyone, only saw his OPS drop by 25 points in the second half.)
I doubt I’m telling you anything you don’t know, but here’s a scatter plot that shows what we’re talking about. The more you play, the less likely you are to have big splits. (The scatter plot shows the absolute value of the difference, ignoring whether a player was better or worse in the first half.)
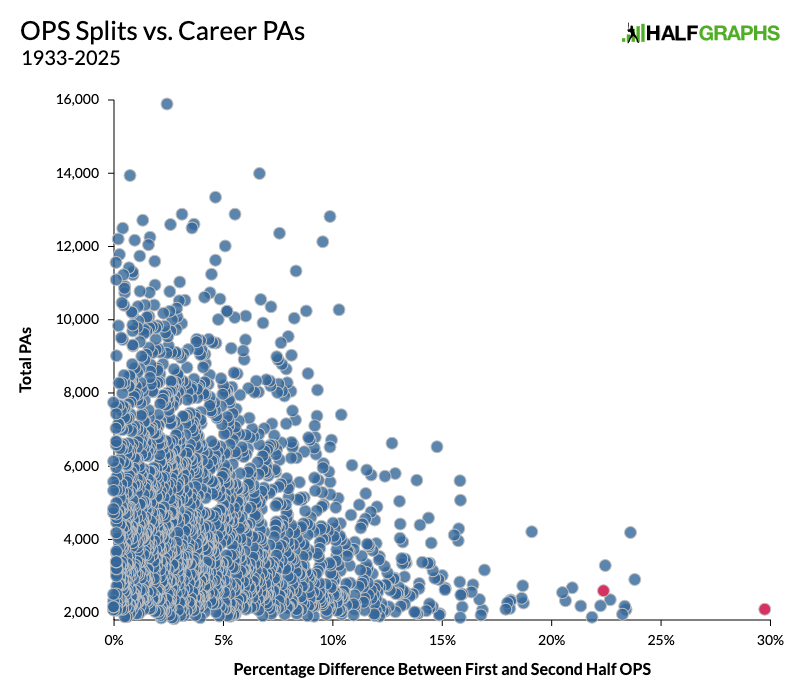
In order to separate yourself from the big right triangle of standard deviations, you have to play long enough to rack up 10,000 plate appearances, and the vast majority of the players who do that are Hall of Famers. It’s certainly possible that some players are slow starters and some players just tend to get banged up in the second half, but the sample size needed to prove it definitively is just too big. So this is all a lot of nonsense. Just to hammer that home, I’d like to end by talking about two of the widest dots on that scatterplot.
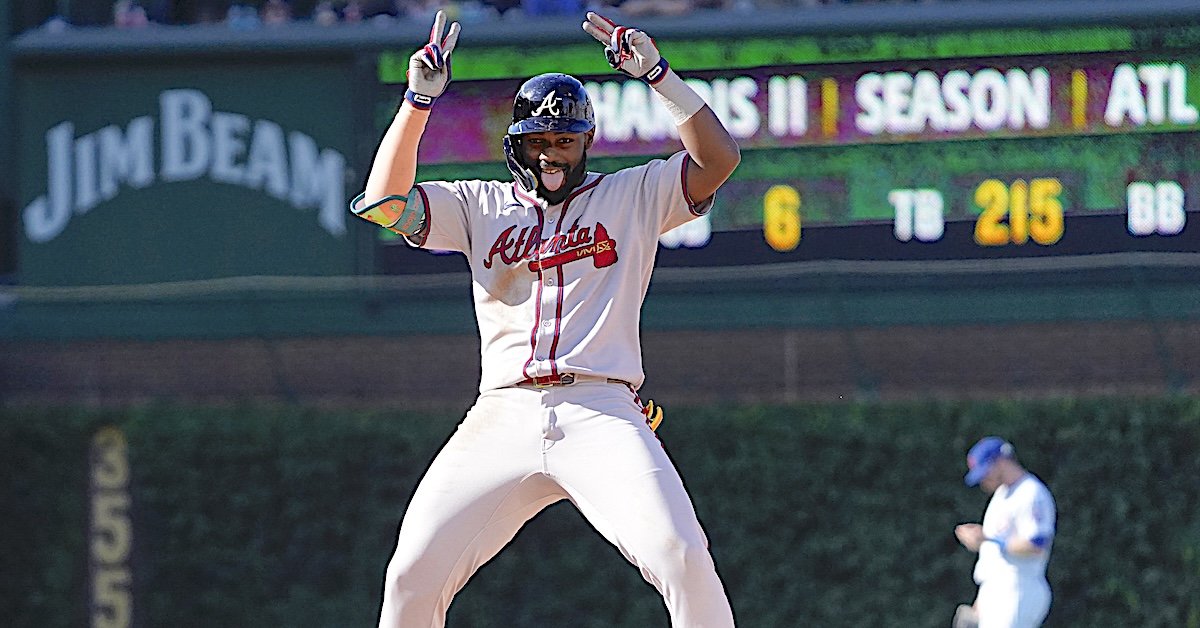
See that red dot all the way out at 30%? That’s Michael Harris II, who has a career wRC+ of 80 in the first half and 134 in the second half. It’s a shockingly huge disparity. In the first half, Harris is barely playable. In the second, he’s one of the better hitters in baseball. Obviously, we’re talking about a small sample here. Harris has played just four seasons, and the biggest statistical difference between his first and second half numbers is a 60-point jump in BABIP. Still, he’s on his own out there. I would bet that things will even out some over the course of his career, but after this start, he’s almost certainly going to end up with a pretty big split whenever he retires. And if this is just what he does every year, I can’t wait to read the 2026 version of the article explaining how he turned things around halfway through the year.
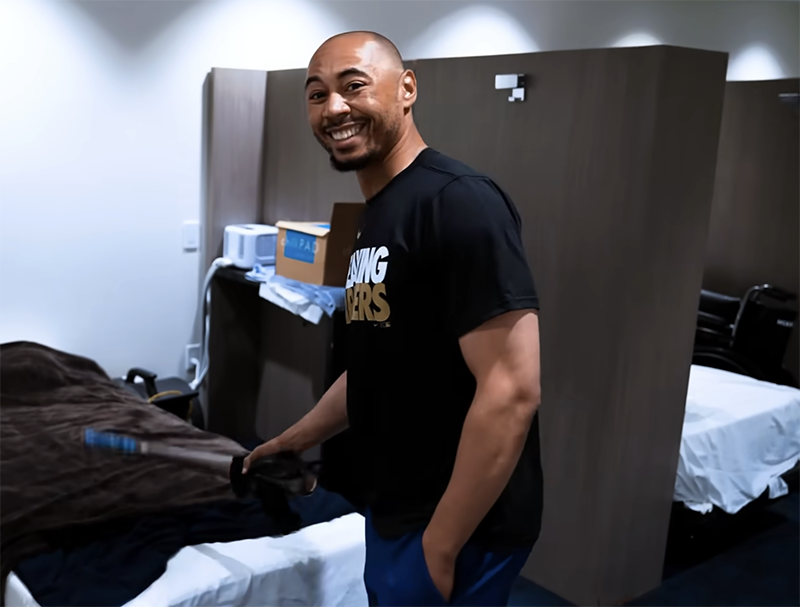
Julio Rodríguez is that other red dot way out toward the right. He’s not quite as extreme as Harris – no one is as extreme as Harris! Rodríguez has also never been bad at the plate, even in the first half. He has a career wRC+ of 114 in the first half and 154 in the second half. Most players would be plenty happy with a 114 wRC+ at any point in the season, but a difference of 40 points is still very extreme. It’s even weirder when you note that all four of his IL stints have come during the second half rather than the first. Maybe he’s just a slow starter, too. Maybe both of these guys should be ramping up early to avoid their dreaded slow starts. Right? Wrong.
Harris and Rodríguez start out hot every year! We have spring training numbers going back to 2006, and if you set a minimum of 60 plate appearances, you get a sample of 2,482 players. Rodríguez’s 174 wRC+ is the 13th-best mark in the last 20 years! Harris isn’t right at the top of the leaderboard, but he has a career wRC+ of 136, better than his second half numbers. The roller coaster is even wilder for Harris, who is also just 6-for-35 in the postseason for a paltry 24 wRC+. Just to lay it all out plainly:
Spring Training: He’s great.
First Half: He’s terrible.
Second Half: He’s great.
Postseason: He’s miserable.
I told you it was nonsense.
Davy Andrews is a Brooklyn-based musician and a writer at FanGraphs. He can be found on Bluesky @davyandrewsdavy.bsky.social.
A scatter plot of the same player base but contrasting even and odd plate appearances would likely show the same distribution. It’s all a distraction from the truth because we’d rather just see some dingers.
Oh that would be very fun to see, jut as a type of control comparison