Nobody’s Stealing Bases in the Playoffs
I’ve got some terrible news for you. The crime rate is way down. I know that sounds like it should be good news, but when it comes to baseball, it’s just boring. Nobody’s stealing any bases during the playoffs (except for Randy Arozarena and, of course, Josh Naylor). The 34 total playoff games have seen just 26 steals on 35 total attempts. That’s 0.51 attempts per team per game, a huge drop-off from a regular season that averaged 0.91. The Blue Jays and Dodgers have combined for just two steals on two attempts. Boring.
On its own, that doesn’t seem too surprising. This is the fourth year in a row that teams have attempted fewer steals per game in the playoffs than in the regular season. The reasons behind this are easy enough to understand. First, we have a logistical hurdle. Runs are harder to come by during the playoffs. This year, we’ve seen 4.45 runs per team game during the regular season and just 4.02 during the playoffs. On-base percentage is down 11 points, which means fewer baserunners and fewer stolen base opportunities to start with. Next, we’ve got the risk aversion angle. Those baserunners are a more precious commodity at a time when the stakes are at their highest. Running into an out on the bases is a very loud unforced error, the kind of thing you get roasted for in the papers the next morning. It’s a lot harder to see how much potential value you’re leaving on the table by just staying put. I feel confident that I’ve never read an article roasting a player for not trying to steal.
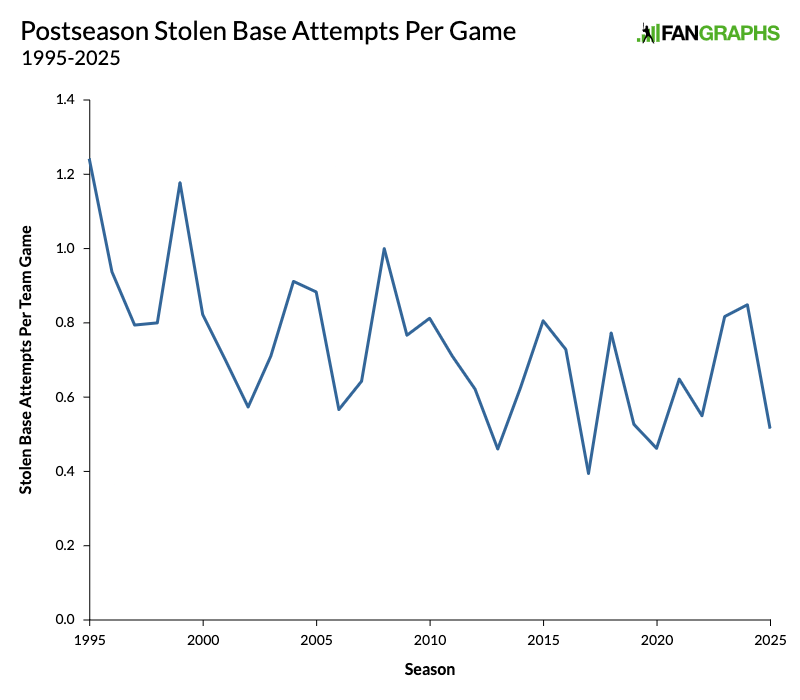
The graph above shows the number of steals per team game in the postseason since 1995. This year is on the lower end, but it’s by no means out of the ordinary. However, this graph is something of a lie, and you might be surprised to know that things don’t always work this way. Over the previous 10 years, we’ve seen six postseasons with fewer steal attempts per game than in the regular season and four with more attempts. Things have been fairly balanced. Also, this is also a weird year for basestealing to be down, because as you might have noticed, the playoffs have seen a real uptick in small ball. This year, we’ve seen 0.24 sacrifice bunts per team game in the postseason, the most since 2015. Usually bunts and steals go hand in hand. They’re ways to manufacture runs. But it’s not working out that way. Teams are using one small ball tactic, but not the other. Weird, right?
Now let me show you why that first graph was a lie. Here’s the same graph, but it shows the percentage difference between the postseason and the regular season. For example, say teams averaged 1.0 attempts during the regular season and 0.9 in the playoffs. It would show up on the chart as a difference of -10%.
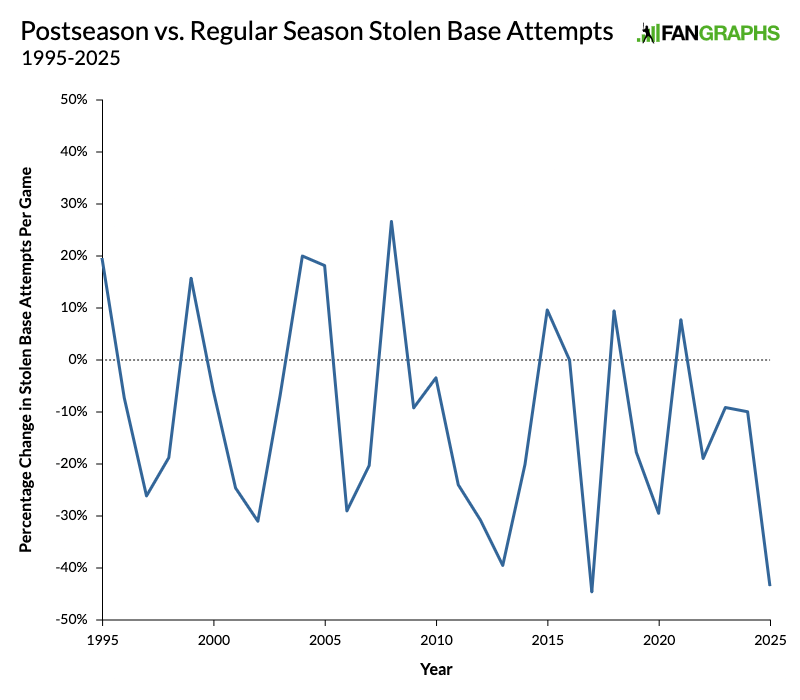
Thinking about postseason basestealing this way – as the percentage change from the regular season – makes things look a little bit different. This year, stolen base attempts are down 45% from the regular season. It still doesn’t look like a huge outlier, but it is the second-largest difference on this entire chart, behind only 2017. Stolen base attempts really are down on a per-game basis, and that’s before we factor in stolen base opportunities. I mentioned earlier that run-scoring is down more than half a run per game from the regular season, and that affects the number of baserunners, which affects the number of stolen base opportunities. So let’s factor that in too.
Statcast tracks Stolen Base Attempt Percentage, looking at the rate of attempts per steal situation on an individual pitch basis. It would take me an extraordinarily long time to pull all that data together for the postseason for the sake of comparison (and I’d only be able to pull it together going back to 2008), so I created a quick and dirty version using easily available data. I just divided the number of steal attempts by the number of runners who reached base by a single, double, walk, or hit-by-pitch. It’s extremely unsophisticated, but it’s also really easy to calculate with the available data. I call it Janky Takeoff Rate, and the formula looks like this.
JTR = (SB + CS) ÷ (1B + 2B + BB + HBP)
I compared each team’s JTR this season with its Statcast stolen base attempt percentage, and the correlation coefficient was 0.95. It’s janky, but it’s certainly good enough for our purposes. The graph below shows the change in JTR from the regular season to the postseason in every year since 1969, when the divisional era meant that the postseason involved a minimum of eight games.
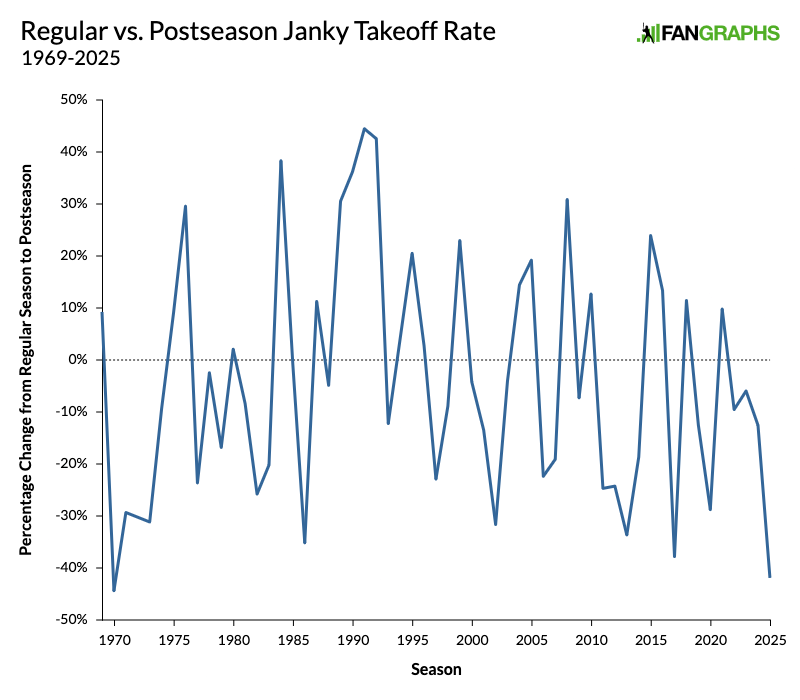
This blue line goes up and down seemingly every year or two. It’s all over the place. But make sure you look all the way over to the right. This year’s 42% drop-off is the second lowest in the 57-year history of the divisional era. It’s the lowest since 1970! Relative to the regular season that preceded it, no postseason has featured more caution on the basepaths since Paul McCartney formed Wings.
Why isn’t anybody running? I checked all the factors I could think of. It’s certainly feels like there have been a lot of blowouts in these playoffs, and teams don’t really run during blowouts. I looked into whether there just hadn’t been that many situations where the game was close enough that it made sense to try for a steal. That doesn’t seem to be it. According to Stathead, one team has been up by at least five runs in the ninth inning 10 times this postseason, or 29% of the time. That’s almost exactly the same rate as the last 10 years of postseason baseball. There have been lots of big blowouts this October, but the overall number of blowouts is unremarkable.
It’s not because we just ended up with a bunch of playoff teams that don’t try to swipe bases. According to Statcast, the Mariners, Cubs, Yankees, and Brewers were all in the top 10 in takeoff rate this season, and the 12 playoff teams combined for a takeoff rate that was 8% higher than the league average. Seattle leads all teams this postseason with six steals, but they’ve come from just two players; Arozarena has swiped four bags on four attempts, while Naylor, aka Thickey Henderson, has two steals on two tries. Only one other player, Trea Turner of the since-eliminated Phillies, has stolen multiple bases this postseason. On the other hand, the defense does have something to do with it.
Playoff catchers Austin Hedges, Carlos Narváez, Carson Kelly, J.T. Realmuto, Tyler Heineman, Will Smith, and Dillon Dingler were all among the top 15 at catching basestealers on a per-pitch basis this season, according to Statcast. Twelve of the top 20 made it to the playoffs. In fact, only three players who have caught at all this postseason – Ben Rortvedt, Tyler Stephenson, and Austin Wells – have graded out below average. The number I’m using here is Statcast’s Caught Stealing Above Average Per Throw, and when you prorate all the innings of the various catchers this postseason, you get a combined CSAA of 0.05 per throw, enough to put a catcher in the 76th percentile. So far this postseason, there’s been an above-average throwing catcher behind the plate 83% of the time. That really does sound like enough to dissuade potential basestealers.
Still, there’s no way to know for certain why basestealing has dropped off so steeply this October. Is it just because of the catchers? Is it because of the trouble scoring runs or a particularly intense bout of risk aversion? Is there another factor that we haven’t even talked about? What we can say is that runners haven’t picked the wrong times to steal. So far, runners have swiped 74% of the bases they’ve tried for, just one success away from the regular season rate of 78%. We can only hope that this consistent success rate emboldens them going forward. Baseball’s more fun when the crime rate spikes.
Davy Andrews is a Brooklyn-based musician and a writer at FanGraphs. He can be found on Bluesky @davyandrewsdavy.bsky.social.
Time to dust off the Steal a Base, Steal a Taco campaign