The Month of the Splitter
The year of the splitter has come and gone. Actually, those of us who follow these things closely know that both 2023 and 2024 were considered the years of the splitter, and then we established back in March that 2025 would be the year of the kick change. While major league pitchers ran a 3.3% splitter rate in 2025, the highest mark since the pitch tracking era started in 2008, that represented a jump of just 0.21 percentage points from 2024. It’s a difference of less than one splitter per team every three games. While the number is still going up, the big increases came in 2023 and 2024, and the pace fell off this year.
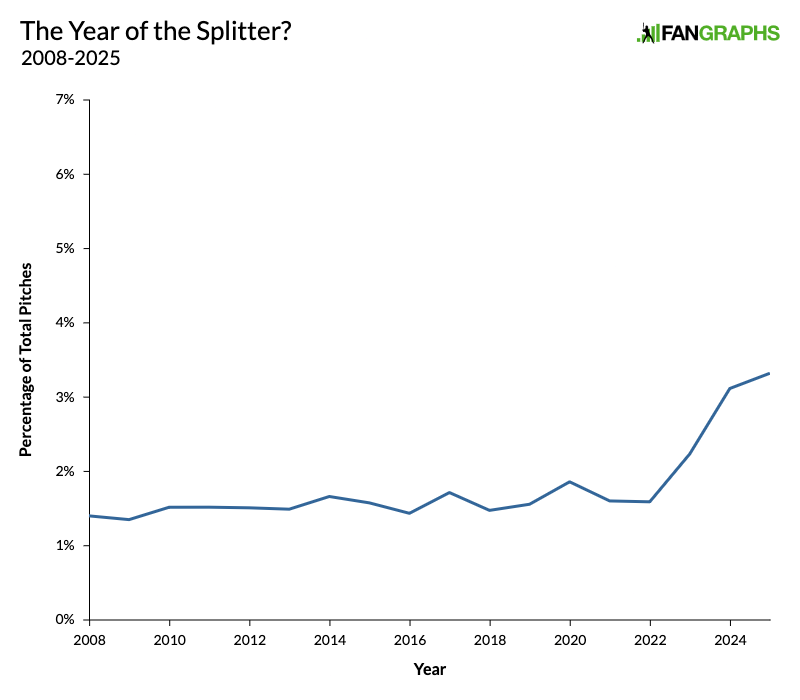
That graph makes it official. This isn’t the year of the splitter. But now let me add another line to that graph. That was the regular season. We’re in the thick of the playoffs, so let’s throw the postseason in the mix, too. If you saw that first graph and wondered why I left all that empty space at the top, well, now you know.

That’s more like it. October 2025 has seen a splitter explosion. The red line is always going to be more volatile than the blue line because the postseason is such a small sample, but even so, the playoffs have seen a 6.6% splitter rate. That’s not just the highest we’ve ever seen. It’s twice the rate for any regular season or postseason in the past 23 years. Maybe 2025 was the year of the kick change, but October 2025 is very definitely shaping up to be the month of the splitter. The playoffs aren’t even over, and we’ve already seen more splitters this October than in the postseasons of 2023 and 2024 combined.
As for why it’s the month of the splitter, there isn’t one big answer. Instead, we’ve got lots of little answers. It starts with the teams that made the postseason. Generally speaking, they were pretty splitter-happy. Eight of the 12 playoff teams were in the top half of the league in splitter usage, and four of them were in the top 10. Together, they threw splitters 4% of the time, compared to 3.1% of the time for the teams that didn’t make the playoffs. The Blue Jays led the league with a 9.3% splitter rate and the Dodgers were third at 7.1%, and their deep runs mean that we might push that 6.6% figure even higher during the World Series. What’s more, nine of the 12 teams that made the playoffs raised their splitter rate during the postseason. The Blue Jays are up to 16% splitters in the playoffs. Nearly one in every six pitches thrown by a Blue Jay this October has been a splitter!
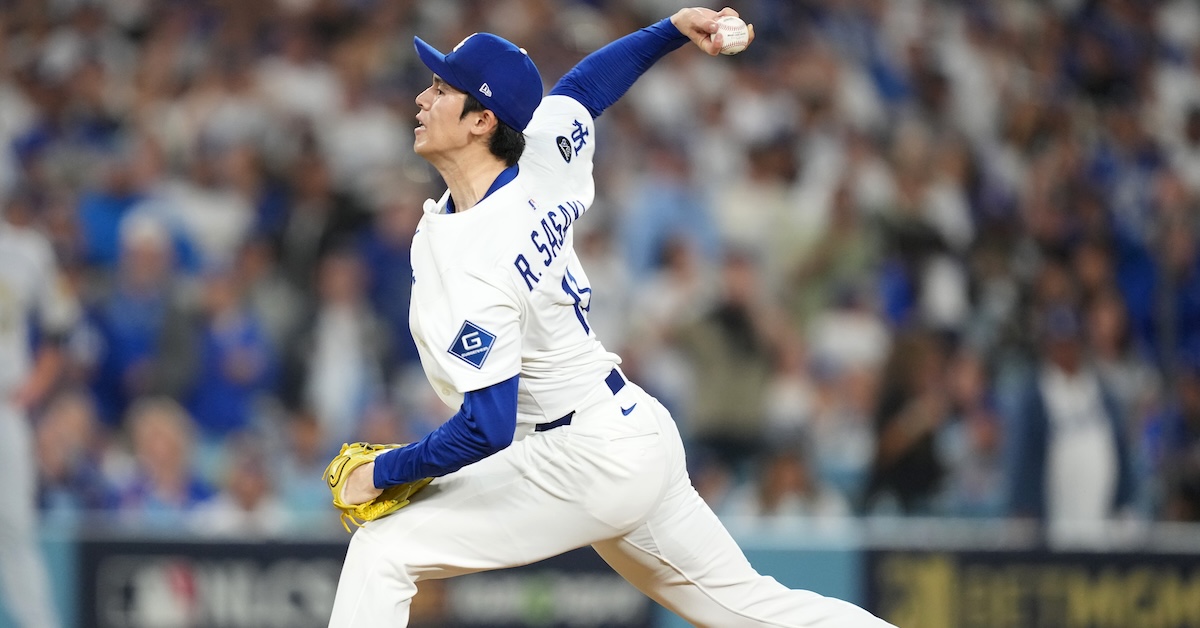
The same story goes for individual players. So far, 38 different players who threw a splitter during the regular season have pitched during the playoffs, but they’ve pitched much more often. During the regular season, those 38 pitchers combined to throw 18.3% of the pitches for their respective teams. During the postseason, those pitchers have thrown 36.2% of the pitches. If you throw a splitter, your workload has effectively doubled in the playoffs! We had Kevin Gausman pitching on his side day, and Bryce Miller pitching on short rest. We had Roki Sasaki emerging as a shutdown closer, and Eduard Bazardo pitching in seemingly every single game.
Moreover, at least some of those 38 players seem to have been chosen because they throw a splitter. I say that because, taken as a group, they’re throwing splitters more often than they did during the regular season. Once you prorate for the number of pitches they’ve thrown, based on their regular-season splitter rates, you’d expect those players to combine for a splitter rate of 16.7% in the playoffs. Instead, they’ve combined for a splitter rate of 18.3%. The Tigers had the second-biggest jump in splitter rate, and they’re all over the top of the leaderboard. Rafael Montero, Kyle Finnegan, Casey Mize, and Troy Melton all jumped at least 17 percentage points. The Blue Jays and Dodgers are right behind them, with entries from Sasaki, Jeff Hoffman, Trey Yesavage, Gausman, and Shohei Ohtani rounding out the top 10.
All this makes sense once you look at the postseason offenses. Yankees and Guardians batters saw splitters 4.2% of the time during the regular season, tied for the highest mark in baseball. Teams clearly thought they could attack them that way during the regular season, so of course the Tigers increased their splitter rate during the playoffs against Cleveland. The Yankees ran a .251 wOBA against splitters, and a .342 wOBA against all other pitches. That 91-point gap was the fourth highest in baseball. The Mariners had the seventh-highest gap, and then both the Yankees and the Mariners went up against the Blue Jays, the most splitter-happy team in the league. No wonder Toronto pushed its splitter rate even higher! The Brewers had a 69-point gap, ninth highest in the league, and they had to face the Dodgers pitching staff, which ran a regular-season splitter rate of 7.1%, third highest in baseball.
As for the World Series, we’re sure to see a lot of splitters because of the pitching staffs in question. Both the Blue Jays and Dodgers hit splitters particularly well this season, but they fell off hard in October. The Blue Jays ran a .345 wOBA against splitters and had a run value of 2.3 runs per 100 pitches. Both marks were the best in baseball. Toronto also was the only team with a better wOBA against splitters than non-splitters. The Dodgers’ .298 wOBA against splitters was fifth best in baseball, and their 1.2 run value per 100 ranked fourth. In the playoffs, however, both teams have put up a negative run value against the pitch with a combined wOBA of .170. Split-tober is likely to continue.
Davy Andrews is a Brooklyn-based musician and a writer at FanGraphs. He can be found on Bluesky @davyandrewsdavy.bsky.social.
The Yankees are going to need to tighten that splitter hitting rate, given that Gausman/Yesavage aren’t going anywhere anytime soon.