2010 Disabled List: Position Data
A few days ago, I put out the list of players that spent time on the disabled list in 2010 along with the some team data. Today, I will look at how the DL data breaks down by position.
To begin with, here is how each team is broken down by the numbers of days on the DL between when comparing pitchers and hitters:
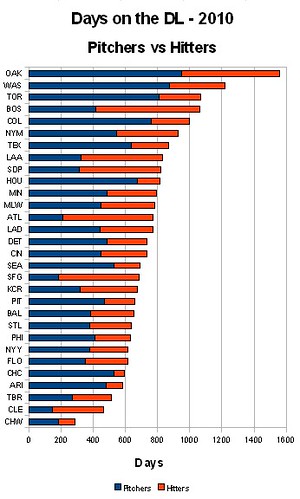
The only piece of information that jumped off to me was comparing the days lost by pitchers of the Boston Red Sox and the Arizona Diamondbacks. The Diamondbacks, which lost the 4th lowest number of days, lost more days to pitchers than the Red Sox, which had the 3rd highest total of days lost.
Next, here is a chart comparing the difference in the number of trips to the DL vice the number of days lost for each position:

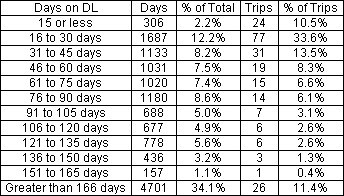
Generally, each position, besides pitchers, loses the same number of days and trips when compared to other position players. When combined, the position players have about the same number of trips to the DL as pitchers. Once on the DL though, the pitchers are more likely to remain on the list for a longer time. This difference can further be seen in the following 2 charts:
Pitchers
Hitters
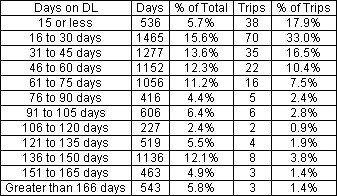
The main difference I noticed from the numbers is the high percentage of pitchers than spend >165 days on the DL compared to hitters. Barely any of the hitters on the DL, 1.4%, are out for an entire year, but 11.4% of the pitchers make the longer stay.
For the next installment, I will be breaking down the data by injury type (i.e. strain) or body location (i.e. elbow).
Jeff, one of the authors of the fantasy baseball guide,The Process, writes for RotoGraphs, The Hardball Times, Rotowire, Baseball America, and BaseballHQ. He has been nominated for two SABR Analytics Research Award for Contemporary Analysis and won it in 2013 in tandem with Bill Petti. He has won four FSWA Awards including on for his Mining the News series. He's won Tout Wars three times, LABR twice, and got his first NFBC Main Event win in 2021. Follow him on Twitter @jeffwzimmerman.
Not surprising that the two teams with the fewest pitchers lost in the NL (ATL and SFG) had the lowest park-adjusted ERAs in the league.
How does injury data correlate with park factors?
It doesn’t. Read it again.
Nice find