
A Nick Castellanos-Inspired Look at Directional Outs Above Average
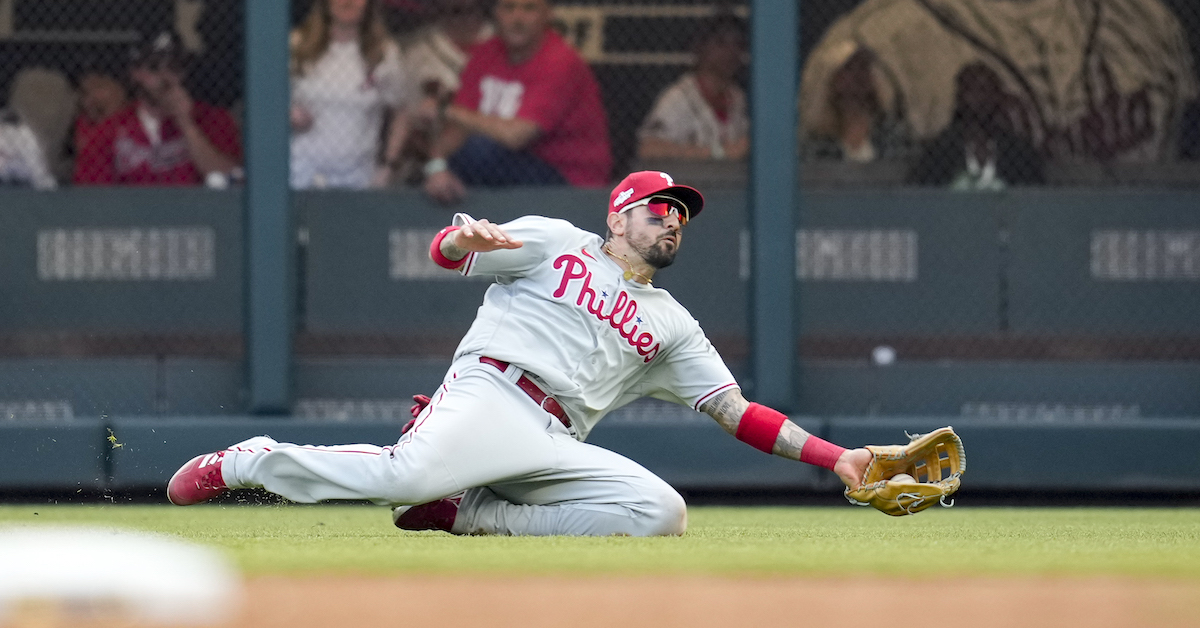
Nick Castellanos was not good during the 2022 regular season. He was especially bad on defense, costing the Phillies an estimated eight runs. In the playoffs, however, he made a few impressive catches. In fact, his four best plays of the season came in the postseason. His October excellence began in Game 1 of the NLDS, when he made this snag in the bottom of the ninth inning to help preserve a one-run Phillies lead:
He would go on to make two similar grabs in the World Series. This one came in Game 1, with two outs and the winning run on second the bottom of the ninth:
And this one started off Game 3:
He also made three such plays during the regular season, as my colleague Davy Andrews recently highlighted. Unsurprisingly, Castellanos performed best on balls hit in and to his left, or “in right” according to the home-plate centric directional Outs Above Average (OAA):
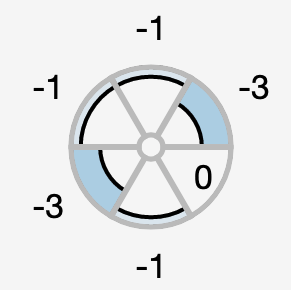
Kyle Tucker, Castellanos’ World Series counterpart, also performed best on balls hit in and to his left. This got me thinking: Castellanos and Tucker, who both field right-handed, should have an easier time making grabs to their left because they don’t have to reach across their bodies. Does this hold for all righty outfielders?
I decided to come at this question from a few angles. First, I wanted to find out if righties performed better on average relative to themselves when going to their left, as Castellanos and Tucker did. Then, I tried to find out if this also held true for lefties; the explanation in this case would be that moving left is easier in general, not just for righties. Lastly, I compared the performance of righties and lefties on plays to their left.
Below are the numbers for the 240 players (181 righties, 59 lefties) with at least 250 total fielding opportunities — about a season’s worth — in the outfield since 2016, when Statcast first began tracking directional OAA. For the rest of this article I will refer to the directions from the point of view of the player, such that “left” means to the player’s left rather than to the left relative to home plate:
| Fields | OAA Right | OAA Left |
|---|---|---|
| L | 0.32 | -1.64 |
| R | 0.57 | 0.28 |
Right-handers have clearly outperformed left-handers on balls hit to their left. They’ve also been better than lefties on balls hit to their right, but by a much slimmer margin. By closing the gap in this way, lefties demonstrated a much larger difference between their performance going left versus going right. All players, regardless of handedness, performed better moving to their right.
After this first look, the question remained as to how robust these results were. To examine how players fared moving to the left relative to their own performance to the right, I used paired t-tests, which allowed me to control for the differences in total fielding opportunities across players. These tests indicated that for all players, the difference between going left and going right likely wasn’t due to chance. This was mostly due to the lefties; among those players, the difference in performance across directions was statistically significant. For righties, the difference was not.
Below is a graph indicating the relationship between OAA on balls hit to a player’s right and on balls hit to a player’s left. Each point represents one player:
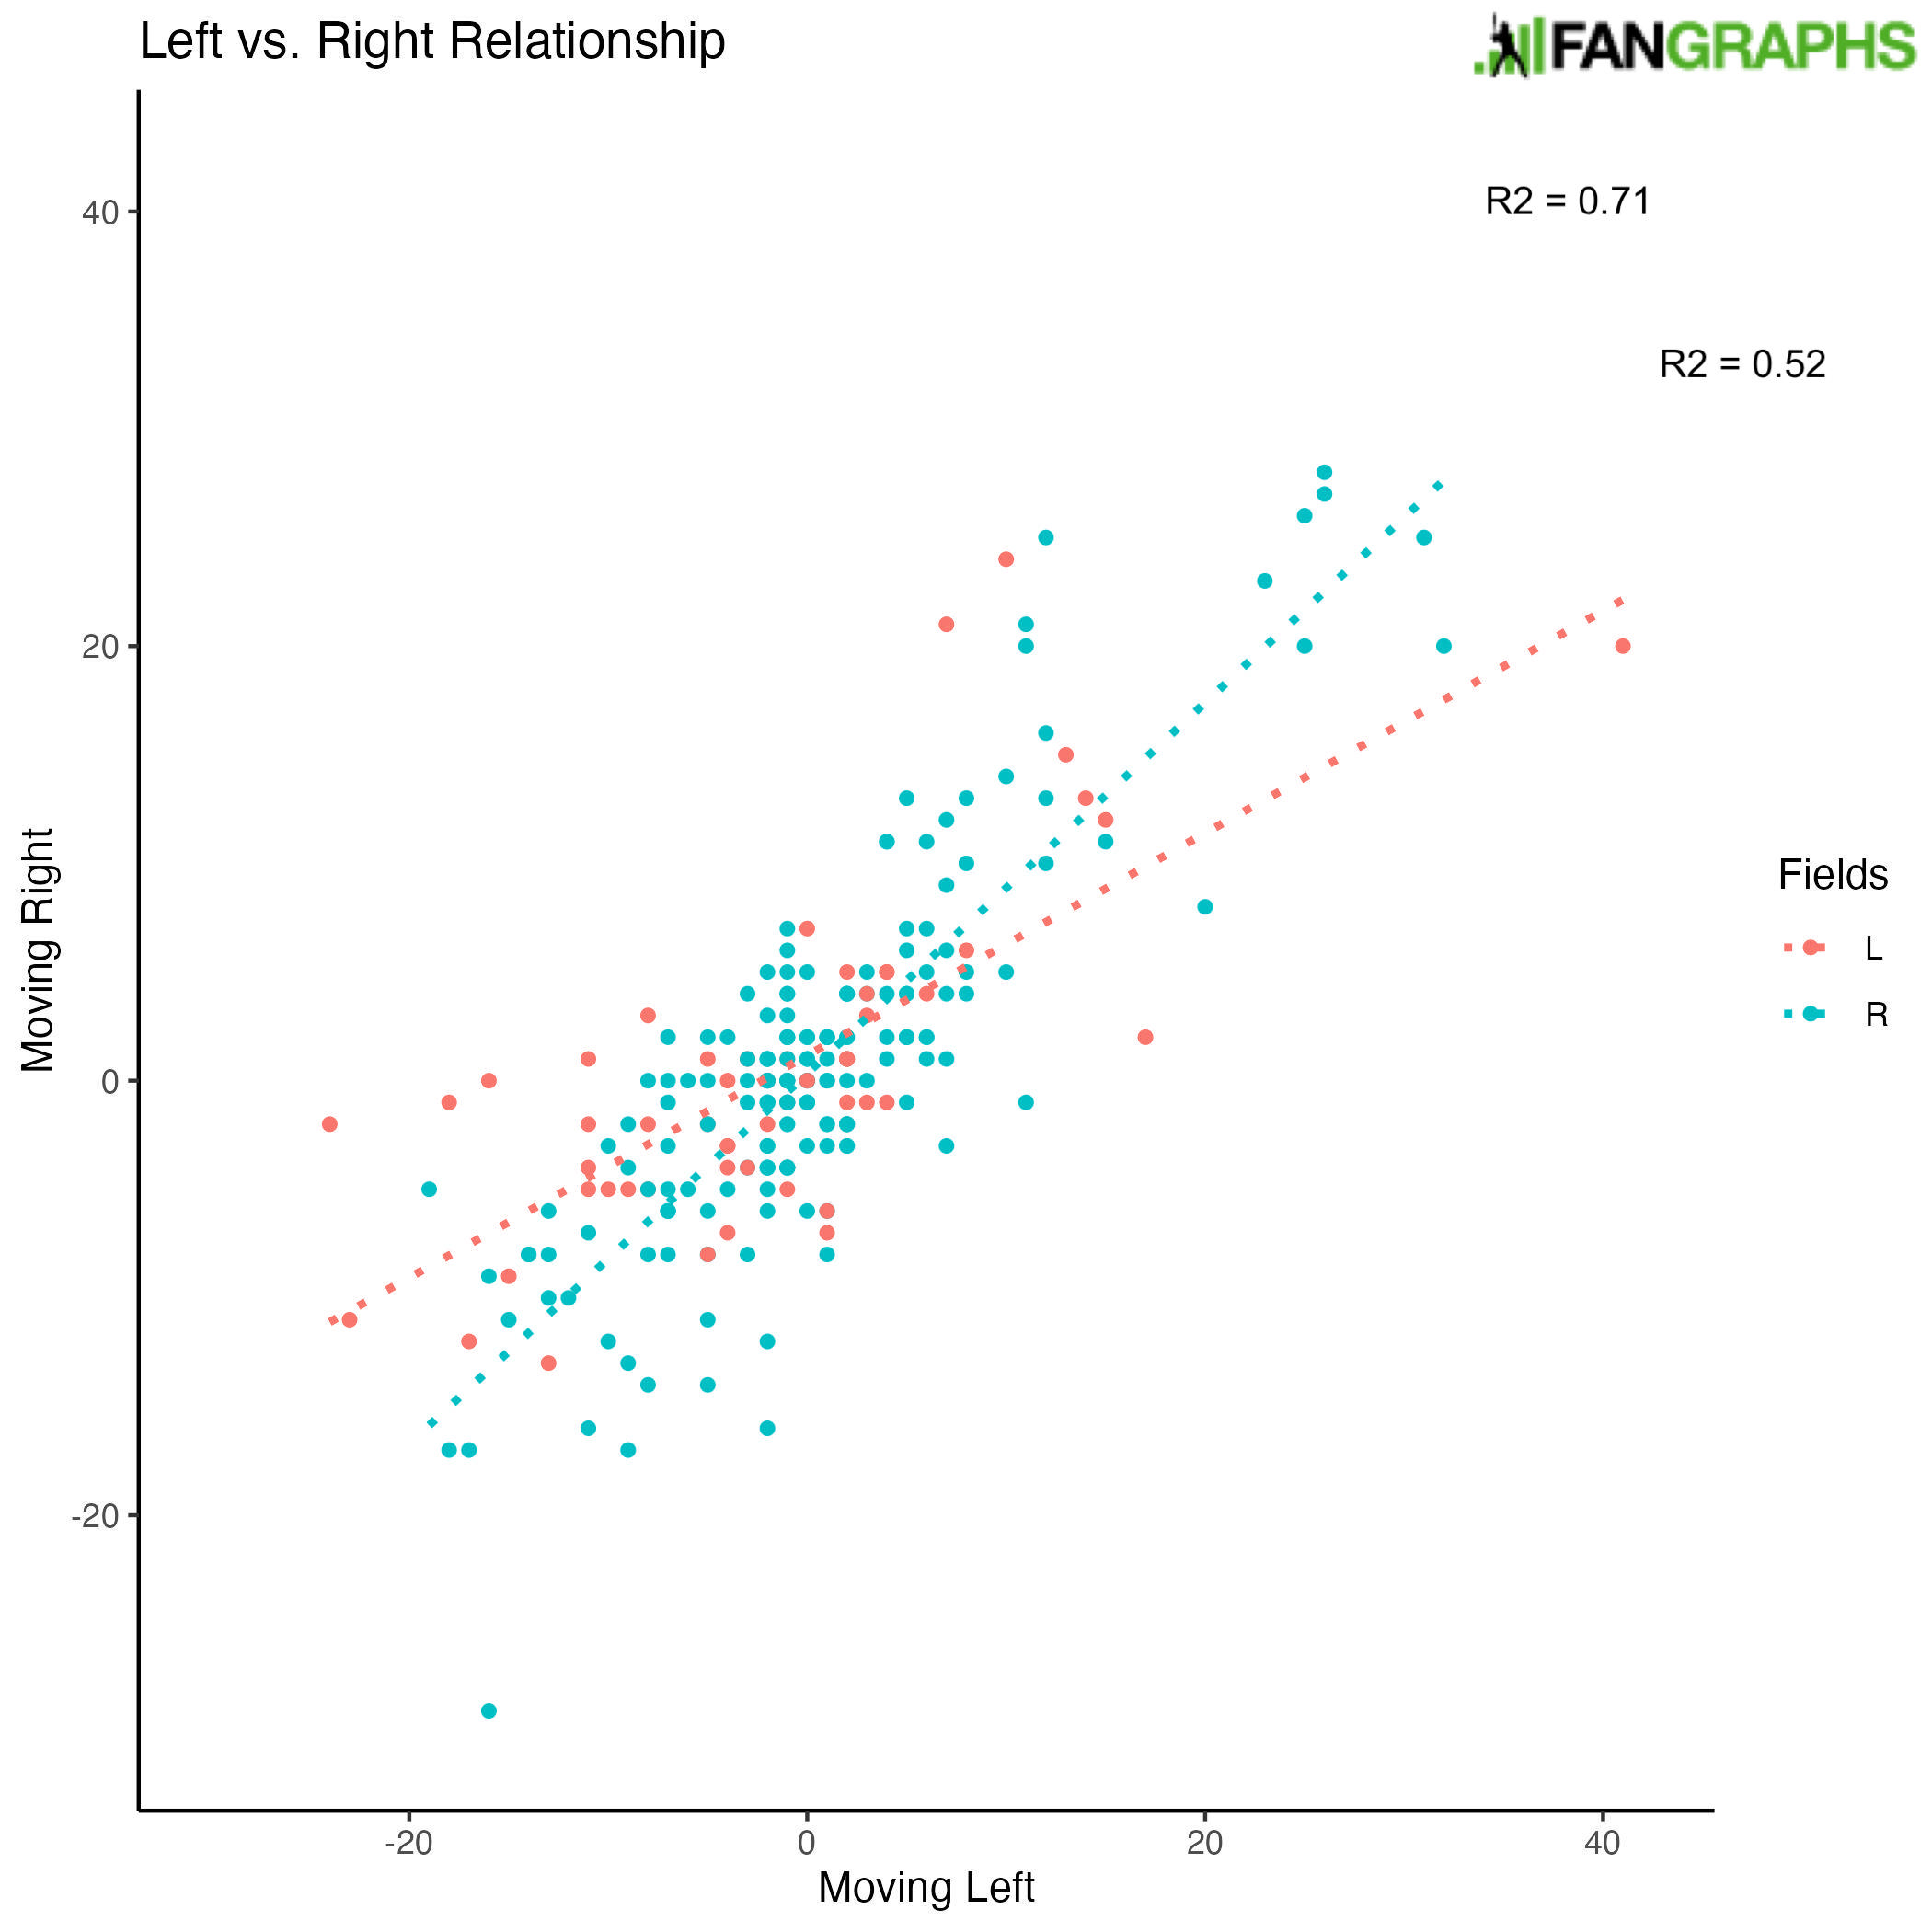
For righties, the relationship is both stronger and steeper (i.e., closer to a perfect diagonal), reflecting the minuscule and statistically insignificant average difference in performance across the two directions. For lefties, the weaker relationship is indicative of the larger divide between the two directions. But the relationship is still pretty strong; good fielders tend to be good across the board, and vice versa for bad ones.
Speaking of good fielders, the reason I controlled for attempts is that they received more of them (marginally, but significantly). Castellanos and other injury-replacements are the exception:
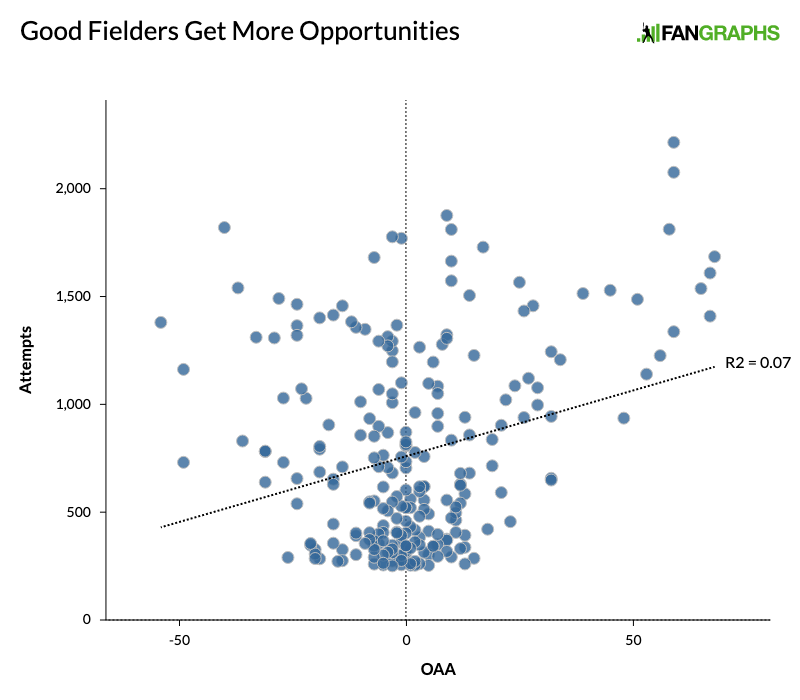
But paired t-tests aren’t viable for inter-group comparisons (i.e., between righties and lefties rather than within each group). For these, I looked at OAA per attempt in order to control for differences in the number of opportunities:
| Fields | OAA Right | OAA Left |
|---|---|---|
| L | -0.00041 | -0.0022 |
| R | -0.00040 | -0.0011 |
As with raw attempts, righties clearly outperformed lefties moving to their left and slightly outperformed them moving to their right. Yet they were not superior in either category by statistically significant margins; in case you were wondering, the same held true for raw attempts.
What does this all mean? Rather than moving left being universally easier, moving right was. Due to the statistical insignificance of this finding in the righty sample, it might not hold upon further examination. However, the results indicating that lefties fare better moving to their right are robust. This at least fits with the reaching-across-the-body theory.
A point in favor of righties faring better to their left, however, was the fact that they outperformed lefties in this regard. While this result was not statistically significant, the effect size was large: righties bested lefties by nearly 2 OAA on average. This prompted me to look deeper into the numbers. I was curious to see just how much of an aberration Castellanos and Tucker were. Their preference for balls hit to their left stood out among outfielders on the whole, but what about among right-handed right fielders?
Fifty-one of the 181 righties in the dataset primarily played right field when they were on the outfield grass. This subset of the righty outfielders was the only one that performed better moving to their left than to their right:
| Primary Pos | Fields | OAA Right | OAA Left | n |
|---|---|---|---|---|
| CF | R | 6.07 | 5.01 | 74 |
| LF | R | -3.02 | -3.82 | 56 |
| RF | R | -3.45 | -2.10 | 51 |
| CF | L | 3.41 | 4.59 | 17 |
| LF | L | -1.83 | -6.42 | 24 |
| RF | L | 0.28 | -1.17 | 18 |
This was largely because of right fielders’ plus rating moving to the left and in — they notched a 0.63 OAA in that direction compared to a -2.73 OAA moving left and back. Lefty center fielders, meanwhile, were the only lefties more adept at moving to the left.
Statcast doesn’t provide data on attempts broken down by direction, which would be the easiest way to determine if major league teams were putting their right handers who are most adept at moving to the left in right field because right fielders move to the left more often. Instead, I turned to spray angle and average fly ball distance:
| Pos | Ball Angle | Ball Dist | Fielder Angle | Fielder Dist |
|---|---|---|---|---|
| CF | 0.22° | 325.76 | 0° | 321 |
| LF | -24.84° | 310.49 | -27° | 297 |
| RF | 25.32° | 298.38 | 27° | 294 |
By these numbers, the most common move for a right fielder is actually slightly back and right, so maybe there is no rhyme or reason to why the best direction for righty right fielders is moving left and in. But for righties on the whole, it still stands to reason that their superiority compared to lefties when moving left might be because they don’t have to reach across their body. Though this result alone might seem like it is due to chance, when coupled with lefties’ performance to the right, glove-side movement may still prove easier for outfielders.
Alex is a FanGraphs contributor. His work has also appeared at Pinstripe Alley, Pitcher List, and Sports Info Solutions. He is especially interested in how and why players make decisions, something he struggles with in daily life. You can find him on Twitter @Mind_OverBatter.
First, this article was really great. I love how you parsed the data a few different ways to try and get a complete picture.
Second, after reading this, between LF v RF positions, LH v RH fielders, and OAA-L v OAA-R, I no longer can tell my own left from right.