A Periodic Quality-of-Contact Update
Are you suffering from fatigue related to talk of the home-run surge, the prospect of a juiced ball, and the idea of an air-ball revolution? No? Excellent.
As you’re probably aware, home runs keep flying out of major-league stadiums — and, if anything, are doing so at an ever faster rate, as Jeff Sullivan documented earlier this month.
Rob Arthur, Mitchel Lichtman, and Ben Lindbergh have led the charge to examine the ball’s role in these matters, their most recent work appearing at The Ringer earlier this month. It’s a must-read piece. They make a compelling case that the ball is different — and playing differently. Though, as Dave noted last month, Dr. Alan Nathan suggests it’s not an “open-and-shut” case.
Of course, a juiced ball doesn’t make much difference if it’s hit into the ground or popped into the air. Even if the ball is juiced, it still has to be hit squarely to become a home run. I suspect there are a number of factors going into the home-run surge, and I continue to believe the air-ball revolution is among them, the idea that major-league hitters — at least a portion of the population — are more often getting on plane with pitches.
However hitters chose to articulate it, batters are making slightly better contact with pitches. They’re slightly better at squaring them up. The most basic way to examine this is to note that ground-ball rate has fallen from 45.3% in 2015 to 44.7% this season and to 44.4% in 2017 while infield fly ball has remained steady between 9.7-9.5% the last three seasons. The #GroundballsSuck movement has merit.
But let’s throw out pop ups and ground balls. The goal is to hit line drives and balls that have a chance to leave the ballpark. The average launch angle of a home run in the Statcast era is an even 28 degrees, and batters are more often producing batted balls in that 25-to-30 degree range.
Consider in the first half of 2015. Of all batted balls, 5.80% were put in fair territory at a launch angle between 25-30 degrees. In the second half of 2015, that figure increased to 5.93%. The rate increased again to 6.13% last season and is up to 6.18% this season. While just a fractional increase, it’s one that adds up to hundreds of batted balls over the course of the season. There were 7,660 fly balls launched between 25-30 degrees in 2015; 7,907 in 2016; and we’re on pace to push 8,000 this season, even with strikeouts on the rise.
And it’s not just the number of balls exiting at a certain steepness; it’s also that they’ve leaving the bat with slightly more velocity, from 90.7 mph in 2015 to 91.3 mph in 2016 to 91.2 mph this season. Meanwhile, the exit velocity of low line drives and harder hit ground balls — batted balls ranging from -10 to 10 degrees — has remained steady, from 92.2 mph in 2015 to 92.4 mph in 2016 and 92.4 mph again this season.
This could speak to batters better optimizing their swings, of an improved process.
Over the last day or so, Tom Tango has posted some interesting research via his Twitter account of batted balls and the home run. Tango found that batters have increased their exit velocity in the higher launch-angle zones:
Since @JPosnanski asked, we can see how EV is maximized at low angles, but see the recent blue/green has shifted their maximum EV points. pic.twitter.com/TZC9N3G8XK
— Tangotiger ? (@tangotiger) June 26, 2017
And Tango also found balls launched from 26 to 30 degrees, at varying exit velocities, aren’t traveling further.
Distance of batted balls, by launch speed, limited to launch angles 26 to 30, year by year cc: @mitchellichtman @PhilBirnbaum @pobguy pic.twitter.com/dPeDz31Dvu
— Tangotiger ? (@tangotiger) June 25, 2017
So while balls launched in that 25- to 30-degree sweet spot might not be traveling much further, there are more balls being launched in that range.
There’s also this: more pitches are being thrown down in the zone. The slight uppercut swing path, meanwhile, is designed to take advantage of such pitches.
According to the “detailed” pitch zone at Baseball Savant, 37.8% of pitches crossed the plate in the lower third the zone or below it in 2015. That figure increased to 38.1% last season and 39.9% this season. While fastballs at the top of the zone have increased, there are also more fastballs being thrown down in the zone. In 2015, 27.7% of four-seamers, two-seamers and sinkers, as classified by Statcast, were thrown in the lower third or below the zone, compared to 28.6% this season.
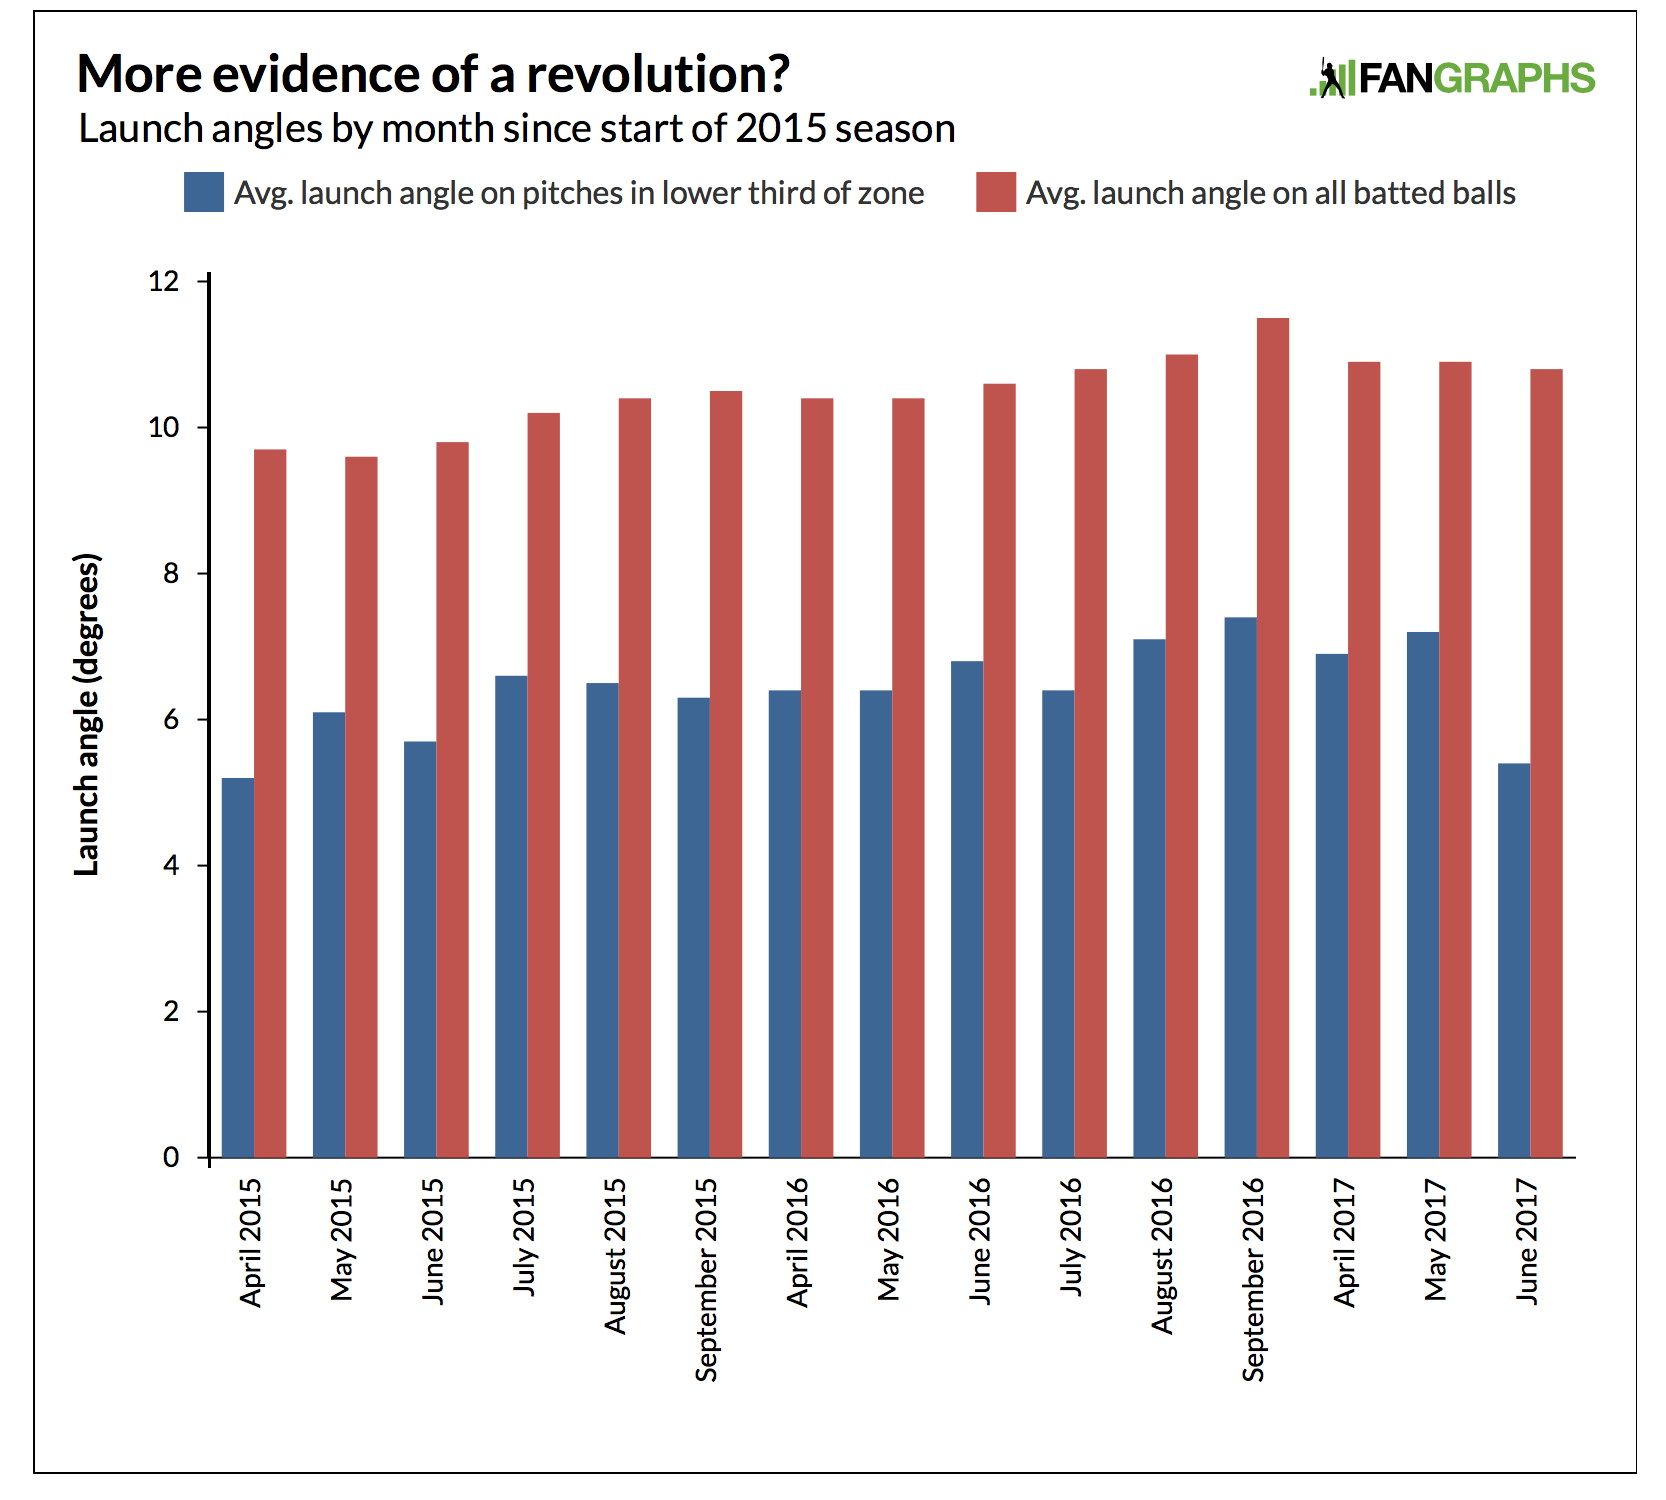
Those pitches are still harder to lift and drive than an elevated pitch, but major-league hitters have combined to do a slightly better job of it since the midpoint of 2015. Not only has launch angle generally and gradually increased in the Statcast era, but it has particularly increased in the lower third of the strike zone:
Consider the following month-by-month chart:
Or, if you prefer data in table form:

Coinciding with the home-run surge in the second half of 2015 is a slight increase in launch angle. It doesn’t explain everything, but it perhaps explains something.
There is also the idea that batters are taking more of a risk-reward approach, swinging for power more often with the negative side effect of swinging and missing — and striking out — more often.
Joey Votto and Eric Thames have talked about funneling pitches into zones where they can best damage them. And it’s interesting that MLB batters have produced an average launch angle of 15 degrees this season against pitches in the center of the strike zone compared to 14.6 degrees last season and 13.7 degrees in 2015. It could be such approaches are allowing batters to better hammer mistakes.
There are perhaps many reasons why batters are powering up. The 21st century athlete should also be in better condition, he should be stronger, he should have superior bat speed. But there’s also the swing. MLB batters are not just getting off the ground, they are more often getting into ideal positions to do damage. It seems logical that, just as the data age has allowed for more efficient defensive play and alignment, it should also help produce more efficient swings. Perhaps we are seeing more evidence of just that.
A Cleveland native, FanGraphs writer Travis Sawchik is the author of the New York Times bestselling book, Big Data Baseball. He also contributes to The Athletic Cleveland, and has written for the Pittsburgh Tribune-Review, among other outlets. Follow him on Twitter @Travis_Sawchik.
It’s incredible that just a year or two ago many were lamenting the information advantage — saying that pitching and defense benefited more from the mountain of information available. Now we might be seeing hitters catching back up, in their own way.