Aging Curves and Platoon Splits: Introducing the Albert Zone

Hello, and welcome to an article where I’m wrong about everything. Like literally all of the things. Here’s what happened. I was thinking about the long, glorious farewell tour of Albert Pujols. After a five-year stretch during which he posted a wRC+ of 84, he put up a 151 wRC+ in 2022. That was the best he’d hit since his age-30 season. Pujols largely put up those numbers by smashing lefties. His 113 wRC+ against righties was good, but against lefties that number was 214. MVP Paul Goldschmidt was the only batter who performed better against lefties (minimum 130 plate appearances vs. southpaws).
Pujols’ resurgence really started in 2021, when he had a 145 wRC+ against lefties and a 35 against righties. That’s the season I was more interested in. As I thought about it, I started wondering whether the last part of his journey — established veteran defies the aging curve by settling comfortably into a platoon role — is happening more frequently. I had the sense that it was happening more frequently.
I was wrong. It is not happening more frequently. Here’s a graph comparing the last 11 years to the previous 10 years:
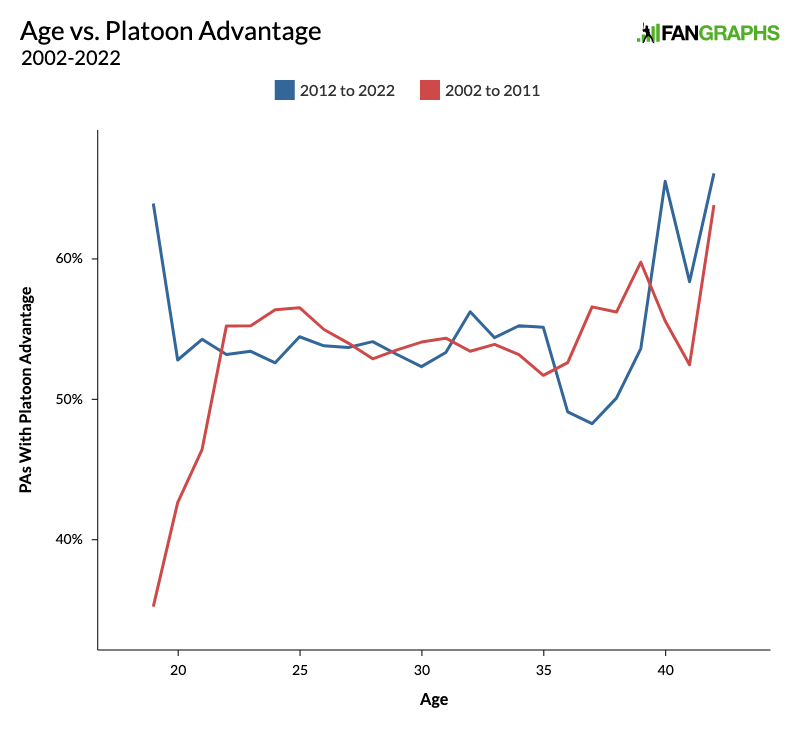
When you look at the main timeframe I had in mind, age 35 and onward, players have the platoon advantage a lot less often than they used to. I’m only right once you get past 40, where the sample sizes are so small that Pujols and Nelson Cruz can break the scale all by themselves. (As a note, none of the charts in this article go past age 42, and for that, I would like to offer my sincere apologies to Julio Franco.)
Before I knew I was wrong about that, it occurred to me that maybe batters age better against opposite-sided pitching than they do against same-sided pitching. I was wrong about that too. But had I been right, I don’t think it would have been a shocking discovery. After all, the platoon effect has its component parts, and the average batter has a slightly different profile depending on the handedness of the pitcher. Specifically, they strike out more against same-sided pitching, and they walk more and hit for more power against opposite-sided pitching:
| Pitcher | K% | BB% | ISO |
|---|---|---|---|
| Same Side | 20.5% | 7.2% | .147 |
| Opposite Side | 18.4% | 9.3% | .164 |
From Jeff Zimmerman’s work on aging curves, we know that certain skills hit their peak and decline phases at different times. We’re talking about very small margins here, but it’s not necessarily farfetched to guess that if certain combinations of skills are more helpful against same- or opposite-sided pitchers, and those skills wax and wane on different timeframes, that there might be ages when a player is relatively better equipped to face one or the other.
So I had a hypothesis and I had some numbers that could maybe help explain why it was right or wrong. However, it’s now time to acknowledge Occam’s razor. There is a much less convoluted hypothesis as to why players are better suited to platoon roles as they age. It’s a pretty obvious one, and I drew a suitably crude graph to illustrate it. We’re focused on the shaded portion on the right. Call it the Albert Zone:

Assuming you start out better against opposite-sided pitching and your skills decline against all pitchers at the same rate, you’ll eventually hit a period of time when you’re no longer good against same-sided pitchers but still playable against opposite-sided pitching. That sounds like the definition of a platoon player, as well as a much simpler explanation.
To test my doomed, more creative hypothesis, I pulled data from 2002-22 and learned how to calculate an aging curve. If you’re not interested in the mathy side of things, please feel fee to skip the next two sentences and know that my dad will be doing the same. I used the delta method, measuring the difference between each player’s wRC+ from one season to the next. I set a minimum of 150 plate appearances, and I weighted the seasons by the harmonic mean of their plate appearance totals.
Before we warm ourselves next to the flaming wreckage of my hypothesis, let’s just take a moment to admire the aesthetic appeal of this graph. It may not line up with my theory, but it’s a looker:
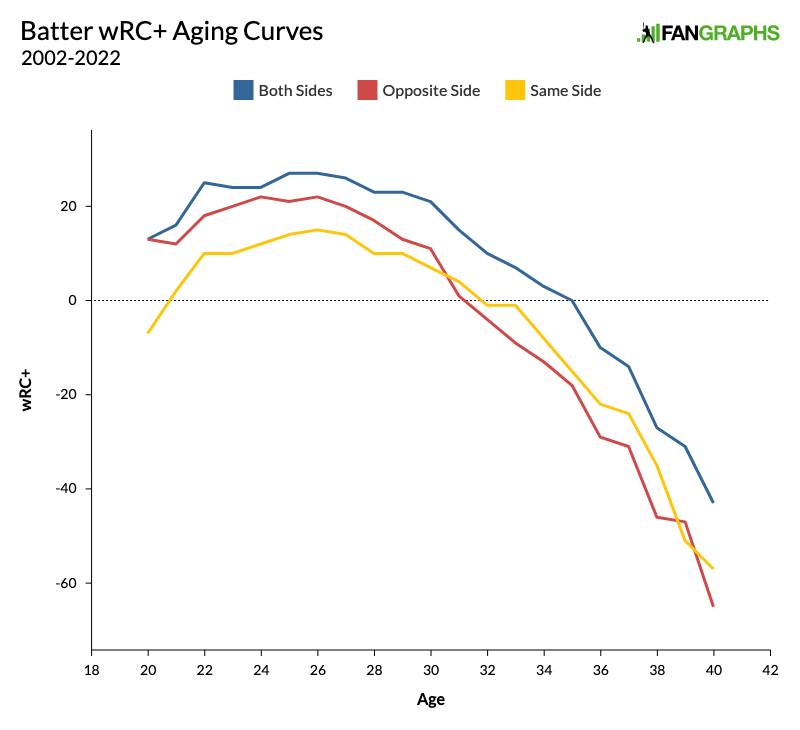
This gorgeous piece of bad news indicates that batters actually decline slightly slower against same-sided pitchers. It’s nowhere near enough to make a dent in the platoon advantage, but it’s enough to disprove a hunch.
Because I just can’t help myself, I’m going to offer a theory as to why the decline phase seems to happen slightly faster when the batter has the platoon advantage. If you follow the earlier link to Jeff Zimmerman’s article, you’ll see these graphs (among others):

ISO peaks around age 22 to 26, strikeout rate bottoms out at age 25, and walk rate peaks from around age 29 to 31. We can combine that with what we know about these three stats and the platoon effect. Coincidence or not, performance against opposite-sided pitching starts to decline more rapidly only when both ISO and walk rate, the stats that normally set opposite-side performance apart, are both in their decline phase.
I think that’s at least a plausible theory for what we see in the aging curves, but again, we’re talking about a very small effect and a shrinking sample as players in their 30s find it harder to hold onto a job. It could just be that once your physical skills are going, you fall faster when you have farther to fall. That’s certainly a simpler explanation. Besides, at this point I don’t think anybody should trust one of my theories.
Davy Andrews is a Brooklyn-based musician and a writer at FanGraphs. He can be found on Bluesky @davyandrewsdavy.bsky.social.
I absolutely love that on this website of intense statistical analysis and constant debate and raising of points, we can still have a graph that looks like it was drawn by our 7th grade selves. Appreciate the article, Davy.