Analyzing Kauffman Stadium’s New Dimensions

Yesterday, the Royals made a big announcement. Kauffman Stadium, long one of the most cavernous venues in the majors, is going to be a little less warehouse-like this year. The walls are moving in nine or 10 feet more or less across the board, and getting shorter by a foot and a half to boot. That’s a meaningful change for a stadium where home runs generally go to die. How massive? Time to crank up the old computer and find out.
I plugged the new dimensions from Kansas City’s press release into an equation describing a rough arc. I fit those points to a cubic spline so that it could more closely resemble the actual stadium, with its pinched-in corners. I made a few approximations as well; for instance, the wall is moving to a height of eight and a half feet “in most places,” so I just applied that across the board. I also modeled the old dimensions the same way. That way, I had two different virtual walls built to compare some batted ball data against.
Notably, my approximation isn’t a perfect replica of the stadium. I don’t have a millimeter-scale, or even a yard-scale, map of the place. I can’t account for outfielders robbing home runs, which is definitely going to be more common with the lowered walls, though still quite rare overall. But by running it through both the old and new wall dimensions, I think that this unavoidable error can be minimized. It’s pretty clear that no balls that were home runs with the old outfield parameters will suddenly not be home runs with the new ones, so the thing we’re looking for is the difference, assuming that my approximation is close enough to reality. And it is: My modeling says that over the last three years respectively, 205, 162, and 159 batted balls hit in Kansas City should have turned into homers. In reality, it’s been 186, 147, and 151.
My estimates run a little hot, in other words, but they’re very consistent. A visual inspection of the batted balls that were misclassified is mostly a pile of extra-base hits off the wall, a few strange-angled blasts that trick my trajectory-smoothing model, and a few leaping catches. Any of these will surely turn into homers with the new dimensions. As long as we’re just using this model to look at changes, I feel very comfortable with it, and in fact it may slightly underestimate the increase in home runs.
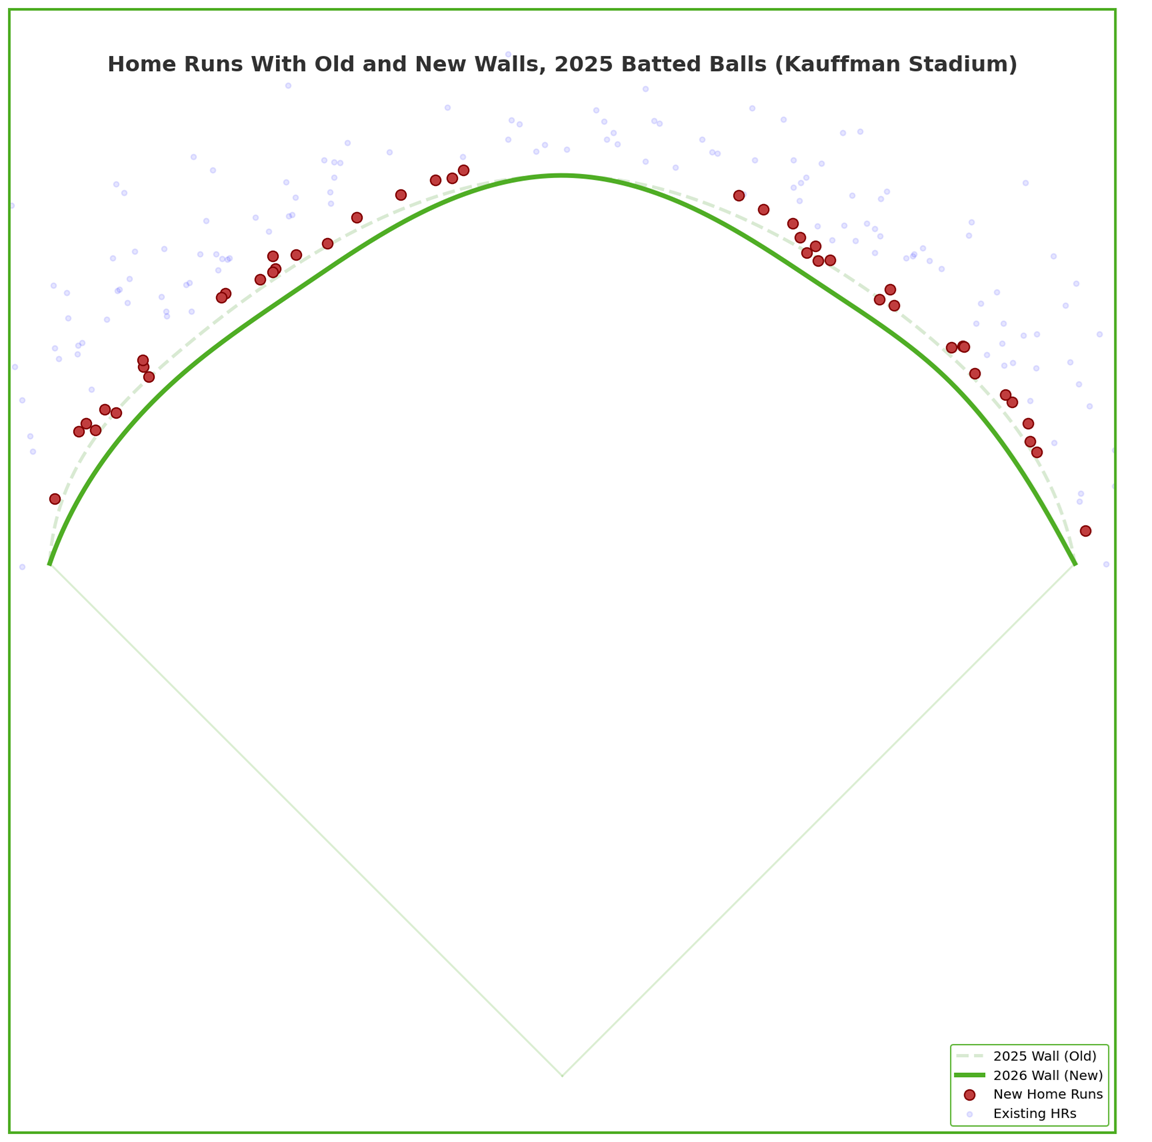
With that said, let’s get to the data. I compared every batted ball from 2025 to both sets of wall coordinates and identified 43 new home runs in the new configuration:
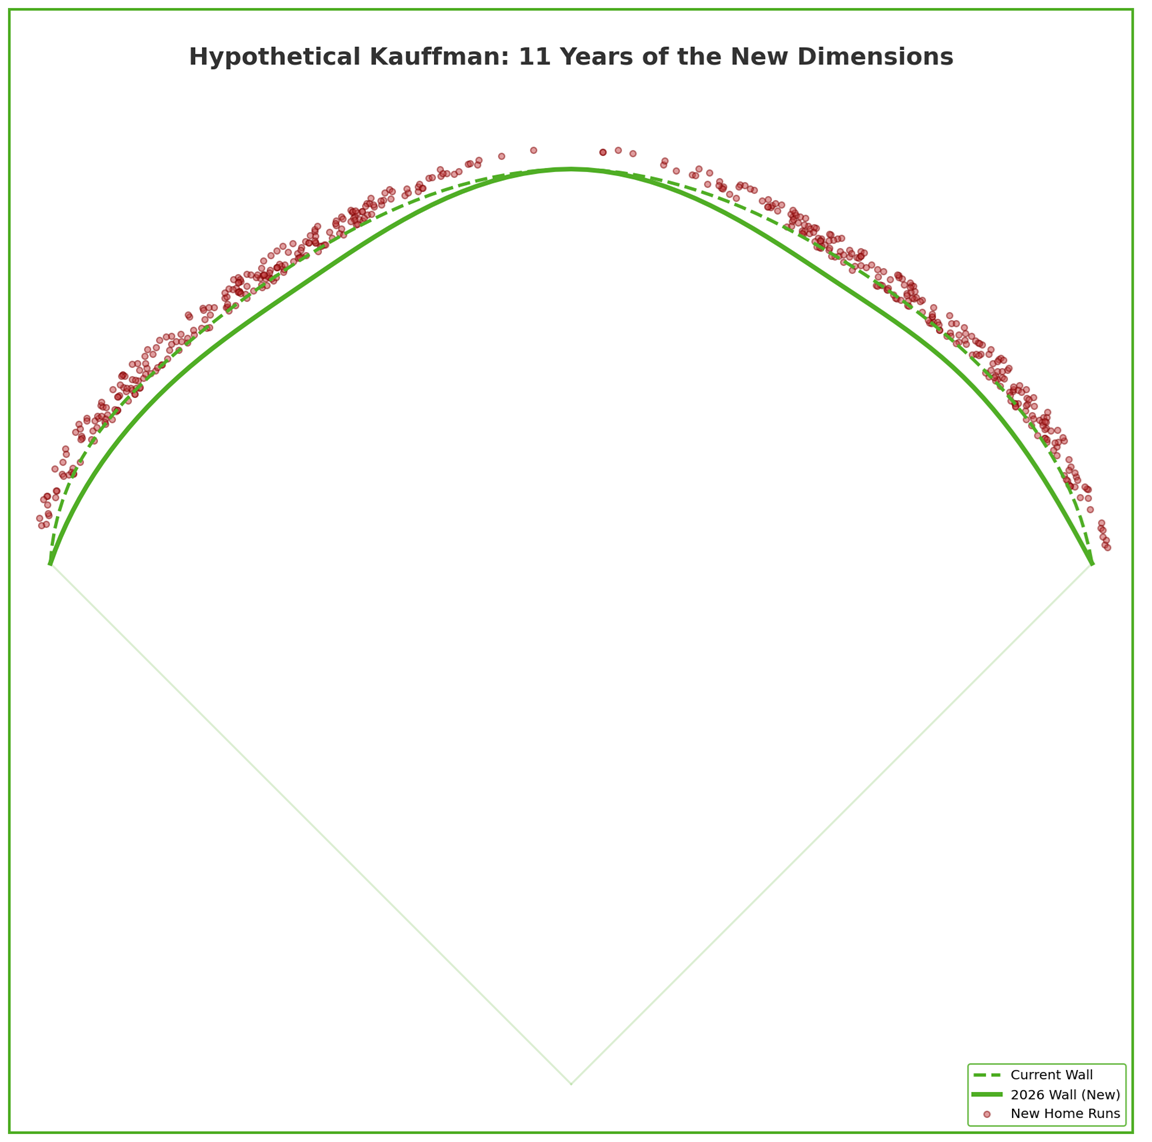
I ran the same test for every year we have Statcast data for – after all, with the walls already virtually built, I can throw a lot of different batted ball sets at it without much effort. The average increase in homers over the past 10 years (excluding the shortened 2020 season, a sentence I’ll probably have to keep writing forever, like Sisyphus) was 51 per season. That’s a chunky increase, and with nine of the 10 values between 40 and 60 (2023 had a 70-homer increase in the power-happiest actual year of Kauffman data), I feel pretty confident in the size of the effect.
What kinds of batted balls have turned into home runs? The most valuable ones you can possibly imagine, basically. Kauffman is huge. Most of the 43 batted balls that I classified as in play in 2025 but home runs in 2026 landed safely for hits even with the old dimensions. They had an average wOBA of .943, with a .700 BABIP. They were missiles, basically; balls hit at ideal home run angles, liners and fly balls shot over the head of outfielders with no chance of getting to them but held in by the giant park. So 43 new homers isn’t 43 more hits – it’s more like 43 new homers, 13 fewer outs, and 30 fewer doubles and triples.
Want to see where the new homers would land? Well, everywhere:
The reason that none of the dots are right at the new wall is that you have to clear it, and the distances I’m using are projected landing points. But you get the idea; pull the walls in everywhere other than center, and you’re going to get a ton more home runs everywhere other than center. The few straggling dots in the middle are the odd beneficiaries of the lower walls.
What will this do to run scoring? I can hazard a guess, though it’ll still just be a guess until we see actual games in the new dimensions. Swap in, say, 50 new homers (a nice round number close to the average increase from above), swap out the aggregate mix of doubles, outs, and triples that they “used” to be, and you get an increase in total run scoring of 57.2 runs across 81 home games. That’s for both teams, of course, since I used every batted ball to bulk up the sample size. That’s an extra .35 runs per team per game, still a meaningful boost. Even after paring that down somewhat on the assumption that fielders will do better on the remaining balls in play thanks to having a smaller area to cover, that’s still a giant lift.
While Kauffman has long been one of the worst stadiums in baseball for home runs, it wasn’t an offensive wasteland. Park factors put it around neutral overall. Last season was actually the first year since 2019 where the Royals scored more runs on the road than at home. That doesn’t mean it’s wildly offense-friendly — home field advantage exists — but a number of different park factor approximation methods independently peg the stadium as roughly average overall. Add 0.3 runs to each team each game, or even 0.25 if you really think that BABIP will decline a ton thanks to the smaller dimensions, and we’re talking one of the friendlier stadiums in the league for offense.
Of course, the actual effect on scoring will be more nuanced and seasonal than my broad re-classification of batted balls. Dr. Daniel Mack, the team’s vice president of research, explained some of the additional factors the team considered when making the change: “(Senior analyst) Alan (Kohler) and I started breaking it down. What’s the effect of the walls? What’s the effect of the altitude? What’s the effect of the temperature and wind? Trying to figure out how to take all those effects into account and balance them.” Kauffman doesn’t play the same year round; Kansas City has huge variance in weather throughout the year, with meaningfully changing air resistance and wind patterns. The stadium plays differently in April than it does in July, something I didn’t even attempt to model in my quick take. But averaged across the year, I think the increase in scoring is at least in the realm of what’ll happen, adding enough home runs to more than take the sting out of the lost doubles.
I might not have the exact week-to-week fluctuations down, but the data is still good enough to make some predictions. I first noted which players would have seen the largest increases in Kauffman home runs with the new dimensions. Maikel Garcia’s 2025 batted balls would have produced five more homers with the new walls, per this estimation, while Jonathan India would also see his homer total increase by five. Salvador Perez’s would increase by four, with Vinnie Pasquantino’s and Bobby Witt Jr.’s going up by three apiece.
We can go further back. Here’s a leaderboard of career homers “gained” in the alternate universe where Kauffman always had smaller dimensions:
Had Started in 2015
| Batter | “Gained” HRs |
|---|---|
| Salvador Perez | 25 |
| Bobby Witt Jr. | 15 |
| Whit Merrifield | 13 |
| Hunter Dozier | 11 |
| Alex Gordon | 11 |
| Carlos Santana | 10 |
| Eric Hosmer | 10 |
| Maikel Garcia | 9 |
| Jorge Soler | 8 |
| Vinnie Pasquantino | 7 |
And, naturally, a leaderboard of the pitchers who would have suffered the most. I’m shocked that Yordano Ventura is on there with only two seasons of data, but he happened to give up a ton of not-quite-homers in those two years:
Had Started in 2015
| Pitcher | “Extra” HRs |
|---|---|
| Danny Duffy | 17 |
| Yordano Ventura | 13 |
| Jakob Junis | 10 |
| Ian Kennedy | 10 |
| Daniel Lynch IV | 10 |
| Brady Singer | 9 |
| Kris Bubic | 9 |
| Edinson Volquez | 8 |
| Michael Wacha | 8 |
| Jeremy Guthrie | 8 |
While the magnitude might be uncertain, the direction of the change is clear. The new stadium dimensions are going to make for meaningfully more home runs. That’s very much on purpose. As Mack detailed to Jeff Passan, the goal of this change in dimensions was to produce a league average run value on fly balls in the park. While Kauffman plays like a roughly neutral park overall, it greatly suppresses home runs while juicing doubles and triples.
Fly ball run value has historically been low in Kaufmann because a disproportionate amount of that value comes from homers, while the extra doubles and triples have juiced the value of line drives. That doesn’t mirror the incentives in every other stadium in the majors, and this change addresses that directly.
Well, kind of directly. The new dimensions definitely help fly balls. By my estimation, 24 fly balls that didn’t leave Kauffman in 2025 would have been home runs with the new walls. But 19 line drives that didn’t leave the park in 2025 would have gone out as well. Now, to be sure, the line drives were far more productive than the fly balls with the old wall configuration, so the upgrade to fly ball value is real. But line drives are getting more valuable, too. And while the new dimensions will reduce the area outfielders need to defend, Kauffman will still boast meaningfully more outfield square footage than average, so the days of gappers and speed are hardly over.
Will Bobby Witt Jr. mash a trillion home runs in 2026? Will the Royals become the new hot offense in KC with Patrick Mahomes on the shelf and the Chiefs in a brief downturn? We won’t know until they play the games. But Kauffman has always been more offense-friendly than the spacious dimensions would suggest, a sort of mini-Coors. Pull the walls in, and we could be in for some fun slugfests. I hope the Pasquatch has been doing his cardio.
Ben is a writer at FanGraphs. He can be found on Bluesky @benclemens.
Good stuff! Thanks. Not a fan of the change, as I like that some ballparks are different.