Austin Riley Has Rekindled His Debut Magic
In our preseason positional power rankings of the league’s third basemen, the Braves came in at No. 25, projecting for just 1.4 WAR at the position, with Jason Martinez writing not only about Austin Riley’s potential contributions, but also possible production from Jake Lamb. Roughly two-and-a-half months later, the picture looks entirely different: Lamb never took an at-bat in Atlanta (though he’s playing well for the White Sox), while Riley has put together a very solid offensive season. In 59 games and 231 plate appearances through June 9, he’s slashing .300/.381/.515 with 11 home runs and a 142 wRC+ and has accumulated nearly as much WAR by himself (1.3) as the team’s total positional projection. As a result, the Braves have gotten some of the best value in the majors at third base relative to those projections. (The Rangers mess with the table a touch, since they were projected for and have achieved negative value so far, but I digress.)
| Team | Projected WAR | Current WAR | Difference |
|---|---|---|---|
| Rockies | 0.4 | 2.0 | 1.6 |
| Diamondbacks | 1.4 | 1.9 | 0.5 |
| Giants | 1.4 | 1.6 | 0.2 |
| Rangers | -0.1 | -0.1 | 0.0 |
| Braves | 1.4 | 1.1 | -0.3 |
| Rays | 2.0 | 1.6 | -0.4 |
| White Sox | 3.2 | 2.7 | -0.5 |
| Mets | 2.2 | 1.4 | -0.8 |
| Cubs | 2.9 | 1.8 | -1.1 |
| Mariners | 2.6 | 1.4 | -1.2 |
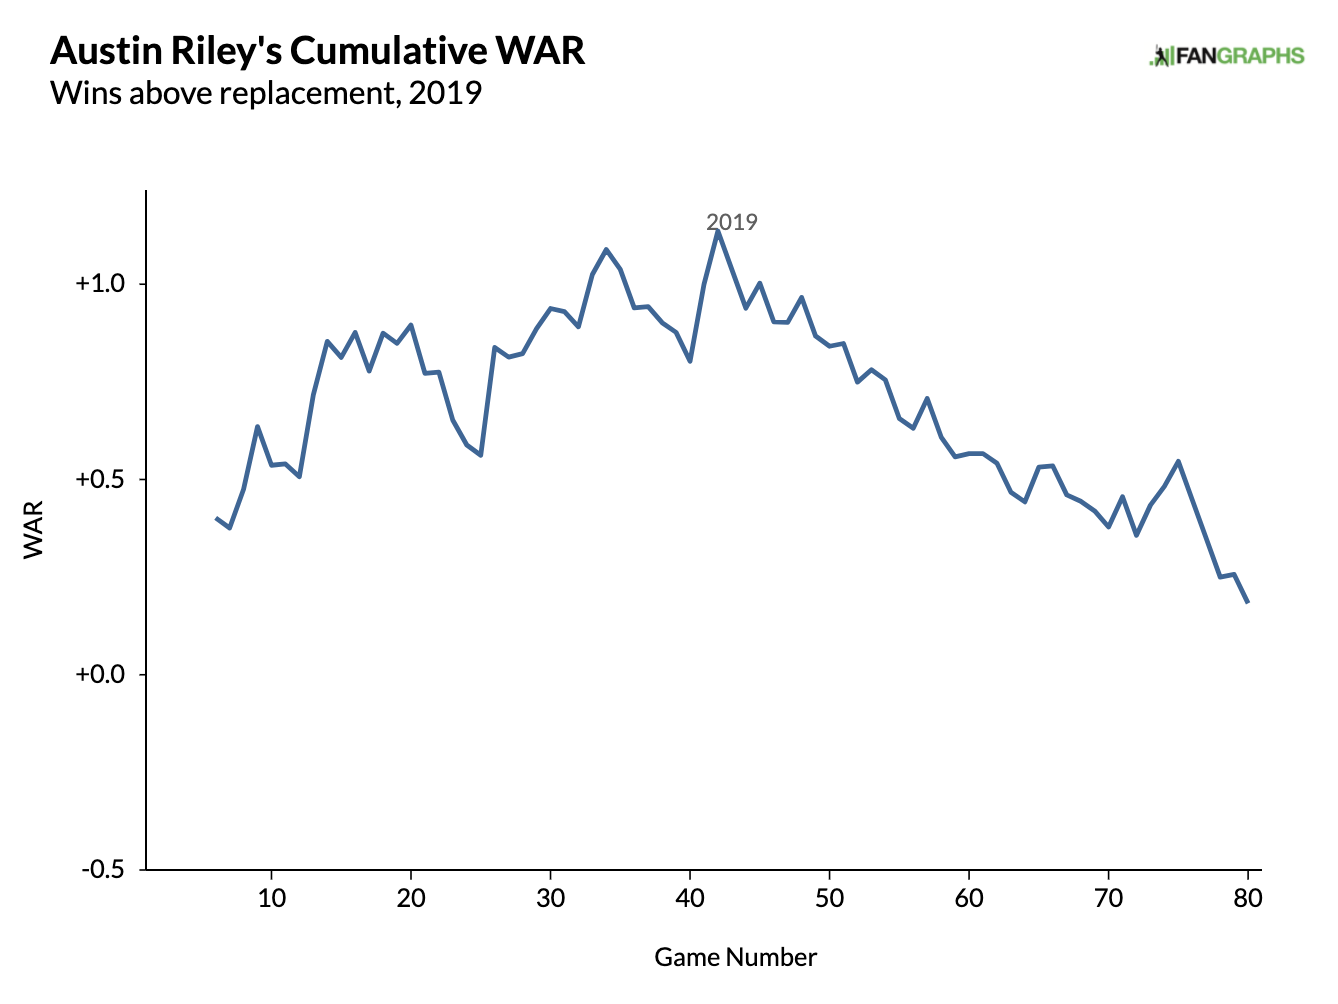
Riley hasn’t hit this well since he broke into the majors two years ago. From his debut on May 15, 2019, through the end of that June — a stretch spanning 43 games and 178 plate appearances — he slashed .273/.326/.582 with 14 home runs and a 127 wRC+. Immediately, he lived up to the hype of a top prospect. In our last report with Riley on it, from 2019, he was ranked as baseball’s 33rd-best prospect and No. 2 in the Braves organization, lauded especially for his plus raw power, and he demonstrated that from the get-go:
| Name | Span Start | Span End | PA | HR | OPS |
|---|---|---|---|---|---|
| Rhys Hoskins | 2017-08-10 | 2017-09-23 | 182 | 18 | 1.108 |
| Gary Sánchez | 2015-10-03 | 2016-09-18 | 180 | 16 | 1.078 |
| Aristides Aquino | 2018-08-19 | 2019-09-13 | 165 | 15 | .934 |
| José Abreu | 2014-03-31 | 2014-05-16 | 186 | 15 | .923 |
| Yordan Alvarez | 2019-06-09 | 2019-08-07 | 182 | 14 | 1.131 |
| Pete Alonso | 2019-03-28 | 2019-05-17 | 179 | 14 | .941 |
| Austin Riley | 2019-05-15 | 2019-06-30 | 178 | 14 | .908 |
| Will Smith | 2019-05-28 | 2019-09-10 | 151 | 13 | .968 |
| Christian Villanueva | 2017-09-18 | 2018-05-09 | 152 | 13 | .919 |
| Ryan O’Hearn | 2018-07-31 | 2018-09-29 | 166 | 12 | .975 |
| Kyle Schwarber | 2015-06-16 | 2015-08-26 | 170 | 12 | .952 |
| Evan Gattis | 2013-04-03 | 2013-05-31 | 153 | 12 | .952 |
| Trevor Story | 2016-04-04 | 2016-05-24 | 196 | 12 | .904 |
| Keston Hiura | 2019-05-14 | 2019-07-28 | 177 | 11 | 1.009 |
| Bo Bichette | 2019-07-29 | 2019-09-15 | 197 | 11 | .948 |
| Kyle Lewis | 2019-09-10 | 2020-08-19 | 183 | 11 | .923 |
| Gleyber Torres | 2018-04-22 | 2018-06-12 | 165 | 11 | .917 |
| Miguel Sanó | 2015-07-02 | 2015-08-22 | 179 | 10 | .957 |
| Trey Mancini | 2016-09-20 | 2017-05-31 | 151 | 10 | .910 |
| Dae-Ho Lee | 2016-04-04 | 2016-06-12 | 114 | 10 | .907 |
Riley’s hot start was always likely to subside. He just wasn’t going to be productive striking out nearly 33% of the time, and though it did work for the first month-plus, a .309 ISO kept him afloat. From July 1 on, his ISO dipped to .147, his strikeout rate jumped to 42% (!), and though he walked slightly more often, a rate still short of 7% wasn’t going to cut it. His .156/.210/.303 slash in 119 plate appearances shattered his season line, and he finished the year at .226/.279/.471 with just 0.2 WAR.
The wonky 2020 season brought more of the same for Riley, at least in terms of results. His wOBA was actually identical in both seasons, at .307; though his ISO dropped by 69 points year-over-year, his discipline improved, as he walked in just shy of 8% of plate appearances but struck out in less than 24%. That 12.6-point improvement in strikeout rate was the biggest year-over-year percentage point decrease in the sport. It was muted by significantly worse batted ball quality, but Riley was showing that he was potentially on the verge of a breakout.
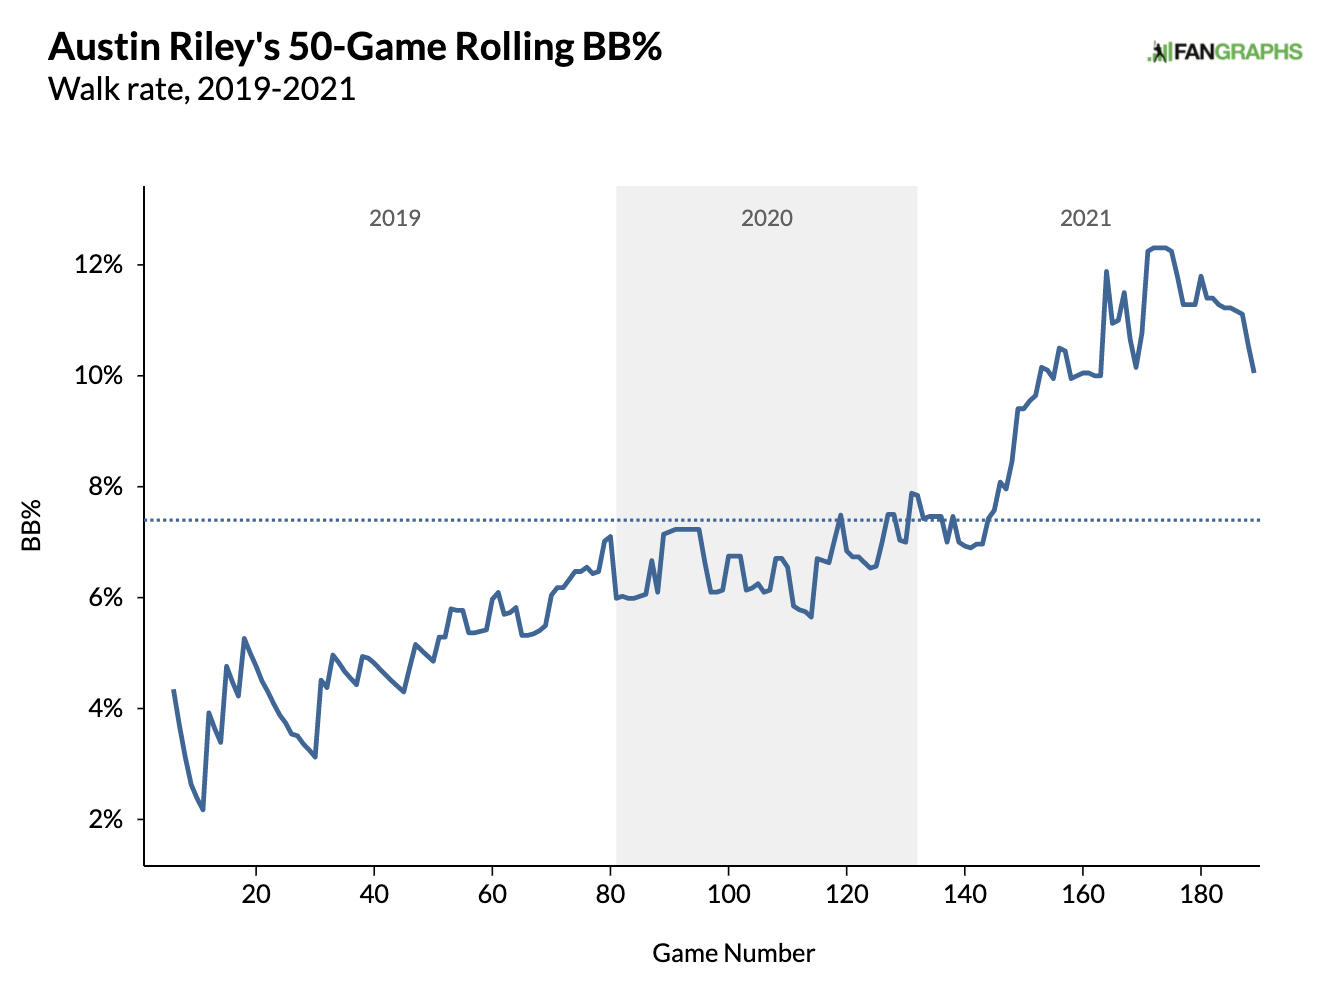
This season, it’s been pretty close to the best of both worlds. The discipline improvements made last year — including a better chase rate and a better contact rate — have stuck in 2021. Both Riley’s O-Swing% and his Contact% have increased compared to 2020, and though he is striking out a bit more, his walk rate is approaching double digits. This is exactly the trend that you want to see for a young player:
Riley’s quality of contact, too, is back to 2019 levels, which is driving the breakout year. His expected wOBA on contact was a cool .463 his rookie season, a figure that ranked in the 92nd percentile. It dipped all the way to .409 last year before roaring back to .465 in 2021, which is now in the 88th percentile. He’s done this not by adding more pop (his xISO is roughly equivalent from 2019 to ’21) but by adding more contact. That’s in spite of an average launch angle that has decreased by nearly 10 degrees over the two years and a Sweet Spot% that has fallen alongside of it. What gives?
At least part of the answer, if not the whole answer, is because Riley is almost impossible to shift against. Among players with at least 100 plate appearances this season and with at least 30% of those including an infield shift, he has the third-best wOBA in baseball when shifted, behind only Kris Bryant and Mike Trout:
| Player | Bat Side | Total PA | Shifted PA | % | wOBA |
|---|---|---|---|---|---|
| Kris Bryant | R | 239 | 110 | 46.0% | .461 |
| Mike Trout | R | 132 | 77 | 58.3% | .456 |
| Austin Riley | R | 219 | 72 | 32.9% | .450 |
| Jesse Winker | L | 227 | 152 | 67.0% | .443 |
| Alex Bregman | R | 233 | 78 | 33.5% | .431 |
| Tyler O’Neill | R | 160 | 62 | 38.8% | .418 |
| Kyle Garlick | R | 107 | 36 | 33.6% | .412 |
| Max Muncy | L | 234 | 213 | 91.0% | .406 |
| Yoán Moncada | L | 187 | 114 | 61.0% | .406 |
| Nate Lowe | L | 262 | 97 | 37.0% | .405 |
When shifted, Riley is slashing .339/.417/.678, all career bests. He has gone to the opposite field 40% of the time with the shift on, also a career best, where he has posted a .474 average and a 1.000 slugging percentage. He actually had better marks when going to the opposite field against the shift in 2019, but he didn’t do it nearly as often. This season, among players with at least 50 batted balls against an infield shift, no player has gone to the opposite field more than Riley, though all have seen excellent results. On the whole, the league-average player has posted a .324 average, .508 SLG and .353 wOBA when going the other way versus a shift, a 60-point outperformance versus their collective xwOBA of .293. Here are the leaders in OppoShift%:
| Name | OppoShift% | Shift wOBA |
|---|---|---|
| Austin Riley | 40.0% | .591 |
| Ryan McMahon | 37.8% | .402 |
| J.P. Crawford | 33.9% | .346 |
| Ian Happ | 32.7% | .350 |
| Josh Bell | 32.4% | .510 |
| Omar Narváez | 32.1% | .512 |
| Pavin Smith | 32.0% | .378 |
| Bobby Dalbec | 32.0% | .157 |
| Nate Lowe | 31.5% | .637 |
| Jurickson Profar | 31.4% | .301 |
From the looks of this leaderboard, it seems as if Dalbec might have to be the focus of a future article. Either way, Riley is doing what old-school baseball fans want every hitter to do: hit it where they ain’t when shifted. It might be easier for a guy like him, who, since his debut, has gone to the opposite field more than most; perhaps he’s being shifted just a touch too often. He also bats right-handed, and there has been quite a bit of research that suggests that right-handed hitters might be better against the shift than versus a traditional infield alignment. That all comes into play here.
That also might explain why Riley is running a .392 BABIP so far this season. Perhaps some of that is due to his performance against the shift; he has 14 non-homer hits against it this season, but his expected batting average suggests he should only have around seven. That difference right there would shave 56 points off of his BABIP. Is it possible that his approach to the shift is going to allow him to sustain a higher BABIP than otherwise expected? Maybe.
So while Riley has rekindled his debut magic, I’m confident in saying that he’s done so in a much more sustainable way. His strikeout and walk numbers don’t raise red flags anymore, and the contact quality is back to where it was during the blazing start to his career. He’s a different baseball player than he was during his rookie year, and though the Braves have struggled coming off of a season where they were just one win shy of winning the pennant, at least their production from the hot corner has been a pleasant surprise thus far.
Devan Fink is a Contributor at FanGraphs. You can follow him on Twitter @DevanFink.
I think you’re a bit too high on him. He’s got a 900 OPS with a 381 Babip, and has given back some of the strikeout gains he made last year (28% this year; 24% in 2020; 36% in 2019). Regress his babip to something sustainable and you’re looking at an 800-850 OPS, which is good but not great with his mediocre to poor defense.
If you’re selling him as a 2-3 WAR player for the next few years, I’d buy that. 800-850 OPS, maybe a peak year when he runs into a few extra HR and has a high babip. But if this is what’s being sold – 4+ WAR pace – I will take the under.
To me, it looks like he struggles hitting for power while keeping his strikeouts reasonable. Early in the year, his K rate was down, but he had little pop. Now he’s hitting XBH, and his K rate is climbing.
He’s in his age 24 season. Any chance his plate discipline improves and he has a sustainable power/K rate?