Author Archive

Adventures in Extreme Plate Discipline

How do you have non-existent power (second worst in baseball), an average BABIP and still provide above average offensive value? One way is to walk 2.39 times for everytime you strikeout like Luis Castillo has done so far this year. Luis Castillo is leading the league in BB/K, a little bit higher than Albert Pujols.

Castillo does it by swinging at nothing. He has the second lowest O-swing rate to Marco Scutaro and by far the lowest Z-swing rate, the only player under 50%. Throw Luis Castillo a pitch in the zone and he is more likely to take it than swing at it. When he does swing he makes contact over 94% of the time, tops in the league.

Effectively Castillo is just waiting for the pitcher to walk him. Taking almost all pitches out of the zone, over half of them in the zone and hoping to accumulate enough balls for a free pass. When he does swing he almost always makes contact, so he rarely strikes out. I wanted to see how it does it. First I looked at how often his swings by the number of strikes.

 Swing Rate
+----------+-----------+-----------+
| Strikes  |  Castillo |   Average |
+----------+-----------+-----------+
| 0        |     0.129 |     0.291 |  
| 1        |     0.322 |     0.489 |
| 2        |     0.536 |     0.600 |
+----------+-----------+-----------+

So his difference from average is the largest early in the count. By the time he has two strikes he swings at about league average rate, which is how he keeps his strikeouts down. Let’s see what that looks like in terms of his swing contours. Castillo is a switch hitter but I plotted just his at-bats as a lefty and compared him to other lefties. Recall that I am plotting his 50% swing contour, that is inside the contour his swing rate is greater than 50% and outside less. Additionally for zero strikes I also plotted the 25% contour. Right along that contour he swings 25% of the time, inside of it greater than 25% of the time and outside less.

castillo_swing3

With no strikes Castillo doesn’t have a 50% contour. There is no location where he is more likely to swing at a pitch than not when he has no strikes. In fact his 25% swing contour is about the same as the average lefty’s 50% swing contour. So he is about half as likely as the average lefty to swing at a pitch down the middle of the plate. As he gets more strikes his contour looks more and more like the average lefty. With more strikes he starts to swing more, since he doesn’t want to strike out looking.

Since he has no power and very rarely swings at pitches out of the zone opposing pitchers have no reason to throw him anything but strikes. His in zone percentage is high, 51.6%, but there are lots of batters higher. J.J. Hardy, Colby Rasmus, Mike Cameron, B.J. Upton and Yunel Escobar, among others, all see a higher percentage of strikes. So pitchers should have the ability to throw him a higher percentage of strikes than they are. I think this is probably because Castillo usually bats in front of the pitcher, while those guys in front of power hitters. Even so you have to think pitchers are making a mistake. The currency of the game is outs, and at-bats to Castillo could be ending in outs more often than they do.

EDIT: I stand corrected, Castillo has led off 14 times, batted 2nd 26 times and 8th 23 times. Based on this there is no one excuse for pitchers not pounding it in the zone 55% of the time like they do against David Eckstein, Willy Taveras and Jason Kendall.

I think most people view Castillo as a pretty boring player, but he is able to provide above average offensive value with no power and a diminishing ability to beat out grounders (his value used to come from an above average BABIP). I think that is cool, he can take extreme plate discipline, and little else, and make it work.


Lincecum’s Great Changeup

Last night Tim Lincecum was the youngest pitcher to start an all-star game since Dwight Gooden. Lincecum is having a great year, striking out over 10.5 batter per nine, with, having cut his walk rate for the third year in a row, a K/BB over four. He is best known for his electric fastball, but interestingly this year he is throwing it a bit less (59% of the time versus 66% of the time in 2008 and 2007) and the average speed has dropped from 94 mph to 92.5 mph. It looks like Lincecum is learning to take a little off the fastball and mix in his curve and changeup more often.

His curveball is quite good, worth about one run per 100 pitches over the past three years. It is has lots vertical movement-12 to 6 break-and induces nearly a 30% whiff rate. He throws it about equally to lefties and righties, about 16% of the time.

His changeup is a great pitch. He throws it more to lefties (24% of the time), but still throws it to righties fairly often (16%) a testament to how good it is. The pitch has been worth 5.28 runs per 100 pitches this year, which is just incredible. Of pitchers who have thrown more than a handful of changes the next closest is Josh Johnson‘s worth 3.8 runs per 100. Among starting pitcher’s changeups it is second to only Rich Harden’s in whiff rate. It is a huge reason for his success.

Of course you cannot evaluate his changeup in a vacuum, since its success is predicated on his fastball. Here is the average run value, change in run expectancy, of changeup based on the number of fastballs that preceded it in an at-bat. The numbers are averaged over his career not just 2009.

+-------------------+----------------+
| Num. Preceding FB |  Run Val of CH |
+-------------------+----------------+
| 0                 |         -0.014 |  
| 1                 |         -0.026 |
| 2                 |         -0.028 |
| 3                 |         -0.023 |
| 4+                |         -0.010 |
+-------------------+----------------+

After the first fastball the success almost doubles, where it stays until, as the at-bat lengthens, it falls back off. The two pitches average about 9 mph difference in speed. Here is the change in run value for his changeup based on its difference in speed from the previous fastball. The gray lines are error bars.

lince_dif

As you can see the success of Lincecum’s changeup is very much influenced by his fastball. When he is throwing it 8 to 10 mph slower than his fastball (as he does on average) he is successful. When it gets too slow or too fast, he is not as successful.

Changeups have no platoon split and as with other pitchers who succeed on the strength of a great changeup Lincecum shows almost no platoon split. It will be fun to continue to watch the career of this great young pitcher getting it done with a superlative changeup-fastball combo.


PITCHf/x Summit Recap

This past Saturday was the second annual PITCHf/x summit. The summit, put on by Sportvision the creators of the PITCHf/x system, was a chance for interested parties to get together and discuss all things PITCHf/x and HITf/x. I had the pleasure of attending and I wanted to share my highlights. You can go over to Sportvision’s website and download the power points of any of the presentations.

PITCHf/x

Matt Lentzner gave a great talk on arm slots and the movement of fastballs. He showed that the angle of a pitcher’s arm slot is very close to the angle of the vector connecting the (0,0) and (h_mov,v_mov) of a pitcher’s fastball. He showed images of Brad Ziegler‘s and Hideki Okajima’s arm slots and the movement of their fastballs, which was very compelling. Lentzner continued on how this could be used to make pitch classiciation algorithms better.

Harry Pavlidis talked about the next step in pitch valuation. He, briefly, discussed the current method which he and I currently use, and is used in the pitch valuations here at FanGraphs. It is explained here. The method was introduced by Joe Sheehan at Baseball Analysts. Harry went on to propose two new pitch valuations methods, both defense independent based, one based on batted ball type identification (be they BIS or GameDay or STAT) and the other based on HITf/x data.

Finally we discussed the problem of park to park PITCHf/x differences. The differences are much corrected from last year, but still evident. In addition, we discussed that at even within a season in one park PITCHf/x values can shift. Marv White of Sportvision told us that before every game the system is re-registered to make sure that it is in proper registration. The registration is super sensitive, in PETCO, for example, the weight of additional fans sinks the entire stadium enough to draw the cameras out of registration. Some suggested that Sportvision release the information whenever a system in re-registered so that analysts knew of these events.

HITf/x

Greg Moore and Marv White of Sportvision introduced us to HITf/x. The cameras that capture the pitches for PITCHf/x are on continuously, so they capture images of the ball coming off the bat on balls in play. Thus collecting the HITf/x data was a natural extension for Sportvision. Since the cameras are trained on the space area between the pitcher and catcher they only catch the beginning of a ball in play’s trajectory. Depending on that trajectory they capture between two and fourteen images of the hit ball. From those images Sportvision fits the equations of motion just like they do for a pitch. Since the cameras were set up for the pitch they capture enough images to fit all nine variables in the equations of motion for a pitch (horizontal, vertical and depth position, velocity and acceleration), but they can only fit six for hit balls (horizontal, vertical and depth position and velocity). From this the initial speed of the ball off the bat, vertical and horizontal angle of ball are calculated.

Without acceleration the spin on the ball in play is not known, so the backspin which gives, particularly fly balls, loft, and the side spin which causes hits to slice or curve are not available with the current HITf/x system. Thus the final position and hang time of the hit cannot be accurately calculated. In Alan Nathan’s presentation he combined the HITf/x data for HRs with Greg Rybarczyk’s final landing distances. With that he could estimate the spin on each HR. He showed that each additional mph in the speed of the ball off the bat added about four feet to the distance of a HR, and showed how the slice of the ball differed coming off the bat of LHBs versus RHBs.

Peter Jensen combined the HITf/x data with the Gameday fielded locations. He looked at plays where the two disagreed on the horizontal angle of ball in play, restricting his attention to balls to the shortstop. Obviously they disagreed on deflected balls, since HITf/x gives the angle of the hit while Gameday where it is eventually fielded. In addition to these deflected balls he found 60 more balls in play to the shortstop where the angle was off by more than 10 degrees. For these the HITf/x angle was more accurate in all but two cases.

BASEBALLf/x

The section on the future was the most exciting. Matt Thomas, Greg Rybarczy and Marv White discussed the future of ball and player tracking. Matt Thomas has tracked fielders at Busch Stadium for a number of games. From the press box using a tripod-mounted consumer level DSLR, laptop and the discipline of photogrammetry he tracked where players started in the field and where they went to field the ball. The furthest a player went to field a ball was around 120 feet by Adam Kennedy running to catch a pop up in foul territory. He also had great information about the probability of a fielder getting to a fly ball based on the distance between where he started and the ball landed.

Rybareck and Marv White both talked about the future of tracking the ball from the pitcher’s hand to the end of the play and all players on the field: runners and fielders. Sportvision is in the research stages of that project and it was recently described in the New York Times. Once this information is available it has the potential revolutionize baseball analysis.

The conference was great. I want to thank the presenters, Alan Nathan who organized the talks and Sportvision for hosting the summit and taking us to a Giants’ game afterwards.


A Two-Win, a One-Win and a Half-Win Fastball

At the all star break the only two win-20 runs saved-pitch is Dan Haren‘s four-seam fastball (Tim Lincecum’s change is knocking on the door). All-star Dan Haren not only has the game’s best four-seam fastball, but he also has one of the game’s best cut fastballs (worth one win) and one of the game’s best split finger fastballs (worth half a win). Haren throws a good curveball, too, but for the most he succeeds throwing a variety of different, all great, fastballs. As we saw earlier Jamie Moyer throws a couple different fastballs, but none is as good as any of Haren’s. Jon Lester (four-seam, two-seam and cut) and Carlos Zambrano also succeed throwing a range of different fastballs. Here is the movement on Haren’s pitches.

haren_pitches

Haren’s four-seam fastball averages just over 90 mph and has big ‘rise’ and tails in to RHBs. His splitter ‘drops’ in comparison to his four-seam fastball with the same vertical movement as a sinking two-seam fastball. The difference is that a two-seam fastball tails even farther in to RHBs (larger horizontal movement) than a four-seam fastball, while a splitter has less horizontal movement. Haren’s splitter averages about 85 mph. His cutter has slider-like movement and averages 86 mph. He added the cutter this year, replacing a slider he felt was not as effective in Arizona’s low humidity.

Here is his usage pattern and a summary of some stats for each pitch. Zone is the percentage of time he throws the pitch in the rule book zone (using pitchf/x data) and whiff is the number of swings and misses per swings.

+-----------+-------+-------+-------+-------+-------+
|           | v RHB | v LHB |  Zone | Whiff | GB/BIP|
+-----------+-------+-------+-------+-------+-------+
| Four-Seam |  0.40 |  0.55 |  0.53 |  0.14 |  0.35 |
| Cutter    |  0.36 |  0.09 |  0.44 |  0.36 |  0.50 |
| Splitter  |  0.11 |  0.08 |  0.35 |  0.39 |  0.62 |
| Curveball |  0.13 |  0.28 |  0.52 |  0.26 |  0.47 |
+-----------+-------+-------+-------+-------+-------+

The four-seam fastball is his bread and butter, he can get it in the zone with regularity. Against righties his main secondary pitch is the cutter and against lefties the curve. Against both it looks like his splitter is his out pitch. It is rarely in the zone, but gets huge whiff and GB rates-a nasty pitch to throw when ahead in the count. Haren continues to be one of the game’s best pitchers and this year he gets it down throwing an array of hard offerings.


Lots of Groundballs from Affeldt

Over this past off-season Brain Saeben surprisingly made a number of free agent acquisitions that were well received in the sabermetric community, including signing Jeremy Affeldt to two year eight million dollar contract. Affeldt has already provided 3.2 million dollars of value, so is well on his way to earning his contract. A big part of his value comes from the fact that he has allowed only one home run so far this year on the strength of his amazing 66% GB/BIP, as of last night good for third below only side-armers Brad Ziegler and Peter Moylan. That is way above his career average of 48%, although his GB rate has been increasing each year since 2006.

Usually such a high GB rate is achieved by throwing a ‘sinking’ fastball. Most fastballs ‘rise’ about 8 inches, that is they drop 8 inches less than you would expect due to gravity. A sinking fastball ‘rises’ a lot less than a normal fastball, so appears to sink to hitters. A sinker will generally have a vertical movement between 4 and -4 inches, so drops between 4 inches less to 4 inches more than you expect due to gravity. Here is the average vertical movement of the fastballs of the eight relievers with a GB rate above 60%. They are ordered along the right.

v_mov_hist

Affeldt’s fastball rises the most of the group, almost as much as an average fastball. Most of the group has heavy sinking action to their fastballs, as expected. In addition most of the group throws two-seam fastballs that tend to sink more, while Affeldt throws mostly a four-seamer that tends to rise. Affeldt’s high GB rate is very strange given this graph.

The next thing I thought was that even though Affeldt’s fastball rises he can locate it down in the zone. So I looked at the location of his pitches in 2008 and 2009.

loc_aff

The 2009 pitches are very slightly lower, but almost no different. Based on the type of pitches he throws, and where he throws them I do not think that Affeldt is a 60+% GB pitcher. I think that rate is very fluky and will settle back to his career average around 50%, but he is still a very good relief pitcher at that GB rate.


Jack Cust’s New Approach at the Plate

Jack Cust came into the season looking to cut down on his strikeout numbers, and he has done just that from 2008’s 41% K/AB to 30% K/AB this year. Unfortunately his BB/PA and HR/FB rates have also dropped (19% to 11% and 30% to 15% respectively). Put that all together, and add in a meager .273 BABIP, and you have a 0.324 wOBA. Down considerably from 2007 and 2008.

A week and a half ago Eric warned us about trying to create reasons for small sample shifts in performance. Over even half a season’s worth of time a good player can put up poor numbers, not because of any shift in true talent or changing approach but just because the coin lands tails a few too many times.

In this case, though, I think we can attribute some of the shift in Cust’s numbers to a change in approach. To begin with we were warned of the change in approach BEFORE we saw the shift in numbers. Also the shift is reflected in the more granular pitch-by-pitch data, although these are not immune from small sample size variation either. Last year Cust swung at 38% of the pitches he saw, in the bottom five, this year it is 45%, just a shade under league average. That is a huge shift, and he is seeing fewer pitches inside the zone this year than last.

I wanted to see where these additional pitches he is swinging at were. So I plotted all of the pitches that he took and swung at and then drew contour lines at the 50% break. Effectively inside the contour line he is more likely than not to swing at a pitch and outside less likely. Here are his contours in 2008, 2009 and for all lefties.

cust_swing1

Cust’s additional swings are coming everywhere, inside, outside, low and high. He has added area inside the strike zone (which is good), but also area outside the strike zone (bad). In addition, it looks like Cust is now a freer-swinger than the average lefty. His swing rate is lower than average, but once you correct for the location of pitches seen he swings more often than the average lefty.

Additionally his contact rate is up, but power down. So it looks like Cust is swinging less hard (more contact less HRs) at more pitches. Athletics Nation noted the shift in numbers and suggested that Cust should go back to taking the 07-08 Cust approach at the plate, I would have to agree.


A Little Help From His Friends

Jarrod Washburn pitched a one-hitter on Monday, striking out three and walking none. Whenever a pitcher throws a no-hitter or one-hitter his defense has, by definition, played a great game, but by only striking out three Washburn relied especially heavily on his defense Monday. The defense converted 25 balls in play into 24 outs.

It is widely believed in sabermetric circles that pitchers have a lot of control over if a ball in play is a groundball or not, but beyond that exert a marginal amount of control on how field-able a ball in play is. If you agree with that assessment then a large share of the accolades that have been given to Washburn for his performance should go to his defense. Although Washburn deserves a lot of credit for facing 28 batters and walking none, and he doesn’t have to share that with anyone.

The 25 balls in play were 11 ground balls, eight fly balls, five line drives and one pop up (based on the GameDay classifications). I plotted the location of these balls in play over a crude map of Safeco field that I made also made from the GameDay data. I found the average out percentage for a ball in play in each location from 2005 to 2008 at Safeco Field to roughly indicate how hard each defensive play was to make. This method only takes into account the location of the ball in play, not how hard it was hit, or even what if it was a ground ball, fly ball or line drive. Obviously this is in no way a substitute for the sophisticated fielding metrics, like UZR, but, rather, a quick and dirty way to give some credit to Seattle’s fielders. The GameDay locations are determined by a person estimating the location where a ball was fielded, so there is most likely some error.

bip_def

Again the location recorded is where the ball was fielded. The one hit actually landed farther in front of left fielder Ryan Langerhans where he had no chance of fielding it.

Also keep in mind the estimated out percentage is only based on the location, not type of ball in play. The pop out in shallow-right field was relatively easy out for Jose Lopez to field even though it was to a location of generally low out percentage.

The blob that looks like a hit at third base is just a lot of ground outs to Chris Woodward. These include barehanding a Adam Jones slow roller in the seventh and a nifty play on the last out of the game, a Brian Roberts ground ball down the third baseline. The line drive to the center-right gap was fielded by Ichiro Suzuki in the 2nd inning. Washburn got into the action, fielding a Melvin Mora bunt in the third. You can also see the luck involved in the one-hitter, line drives were hit right at Russell Branyan and Ronny Cedeno that could very easily have been hits if they had gone to slightly different angles.

So props to Washburn for his excellent control over nine innings, but don’t forget to give a big dose of credit to the Seattle defense as well.


Chris Davis Had a Hard Time Making Contact

On Sunday the Rangers sent Chris Davis down to AAA. After a good rookie season last year Davis’ performance took a step back this year. His power is still there (23% HR/FB), but his already poor strikeout rate has ballooned up to an unacceptable 44.2% K/AB. At the same time his walk rate is still below average. It is very hard any player to succeed with that many strikeouts, and impossible if he doesn’t walk a ton. His wOBA is a paltry 0.288, not acceptable for a 1st baseman (although he was probably due for a bump with his BABIP of .287).

The main cause of the all those strikeouts was his historically bad contact rate. Here is a histogram of the contact rates of all major league regulars from 2008 to 2003, with Davis’ 2009 58% contact rate indicated.
contact_hist
The average contact rate is just under 82%, out of over 900 regulars over six years only 17 finished with a contact rate below 70% and none under 60%. Davis’ rate over a full year would have been a major outlier. Major League players just don’t keep full time jobs missing the ball that much, no matter how much power they have.

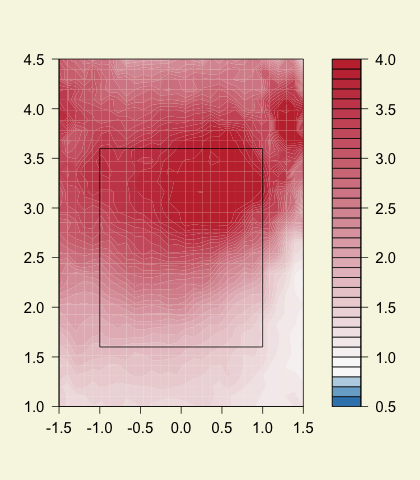
I was additionally interested in where in the strike zone and which pitches Davis was missing. Here I plot how many times higher Davis’ whiff rate (missed pitches divided by swings) is than the average lefty by pitch location.

davis_whiff

Davis has the biggest problem up and in, whiffing four times the lefty average. Additionally, through most of the zone he whiffs at least twice as much as the average lefty. Here is the whiff rate by pitch type for Davis in 2009 and for all lefties averaged.

+------------+-------+-------+
| Whiff Rate | Davis |   LHB |
+------------+-------+-------+
| Fastball   |  0.44 |  0.13 |
| Cutter     |  0.40 |  0.15 |
| Changeup   |  0.44 |  0.26 |
| Curveball  |  0.50 |  0.28 |
| Slider     |  0.37 |  0.27 |
+------------+-------+-------+

Davis is getting eaten alive by fastballs (against changeups, curveballs and sliders he is worse than average but probably in line with other power hitters). Hopefully he can work things out in the minors and get his contact rate, and as a result strike out rate, back to his 2008 level.


Jamie Moyer is Throwing a Ton of Fastballs

Although Jamie Moyer’s ERA and FIP are both well above his career average he is pitching just as well as he has over the past five years. His FIP is artificially inflated by an unsustainable high 15.3% HR/FB, while his ERA is up because of that HR/FB and a .312 BABIP, his highest since 1991. His K/BB and GB% are right in line with his recent performance, but he is doing it in a completely different way. Check how Baseball Info Solution has classified his pitches:

+-----------+-------+-------+-------+-------+
|           |  2006 |  2007 |  2008 |  2009 |
+-----------+-------+-------+-------+-------+
| Fastball  |  0.41 |  0.38 |  0.41 |  0.65 |
| Cutter    |  0.13 |  0.24 |  0.30 |  0.10 |
| Changeup  |  0.28 |  0.28 |  0.24 |  0.18 |
| Curveball |  0.10 |  0.08 |  0.06 |  0.07 |
| Slider    |  0.08 |  0.01 |  0.00 |  0.00 |
+-----------+-------+-------+-------+-------+

What? Why is this ‘crafty lefty’ with a very good changeup and serviceable cutter sudenly throwing almost 65% fastballs? He of the 81 mph fastball. Maybe BIS is just reclassifying some of his other pitches, calling some of his cutters and changes fastballs?

I went back and used the pitchf/x data and classified his pitches using my own k-means clustering algorithm (the pitchf/x classification system itself is not always entirely reliable, at times confusing cutters and sliders and before 2009 it did not differentiate between two- and four- seam fastballs

+--------------------+-------+-------+-------+
|  v RHB             |  2007 |  2008 |  2009 |
+--------------------+-------+-------+-------+
| Two-Seam Fastball  |  0.19 |  0.28 |  0.40 |
| Four-Seam Fastball |  0.21 |  0.17 |  0.24 |
| Cutter             |  0.24 |  0.21 |  0.07 |
| Changeup           |  0.28 |  0.28 |  0.21 |
| Curveball          |  0.08 |  0.06 |  0.08 |
+--------------------+-------+-------+-------+
|  v LHB             |  2007 |  2008 |  2009 |
+--------------------+-------+-------+-------+
| Two-Seam Fastball  |  0.33 |  0.26 |  0.42 |
| Four-Seam Fastball |  0.17 |  0.16 |  0.21 |
| Cutter             |  0.26 |  0.35 |  0.17 |
| Changeup           |  0.17 |  0.16 |  0.11 |
| Curveball          |  0.07 |  0.07 |  0.05 |
+--------------------+-------+-------+-------+

My numbers are reasonably in line with BIS’s so I am pretty comfortable with the differences not being a classification artifact. It looks to me like Moyer is throwing a ton more two-seam fastballs this year, coming at the expense of his cutter and changeup.

Ump Bump noted the trend back in May and suggested that maybe he lost the zone with his cutter, curve and changeup, and needed to go heavy with the fastball to keep his walks down. His in zone rate is way down and early in the season his walk numbers were up before they settled back to near his career average recently, so this might be the case. I am not entirely sure. Phillies’ fans what do you think? Do you notice the difference while watching the games?

Interestingly even with the change in pitch usage his K, BB and GB numbers are not far off his career numbers. One thing that has changed is his platoon split. Over his career he had a slight reverse platoon split (OPS: vRHB .741/vLHB .766), this year he has an extreme one (OPS: vRHB .920/vLHB .760). This is expected when you trade changeups (no platoon split) for two-seam fastballs (huge platoon split).


Where are Ryan Howard’s HRs going?

Ryan Howard’s HR/FB rate, at 23.5%, is lower than his HR/FB rate in any of his full years of play, in which it was always above 30%. He has replaced some of those HRs with doubles and 23.5% is still a very good rate, but the drop in HRs is interesting and even more interesting is where those HRs have gone.

how_hrs

Ryan Howard has been the epitome of power to all fields. Jeremy Greenhouse previously noted he hits historically high numbers of HRs to the opposite field, and, it seems, prior to this year he hits HRs almost uniformly to all parts of the field (most power hitters hit the majority of their HRs to the pull field). This year, though, almost all of his HRs have been to dead center with very few in the pull field and only one opposite shot. Dead center is not the best place to try to hit HRs as it is the largest part of a ball park.

Next I wanted to see if Howard has seen a drop in his fly ball distances. Again these distances are using the GameDay data which records were the ball was fielded or landed for a HR. Consider two hits, one to center and one pulled, both travel the same distance in the air but then roll to the wall where they are fielded. Since the wall is farther away in center it will be recorded as a longer hit. Thus this method will overestimate the distance of fly balls to center field.

how_pow

Here you can see Howard’s power to all fields. The average lefty has power to the pull field and drops off to opposite field. Howard’s power peaks at dead center, but is present to all fields. This year he has even more power to center and less power to the pull and opposite fields. This is why his HRs have mostly been to center, he is missing them to the pull and opposite fields and his overall HR numbers are down.

Finally let’s look at the location of the pitches he hits for HRs.

hr_pitches_loc

Before this year he hit pitches all over the plate for HRs. This year he has hit fewer inside and outside pitches for HRs, which is probalby why he is missing all those opposite and pull field HRs.

So we know why Howard is hitting fewer HRs, a drop in power to the pull and opposite fields, but it is too early to tell if these differences are small sample size realated or a real shift in true talent.