Author Archive

Mauer’s Performance by Pitch Location

Playing around with the new splits yesterday Dave C. noted Joe Mauer’s bizarre spray chart numbers. To right field Mauer hits ten grounders for every fly ball and Mauer’s ISO and wOBA by direction in play resemble a RHB more than a LHB peaking in left (opposite field for Mauer) and smallest in right (pull field for Mauer).

Some commenters to Dave’s article questioned how Mauer handled pitches to different parts of the plate, and whether that was responsible for this pattern. I thought these were very interesting questions. I plotted the average angle of his grounders and balls in the air based on the horizontal location of the pitch. I show the average lefty for comparison. Here -45 corresponds to the left-field line, 0 to second base and dead center, and 45 to the right-field line.

Not surprisingly all of the lines are increasing, the farther inside a pitch is the more it is pulled (greater angle meaning farther to right field). For LHBs grounders are, on average, pulled while balls in the air depend on the pitch location: inside pitches hit in the air go, on average, to right while outside pitches go to left. I have previously shown this with the HITf/x data and Matt Lentzner has a simple, but very cool, bat-ball collision model that shows why this is the case. Anyway Mauer’s ground balls are not all that different than the average lefty’s, but his balls in the air are. No matter where the pitch is Mauer, on average, hits balls in the air to left field. Even on far-inside pitches the average fly ball Mauer hits will be to center-left. This is how he ends up with all his pulled hits as grounders.

This backs up Dave’s suggested defensive alignment, “teams should consider employing two different shifts against Mauer; an outfield shift playing him as if he was a pull-heavy right-handed batter, and an infield shift treating him as a pull-heavy left-handed hitter.”

How does this affect how well he does on those pitches? Here is Mauer’s and the average LHB’s ISO by horizontal pitch location.
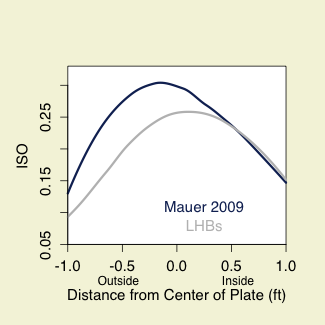
The average lefty has the most power on pitches middle-in and on such pitches Mauer has about average power. But Mauer’s power keeps increasing as pitches get father away from him and peaks middle-away. On pitches on the outer half of the plate Mauer has substantially more power than the average lefty. Since Mauer is going the other way with his fly balls anyway it makes sense that he would do best on pitches slightly away.

Taro, a commenter to Dave’s post, noted maybe it would be best to pitch Mauer inside, where he has just average power. Have pitchers adapted against Mauer and thrown more inside pitches to him?

Doesn’t seem so; in fact if anything pitchers pitch even farther away to Mauer than they do to the average lefty. It looks like faced with the already Herculean task of trying to get Mauer out pitchers are not doing themselves any favors with their approach. It will be interesting to see if that changes this coming season.


The Fans’ Playing Time Projections

Tango has already covered the optimism in the FAN projections a couple of times — and why being so optimistic might not be that bad — but I wanted to look at it from another angle. I noticed that the fans project much more playing time than other projection systems. This is particularly evident at the top. CHONE projects Jimmy Rollins to have the most PAs at 682, the fans have 12 players with more PAs than that (including three with over 700), and, while CHONE has only three players with over 650 PAs, the fans have 53. Note: I understand that fans project number of games played and batting order and the system extrapolates number of PAs. I am using PAs because that is what is displayed on the projection page and makes for the easiest comparison.

How reasonable is it to project any given player will get 700 PAs? Obviously, every year some players get 700 PAs, but can we identify them beforehand? There will be more than three players who get over 650 PAs in 2010, but before the season starts can we really pick 50 players more likely than not to get 650 PAs?

I am going to assume that most people use past performance (number of games or PAs) to project how many a player will get in 2010. To see how well this works I got three groups of players. For group one I found players who had three consecutive years averaging between 725 and 675 PAs, then I looked at how many PAs they got in the next year. Group two I did the same thing for players who had three years averaging between 675 and 625 PAs. And for group three 625 to 575 PAs. Here are the number of PAs each of these three groups got in the next year. Along the x-axis is number plate appearances and along the y-axis the fraction of the group that got that many or more PAs. So each curve monotonically decreases as if you got over 101 PAs then you must have also got over 100.

The first thing to note is that the group of players with more PAs in the previous three years had more in the given year. That is, a greater fraction of group one had 400 or more PAs than group two and a great fraction of players in group two had 400 or more PAs than group three. And this trend holds for almost any number of PAs. This should not be surprising. Players in group one are probably better, healthier and hit higher in the order, on average, than those in groups one or two. So it seems perfectly valid to use past PAs as a predictor for number of PAs in the future.

But that doesn’t mean that you just use the past average as your prediction. The horizontal line at p=0.5 shows the median number of PAs for each group. These values are ticked off on the x-axis. They are 667 for group one, 630 for two and 557 for group three. Although players in all three groups still go a larger number of PAs it was less than they had averaged in the past three years — they regressed to the man. There is nothing special about three years (I just chose it to get players with a history of playing in lots of games) you would see the same drop off if you just chose players who averaged a large number PAs in the two previous or just the last year.

Next I highlight the fraction of each group that gets 700 or more PAs. That is the vertical line. The tick marks on the y-axis show the intersection points: 24% for group one, 12% for group two and 1.5% for group three. So less than a quarter of players who averaged about 700 PAs for three years got 700 PAs the next year.

Part of this is aging. In a given year, a player is older than he was three years ago, duh, and probably more likely to be injured and have fewer PAs. But part of it is that getting 700 PAs is part skill, being a good, healthy player who bats at the top of an order, and part is luck, not having a fluke injury. CHONE knows that there is a chance that any player has a crash in his playing time even with a long history of over-700-PAs, over-150-game seasons and a starting job leading-off. So it rarely projects over 650 PAs. Just because someone has played in over 150 games for a number of years we cannot expect him to play over 150 games in the next.


Angels Sign Pineiro

The Angels signed Joel Pineiro to a two-year, 16 million dollar deal. Seemingly out of nowhere Pineiro had a near-5-win season last year, as his walk and fly ball rates were microscopic. He is due for some regression as no one can be expected to walk on only 1.1 batter per nine. But as I talked about before, I think the change in Pineiro’s pitch use frequencies — throwing more sinkers — insulates him from some regression. Another way of seeing this is the change in the height of Pineiro’s fastballs.

In 2009 Pineiro threw his fastball much lower in the zone than he did previously. This supports the increase in ground balls in 2009.

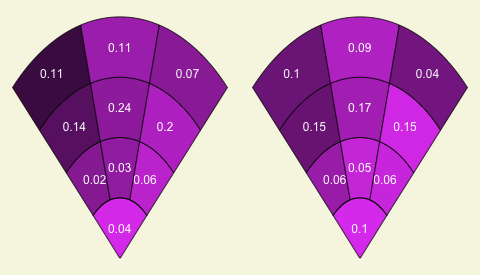
But one important thing to consider with all those ground balls is the infield defense Pineiro plays in front of. By UZR the Cardinals had just an average defense in 2009, but Pineiro gave up a lower slugging on grounders than the average NL pitcher (0.236 for Pineiro versus 0.256 for average). Using the technique from yesterday’s post I looked at the number and slugging of Pineiro’s ground balls based on their angle compared to average. I took a suggestion of Sal Paradise and got rid of the numbers, so the color is the slugging percentage and the size of the slice is the relative number of grounders to that slice.

Pineiro does much better in slices 3, 4, 7 and 8. These are the slices straight at either the second baseman or the shortstop — the ones with the lowest slugging — and for Pineiro these slices were even better than average. Pineiro got fewer grounders down the right-field line and more down the left-field line, but those down the left-field line had a lower slugging than for the average RHP.

Looking to 2010, Pineiro will most likely pitch in front of an infield of Kendry Morales, Howie Kendrick, Erick Aybar and Brandon Wood. The right side of the infield should be good: both Jeff Zimmerman’s UZR projections and Sean Smith’s CHONE defensive projections have the pair at +5 runs together. But the two systems diverge on Aybar and Wood. UZR likes Aybar at short, giving him +7.1 UZR/150 over 2000 innings. Add in regression and aging, and Zimmerman projects +5 in 2010. But CHONE’s defensive projection, which is based on Smith’s TotalZone defensive system, projects him at -2. Wood doesn’t have much time in the Bigs — thus little UZR data — so I think it is better to go with TotalZone, which covers time in the minors. Those numbers are not pretty and CHONE projects him at -6 at third. I might defer to UZR — it draws on the BIS data set which is considered better than the Retrosheet data set on which TotalZone is based — for Aybar, but TotalZone for Wood. In all, the infield will probably be about +5 runs over average. So that should not be an issue for Pineiro.

Pineiro should be a safe bet to provide at least 2.5 wins and has a good shot at maybe four wins in 2010, and then maybe a little bit less in 2011. So the price is solid even in today’s down market. With Hideki Matsui and Pineiro the Angels have added some nice pieces, but with their coming regression and the Mariners’ additions, the AL West should be competitive in 2010.


Jeter’s Seven-Win Season

Back in late July, R.J. noted that Derek Jeter was having a resurgent offensive season and on his way to an excellent year. Jeter did not let up after that, either. He finished the season with a wRC+ of 142, his best since 2006 and second best since 1999. Combine that with excellent defense at short and Jeter had a 7.5-win season, his best year in the Fangraphs-WAR era and fifth-best among position players in 2009.

Jeter’s game at the plate combines excellent contact skills, a good number of walks, and a high BABIP. The 2009 performance increase was driven by more walks, a handful more HRs and a jump in BABIP. Here I wanted to look at that increase in BABIP in a spatially explicit batted-ball manner. Jeter’s hits are mostly GBs and LDs where the angle of the hit is more important than the distance. So I dissected the field into slices, rather than zone as I did in earlier posts. The number in each slice is the percentage of Jeter’s GBs and LDs in that slice, and the color shows the slugging percentage for those hits, ranging from 0.250ish for gray to 0.800ish for dark blue.

The worst places to hit a grounder are straight at the second basemen or shortstop. Those are the grayest slices, and in 2009 Jeter, cut down the the percentage of his hits to those two slices by 4% (2B) and 2% (SS). He had more hits right up the middle (25% versus 21%), which are singles and doubles more often than outs. I don’t think this is a shift in true talent: I don’t think Jeter is any better at “aiming” his grounders. My guess is he was just on the right side of luck more often in 2009.

That is not to say Jeter is not a wildly talented baseball player. After an average defensive season in 2008 and great one in 2009, we should reevaluate our perception of him from two years ago (in 2007 he was coming off three horrible defensive season) to being probably just -5 runs at short rather than the worst defensive shortstop ever. Add that to his good offense — although not as good as 2009 — and a safe projection is 3.5 to 4 wins in 2010. After that the Yankees have a tricky negotiation, as they will probably look to re-sign the aging, (although his skills should age gracefully) face of their franchise.


A’s Re-sign Jack Cust

It is hard to remember, but at this time last year, many projection systems had the A’s right there with the Angels competing for the 2009 AL West. Noting that is in no way an indictment of projection systems — even the best have to make mistakes — but to highlight that 2009 was a big disappointment for the A’s, who had hoped to compete as they rebuilt. Probably not the biggest reason, but part of it, was the poor season for Jack Cust. In his first year with the A’s, 2007, he had a wRC+ of 144, but it has dropped in the past two, coming in at 132 in 2008 and then last year at just 111. Because he was either a DH or a poor-defending outfielder this was not enough to make him an above-average player, and he was worth just one win above replacement. Now the A’s have re-signed Cust to a one-year, 2.65 million dollar deal: What does 2010 have in store for Cust?

In July I looked at Cust’s 2009 approach at the plate, noting his decreased walk and strikeout rates. At the time he was hitting just wOBA of 0.324 — he finished at a more respectable 0.342. Since then those two rates increased and ended closer to his 2008 and 2007 values, so maybe he read my article. The other issue in 2009 compared to the two previous years was his loss of power. His ISO was above 0.240 in both 2007 and 2008, but just 0.177 in 2009. The Game Day extracted fly ball distances bear this out: in 2007 his outfield flies went on average 330 feet; in 2008, 327 feet; but in 2009, just 306 feet.

Using the technique in my Kotchman post we can look at his non-ground balls in a spatially explicit manner. Again the playing field in broken into ten zones; the number in each zone represents the percentage of his non-ground balls to that zone; and the color the slugging percentage on those balls, going from gold (indicating zero) to dark green (indicating over three). The first zone is the infield and each subsequent ring is 100 feet farther.

Like most LHBs, Cust’s power is highest to right field, and while there is not much difference in the fraction of his hits to deep right, there is a big difference in the resulting slugging. In 2007 and 2008 non-ground balls to that zone were worth, on average, 3.3 bases, but in 2009 they were worth just 2.6 bases. The other big difference is that in 2009 he traded deep opposite field balls in play for deep center field ones, and these had a poor slugging percentage. Center field walls are the deepest and so fly balls to center are less likely to be HRs, and Hit Tracker shows fewer opposite field HRs in 2009 compared to 2008 and 2007.

Although they A’s are hoping for for a rebound from Cust — and he did perform better in the second half of 2009 — they are not paying for one. Combining his 2009 one-win performance with the chance of lost playing time to injury 2.65 million seems about right.


A Look at Kotchman’s Balls in Play

The Mariners traded for Casey Kotchman and he will regain a full-time role there after playing just part-time in Boston. As Dave Cameron noted, this might be his last opportunity to show that he can hit enough to be a full-time MLB first basemen. That is not to say that he is ever going to be a big-slugging first baseman — even 20 HRs seems like a stretch — but maybe he can have doubles power and post a high enough BABIP to be an asset at the plate.

That was the case in 2007 when 37 doubles and a .308 BABIP coupled with his always good contact skills and plate discipline (over his career he has only slightly more strikeouts than walks) resulted in a solid 121 wRC+. Since then he has posted wRC+s in the 90s. Not bad, but not what you expect from a player at a position near the bottom of the defensive spectrum.

The problem has been with his balls in play, as both his ISO and BABIP have fallen since 2007. To dig deeper into the cause of this drop I wanted to look at his balls in play.

I use the same technique I introduced in my Garrett Atkins post, by breaking the field in ten zones and looking at the number of non-ground balls to each zone and the slugging on those balls (in the Atkins post I used BABIP, but here I use slugging). The first zone is the infield, and after that each ring is 100 feet from the pervious. So the three zones after the infield include balls in the air less than 100 feet beyond the infield-grass line. The number in each zone is the fraction of balls in the air to that zone. The color shows the slugging percentage on balls hit in the air in that zone. The lightest color (the infield for example) has a slugging of zero, and the darkest color (deep right field) has a slugging of about 2.5, so balls in the air to that zone result in a little bit more than a double, on average.

Clearly, Kotchman’s power is to to right field, as is typical for a LHB. But in 2007 he hit more balls, and with better results, to center field. The other major difference is in the number of balls in the air to the infield; he has had many more since 2007. These pop-ups are effectively automatic outs. Another slight difference is on the slugging on balls to left field just beyond the infield. In 2007, that was 0.778; but since, just 0.240. These are most likely bloop singles, and this difference is most likely just luck.

So the big differences are more power to center, a few more lucky bloop singles to left and fewer pop-ups in 2007. Whether he can regain 2007 is still an open question, but I think it is interesting to see that the performance in 2007 was a mix of performance (less pop-ups and more long hits to center) and luck (bloop singles). A last consideration is that, as Dave noted, Kotchman will be aided by the short right field walls in Safeco, where he hits a large proportion of his long flies.


A Small Randy Johnson Retrospective

As you have surely heard, Randy Johnson announced his retirement last night. Matthew took the first look at this, noting that he retires as someone who could be a three-win pitcher next year. Here I am going to take a more backward-facing look. Johnson retires as the career leader in strikeouts per inning, and he did so facing almost entirely right-handed (opposite-handed) batters. In Johnson’s career he faced 14,963 RHBs and just 2,103 LHBs, but over 28% of those RHBs struck out. With the pitchf/x data from the past three years here, we examine how he was able to do this as a small retrospective of his first-ballot Hall of Fame career.

Over the past three years, those covered by the pitchf/x data, Johnson threw, for the most part, just three pitches: a fastball, which Dave Cameron noted has been losing speed for years and in 2009 averaged less than 90 mph; a slider, which in the same article Dave noted has not lost any speed since 2003; and a split-finger fastball, which functions like a changeup. Over the years covered by the pitchf/x data, since 2007, and against RHBs he thew the fastball half the time, the splitter about 18% of the time and the slider 32%. That he can throw his slider, which typically shows an extreme platoon split, that often to RHBs is incredible.

Against RHBs he threw his slider inside and low in the zone, while his splitter was outside and also low in the zone. Not only did he throw his slider to RHBs often, but he did so effectively. Opponents scored 1.4 runs fewer than average per 100 sliders Johnson threw to RHBS, and it got them (RHBs) to miss on 26% of their swings. This is not that far off the average whiff rate of 29%, which is overwhelmingly generated during same-handed at-bats. His splitter also had a 26% whiff rate against RHBs. That gave Johnson two solid pitches against which RHBs had a tough time making contact, and allowed Johnson to pile up strikeouts.

I tip my figurative cap to Randy Johnson and his amazing 22-year career.


Roy Halladay

As Dave talked about, the Phillies downgraded their farm system to swap out an ace who wanted to test the free-agent waters next year, Cliff Lee, for another who was willing to sign a bargain extension, Roy Halladay. Halladay is also a slight upgrade over Lee.

Over the past three years Halladay has been the second most valuable pitcher in the game and one of only seven twenty-win players. He excels at limiting walks (under two per nine in each of the last five seasons) and getting ground balls (never less than 50% GB per BIP), while striking out an average to above-average (in the past two years) number of batters. That combination is more than enough to make him an elite pitcher.

In the build-up to the last season’s trade deadline, when it looked like he might be dealt, I broke down his stuff. He throws a cutter, two-seam fastball, curveball and the occasional changeup. In that piece I noted that he throws his cutter and two-seam fastball frequently to both RHBs and LHBs, giving him two fastballs against all batters. Here I wanted to look at where, horizontally, these fastballs were thrown compared to the average RHP’s. Here is how it looks to RHBs.
rhb_x_1215
RHPs throw their cutter away to RHBs. Halladay does this even more so: he rarely throws the pitch inside and very often throws it to the outer fourth of the plate. But his two-seam location is different than average. While the average RHP throws his two-seam fastball down the middle of the plate to RHBs, Halladay throws it extremely inside.
lhb_x_1215
Against LHPs we see the mirrored pattern, with the pitches switching roles. Overall this means that Halladay has a fastball he can locate on the inner or outer quarter of the plate against both LHBs and RHBs. This allows him to throw strikes without having to throw over the heart of the plate while mixing up the horizontal location of his pitches. I am sure this is a huge part of his success.


Atkins Non-Tendered

Garrett Atkins is an intriguing addition to the free agent pool. His career has been on a pretty steady downward trend for the past four years — from his six-win season in 2006 to his below-replacement season in 2009. His wRC+, which adjusts for Coors, has gone from 145 in 2006, to 117 in 2007, to 98 in 2008 and finally an ugly 65 this past year.

A repeat of his 2006 season is pretty unlikely, but still, a rebound to 2007 or 2008 form — a league average third basemen — could help many teams. So will we see such a rebound?

In 2009 his problem was batted-ball based, not plate discipline based (his walk and strikeout numbers were fine). His FB/HR rate dropped to a career low 7.3%, which is troubling when playing half his games at Coors, but the bigger problem was his BABIP of just .247. Before this year he averaged a BABIP of .320. What happened there? Turning to Baseball Reference’s BABIP by batted ball type:

BABIP
+--------------+---------------+-------------+--------------+
|              | Atkins Career | Atkins 2009 | League Aver. |
+--------------+---------------+-------------+--------------+
| Ground Balls |         0.247 |       0.256 |        0.235 |
| Fly Balls    |         0.108 |       0.055 |        0.142 |
| Line Drives  |         0.711 |       0.600 |        0.718 | 
+--------------+---------------+-------------+--------------+

The problem was definitely with balls in the air. They not only went for HRs much less often but they dropped in for hits at a much smaller rate. Below I broke up the playing field into ten zones, counted the fraction of Atkins balls in the air to each zone and color coded each zone based on its BABIP (darker the better). The image on the left is for 2006 to 2008 and on the right is for 2009.
atkins_spray_1214
Atkins is just not hitting the ball as far: the four closest zones have more balls in play in 2009 than in 2008 and all but one of the farthest six zones have fewer. Atkins plays serviceable defense at third base and walks at an above average rate while striking out at a below average rate, but if he wants to have a job as a starting third basemen he is going to have to get back to hitting the ball with some authority.


The Red Sox Acquire Boof

The Astros provided one example of stocking a bullpen, and now the Red Sox provide another. The Sox picked up Boof Bonser, who was to be designated for assignment, for some cash or a PTNL. Bonser will be cheap and under team control for a number of years (he has three years of service time), and could be as good as Brandon Lyon out of the pen.

Bonser has a FIP of 4.60, compared to Lyon’s 4.23, but most of Bonser’s innings were as a starter. Adjust for the bullpen bonus and he should be better than Lyon. Of course, Bonser is coming off rotator cuff surgery. Maybe he will not pitch the whole year or come back at full strength. Still, he could also come back strong and pitch like he did out of the pen for the Twins in 2008, when he had an xFIP of 3.39 with 55 Ks to 16 BBs over 52 innings. He also has value as a spot-starter. It fits into the new school of bullpen construction: throw a lot of pitchers with potential upside but some question marks at a wall and one or two are bound to stick.

Anyway, picking up Bonser is a perfect counter example of player acquisition to the Astros overpayment for a middling reliever who posted a low ERA built on low BABIP luck.