You bring in star pitchers for games like this. Cost? That’s for the accountants. You can’t put a price on a lockdown playoff start, the kind that sucks the air out of the opposing offense one out at a time. Bring in an ace, find your way to the playoffs, and the dominance will flow.
Oh, this is awkward. Did you think I was talking about Max Scherzer? I meant Yu Darvish, who the Padres acquired before the 2021 season in a blockbuster trade. Darvish didn’t harness his usual swing-and-miss stuff Friday night, but he’s spent the entire 2022 season learning how to succeed without it. He’s never run a lower strikeout rate or missed fewer bats, but it hasn’t mattered: He’s having his best season in eight years thanks to a raft of soft contact and no walks to speak of.
Darvish has been a cutter-first pitcher for years, and he leaned into it to the tune of 39 cutters in 101 pitches against the Mets. It’s still Yu Darvish we’re talking about, so he threw six different pitch types, but cutters and four-seamers comprised 65% of his offerings. Add in his slider, and the count climbs to 90%. We think of Darvish as overpowering opposing hitters, but he’s become adept at keeping them off balance, with equally offense-suppressing results. The Mets were eternally in a 1-2 count, eternally popping up pitches they were just too early or too late on. Read the rest of this entry »
There isn’t a lot to ponder for most teams when it comes to Wild Card starters. The Padres should start their best three starters. So should the Phillies, Guardians, Blue Jays, Mariners, and Padres. That leaves the Rays, Mets, and Cardinals as teams that have decisions to make, at least in my estimation. The Rays — well, let’s just say that if the Rays called up a sentient ham sandwich to start in the playoffs, we analysts would dig into Ham Sandwichson’s minor league numbers and try to figure out what they saw. There’s no predicting Tampa Bay. That just leaves the Mets and Cardinals.
New York Mets
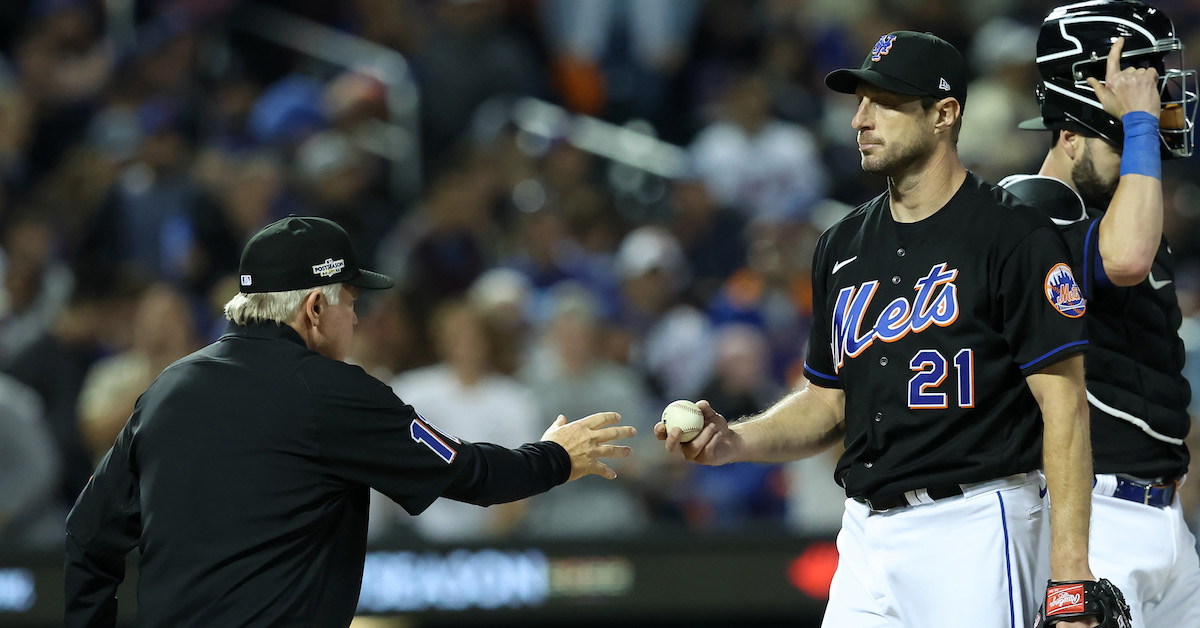
Wait, the Mets? They have Max Scherzer and Jacob deGrom, backed by Chris Bassitt and Carlos Carrasco. They’ve already announced Scherzer for the first game; can’t they just run out deGrom and then Bassitt (or Carrasco) in case of a deciding game? Sure, they could. But they should — and probably will — get fancy by holding deGrom back, something I expect them to do should they win the first game of the series.
This doesn’t sound like a good plan offhand. Leave the best starter on the planet behind Bassitt, a man whose fastball can best be described as “adequate,” in a game where you could end the series with a win? That sounds too cute by half for a franchise eternally stepping on rakes. Read the rest of this entry »
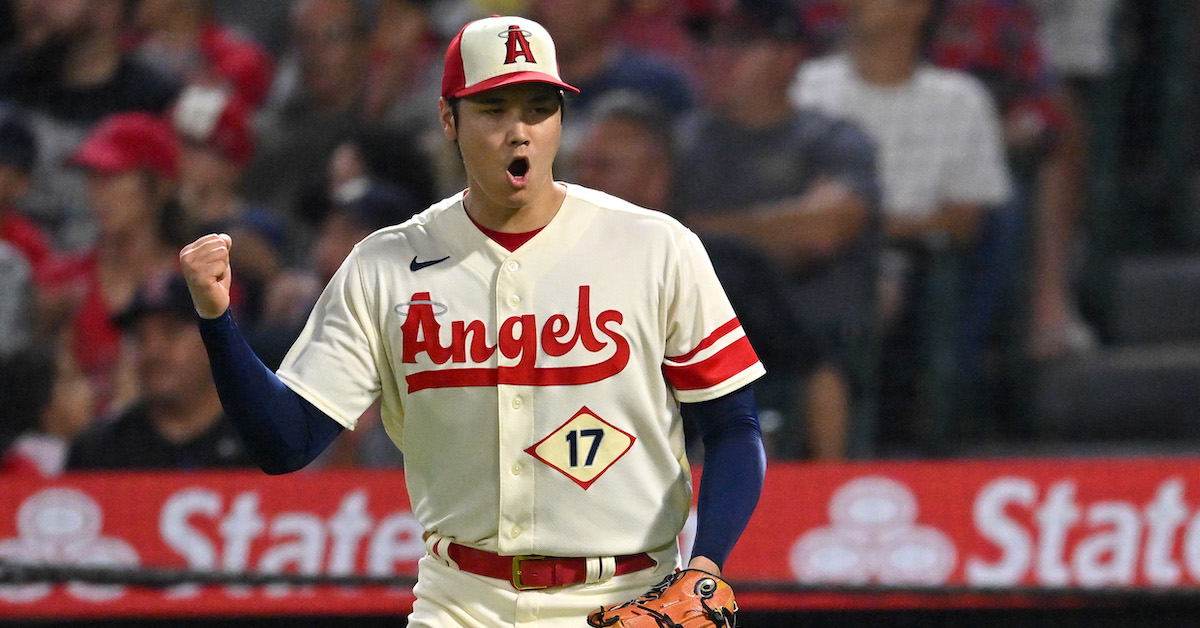
Shohei Ohtani is one of the best pitchers in baseball and one of the best hitters in baseball. That’s the first thing everyone thinks when his name comes up, and it always will be. He pitches and hits! How could you talk about anything other than that?
While that’s true, it’s leaving out something important. Ohtani is fascinating not just because he’s a two-way player, but because he’s completely overhauled his pitching approach in the middle of his best season yet. When Ohtani threw eight two-hit innings in his latest start, he hardly resembled the pitcher he was in 2021 – or even early in 2022.
When Ohtani pitched and hit his way to the American League MVP award last year (my colleague Jay Jaffe recently covered his quest to defend that title), he did so with a garden-variety pitch mix. He relied most on his four-seam fastball and complemented it with two plus secondaries, a slider and a splitter. He mixed in the occasional cutter and curveball, but mostly stuck with his best three offerings. It’s a classic pairing: fastball, breaking ball, offspeed pitch. It worked because all three pitches are excellent; if you had a 100 mph fastball, a fall-off-the-table splitter, and a biting slider, you’d probably do the same.
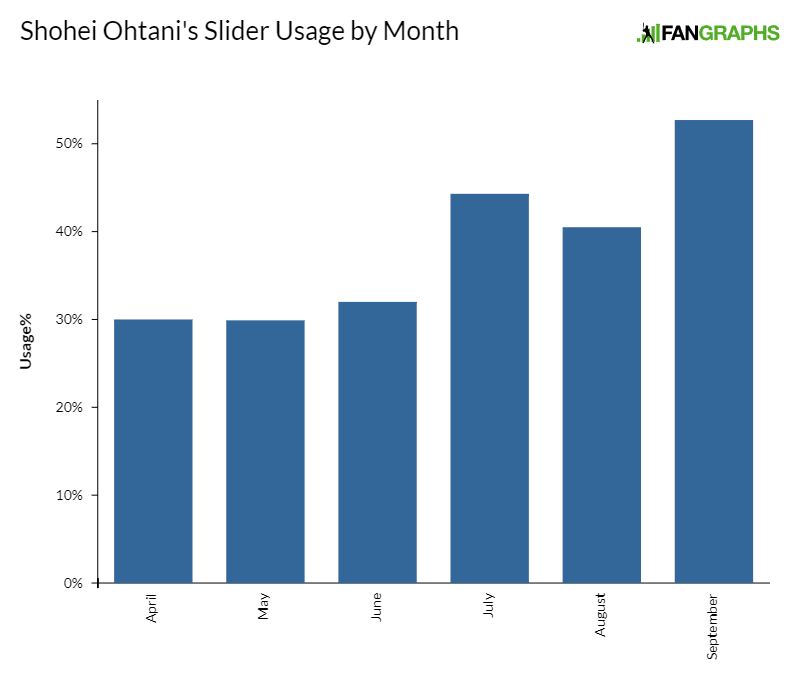
Over the offseason, though, Ohtani overhauled his slider. He came out this season throwing it harder and more frequently. In his third start of the year, he flirted with perfection against a loaded Astros lineup, and from that point on, he was a slider-first pitcher. Look at his slider usage by month this year and marvel:
For a moment, it seemed like Aaron Judge might not reach 62 home runs. After hitting his 61st in Toronto last Wednesday, he fell into what counts as a slump for him these days: four games, two hits, and a handful of walks. After feeling inevitable for most of September, 62 suddenly felt tenuous.
What a foolish sentiment. Judge, as we’ve seen all year, is a home run machine. He’s an offensive machine, in fact, blowing away the rest of the league with the kind of performance not seen since Barry Bonds in his prime. Unlike most single-season home run chases, Judge’s season isn’t defined by a single round number. His offensive greatness is so robust, so all-encompassing, that treating this accomplishment as the crowning achievement of his season is unfair.
The single-season home run record in major league baseball is 73. It was set in 2001, by Barry Bonds. Sixty-one has a ring to it, of course, because it was the record for so long. It was also the American League and Yankee record, two marks that feel weighty even if they aren’t quite as impressive as “best of all time.” Plenty of the fanfare around Judge comes from the sheer rarity of seeing so many homers, but plenty also comes from the fact that some fans would prefer to ignore everything that happened from 1998 to 2001 and make the record 61 again.
I’m giving you permission to tune all of that out. Sixty-two home runs is cool regardless of what the all-time record is. Only six players have ever accomplished the feat of hitting 60 home runs, and you know all of their names: Bonds, Mark McGwire, Sammy Sosa, Roger Maris, Babe Ruth, and now Judge. That alone is mind-blowing; baseball has been around an impossibly long time, through periods of high and low scoring, and yet only six players have ever cracked 60 home runs in a year throughout it all.
Does that mean hitting 62 is anti-climactic? I’ll leave that interpretation up to you. But more so than any one increment – would it be special at 63? 65? – I’m impressed by how handily Judge has lapped the league today. Is it cool to pass Maris? Undoubtedly. If nothing else, now Judge’s future offspring can traipse around the country and opine about someone else’s homers hit in the far-off future. More pressingly, though, Judge has left the rest of baseball behind in a way not seen for many years.
Home runs aren’t hit in a vacuum. The majors go through home run droughts and booms for myriad reasons, including pitcher talent, park dimensions, pitching style, and baseball composition. It’s hard to say whether 2022 Judge or 1961 Maris hit under easier conditions, but one way to look at it is to consider how many home runs separate the major league leader from their closest challenger at the end of each season. By that standard, Judge is in impressive company. Here are the top 11 seasons (including a 10th place tie) by home run gap since the dawn of the 20th century:
First, yeah, that Babe Ruth guy was pretty good. Since the 1920s and ’30s, though, no one has done what Judge is doing. The only player to come close was Willie Mays, not exactly shabby company. Last year, Shohei Ohtani won an MVP by playing the way people think Babe Ruth did – pitching and hitting. This year, Judge is likely going to win an MVP by playing like Ruth actually did: with a ludicrous string of home runs that makes everyone else playing look like a weakling by comparison.
Even without that gap between Judge and Kyle Schwarber, though, this season would be an all-timer. The great arrow of baseball time points inexorably towards more uniformity and more talent. It’s a professional game; even the up-and-down bullpen arms and utility infielders of today work year-round at their craft, honing their bodies and minds in pursuit of fame and riches. In a sport where we measure success relative to a league baseline, that means it’s harder than ever to stand out.
This arc of progress isn’t some new phenomenon. Stephen Jay Gould, the late and celebrated biologist, wrote about it in 1986, though he framed it in terms of the extinction of .400 hitters. Standing out from the field simply gets harder with every generation because even the lesser lights of baseball now search for every possible edge.
To wit: wRC+, our marquee offensive statistic here at FanGraphs, considers a player’s production relative to his peers. A 150 wRC+ has no fixed statistical translation. It merely means that a player’s overall batting line is 50% better than the league as a whole. Judge’s mark – 208 heading into today’s action – means that he’s 108% better than the overall league.
In Ruth’s day, when dinosaurs walked the earth and many of baseball’s best players weren’t allowed to play in the same league as him, a 200 wRC+ wasn’t particularly uncommon. But as competition increased, players lapped the rest of the field less often. Ruth and Ted Williams each had career wRC+ marks that approached 200. Since 1972, though, there have only been nine individual seasons that eclipsed 200:
Jeff Bagwell, Frank Thomas, and Juan Soto all accomplished their feats in shortened seasons. Bonds – well, he’s Barry Bonds. That just leaves Judge and McGwire out of the last half-century. Heck, order every season by wRC+ and exclude Bonds, and that gives Judge the best single season relative to his peers since Williams (223) and Mickey Mantle (217) posted similarly absurd seasons in 1957.
If I had my druthers, that’s how Judge’s season would be remembered. Sixty-two home runs is neat, and I’m glad he got there. A 16-homer lead on the field is spectacular, the stuff that only long-forgotten icons of the game have ever even dreamed of. But putting together an offensive season that blows away the rest of the league to this degree, at a time when his peers are as good as they are? Goodness gracious. We probably won’t see another season like Aaron Judge’s 2022 in our lifetimes. Let’s appreciate it.
Baseball is unique among major American sports for its lengthy schedule. For six months a year, there’s a game nearly every day. Every. Dang. Day. Working for the weekend? There’s no such thing; Saturdays and Sundays are for games. Want to have a lazy one and “work from home” with a pint of Ben and Jerry’s and an eye on your emails? Yeah, uh, that’s not going to work, though you can at least wear pajamas in the dugout.
We marvel at the physical prowess of players all the time, but I’m interested in their mental fortitude. It’s hard to keep grinding day in and day out for half a year. It’s harder still when there’s no postseason carrot dangled in front of you. I’ve never personally been in a pennant race, but I imagine a chance at a hunk of metal is a great motivator. Without that powerful incentive, spending a few months with no mental breaks is beyond my ken.
Earlier this year, I observed that down-and-out teams perform worse than expected late in the season. That seems entirely reasonable. I’ve always wondered where that effect comes from, though. Every time I try to look for hitting or pitching performance relative to expectations late in the season, I find a whole lot of nothing. Read the rest of this entry »
Tuesday night, I watched Ryan Helsley face the middle of the Brewers order in the bottom of the eighth inning. It went roughly how you’d expect – strikeout, groundout, strikeout. He came back out for the ninth, and after an inning-opening walk, closed out the frame with another two strikeouts and a groundout. It didn’t feel surprising; that’s just what great relievers do at the end of games.
That wasn’t always the case. The game has changed over the years. Relievers are pitching fewer innings per appearance, and doing so in better-defined roles. Strikeouts are up everywhere. Velocity is up everywhere. Individual reliever workloads are down, which means higher effort in a given appearance despite bullpens covering more aggregate innings. I’m not trying to say that the current crop of relievers doesn’t have structural tailwinds helping them excel. But seriously – top relievers now are so good.
Look at the top of this year’s WAR leaderboard for relievers – either RA9-WAR or FIP-based WAR will do – and you’ll see a veritable wall of strikeouts. Edwin Díaz, Devin Williams, A.J. Minter, Helsley, and Andrés Muñoz are all in the top 10 and all run preposterous strikeout rates. They’re good in an in-your-face way. Since I’ve watched baseball, dominant late-inning relievers have succeeded by striking batters out, but that trend has accelerated in the past decade or so. Here, take a look at the strikeout rate of the 10 top relievers in baseball, as determined by fWAR, every year since integration:
It doesn’t take a keen eye for analysis to watch a baseball game and guess which player is the slowest. You could grab a stopwatch and time them running to first, or you could just take a look at the short and stout guy crouching all game and wearing body armor. I’m not breaking any ground when I tell you that catchers are the slowest major leaguers.
A less settled question: why are they so slow? Is it the armor? Is it the short and stout part? Is it the deleterious effect of crouching all day? We have eight years of sprint speed data, so I decided to dig into it and look for an answer.
First things first: I constructed a sprint speed aging curve. To do that, I took every player-season with at least 10 competitive runs starting in 2015. For each player-season, I noted their age, position, sprint speed in year one, and change in sprint speed in the subsequent year (assuming they made at least 10 competitive runs). For example, Byron Buxton was 21 in 2015 and posted an average sprint speed of 30.9 ft/sec on competitive runs while playing center field. The next year, he again posted an average sprint speed of 30.9 ft/sec. Thus, I recorded 21, CF, 30.9, and 0 (change). Read the rest of this entry »
Oh, did that title get your attention? I thought it might. Bad news, though! It was just a trap to get you to read this. I’m here to talk about the same thing we talk about around this time every year: projections offending people. I don’t like it any more than you do, but that’s just the name of the game when October comes around. We post playoff odds before the season, which means we’re always missing on some team or other. That’s right: as best as I can tell, Cleveland fans are upset that we gave their team a 93.3% chance of making the playoffs in 2019, only to have them miss out on the postseason.
Okay, fine. I’m actually talking about the Guardians making the playoffs this year after starting the season with a 7.5% chance of winning their division, as the league helpfully noted on Twitter earlier this week:
I brought up the 2019 example to make a point: our odds miss in both directions. They’re not biased for or against the Guardians specifically. I thought it might be useful to look into a few things our model doesn’t handle particularly well that might have understated the Guardians’ chances, a few things the team did well to improve its odds, and a few breaks along the way that Cleveland deftly took advantage of. Read the rest of this entry »
Trevor Rogers was a revelation in 2021. He went from having a forgettable first major league season in 2020 to being a near-ace in short order, piling up strikeouts galore en route to a 2.64 ERA with the peripherals to match over 25 starts. You can’t throw a stick in Miami without hitting a pitcher who’s a potential difference-maker, but even against that backdrop, Rogers looked like one of the team’s brightest young stars.
This season hasn’t gone according to plan, to say the least. Rogers has been slowed by injury, hitting the IL thanks to back spasms and later a lat strain that shut him down for the year with the Marlins out of contention. But even when he wasn’t hurt, he struggled across the board. He struck out fewer batters, walked more, gave up 150% more home runs than in his 2021 campaign in fewer innings, and generally looked like a fish out of water.
If you’re painting with a broad brush, the story here is easy to understand. Rogers was better than expected in 2021, so our expectations got too high, and then he went back to his pre-breakout form. If you look closely, though, that’s not what happened at all. Rogers changed a ton about his game. Some of that change was good, some was bad, and I’m quite curious to see what sticks when he returns next year. Read the rest of this entry »