Author Archive

Speed Plot – May 14th, 2006

Daily Best

Jeff Francoeur – If a walk-off grand slam doesn’t get you top honors, what does? It wasn’t an “ultimate grand slam“, but I doubt any Braves fans are complaining. After hitting just .210 in April, he’s managed to raise his batting average to .250 by hitting a much better .310 this month. Back on May 9th he completed the daunting task of drawing his first walk of the season. Last year it took him 129 plate appearances to draw a walk and this year it took him 135 appearances.

Jon Lieber – Holding the National League’s top offense (the Reds) hitless through 7 innings was quite impressive and lowered his ERA to 5.50 on the season. A batting average on balls in play (BABIP) over .350 and a left-on-base percentage (LOB%) of 55.9% will tend to balloon your ERA. This start was more along the lines of what Lieber is capable of.

Daily Worst

Johnny Peralta – Going 0 for 4 and grounding into a double play with runners on first and second in a close game is the perfect way to make the worst list. He’s been dissapointing so far this year despite having a decent BABIP and a higher line-drive percentage. He’s been making slight corrections to his swing which will hopefully snap his slump. Don’t be surprised if the hits start falling soon.

Danys Baez – It takes some real skill to accumulate a -95 WPA over just one game. That makes him responsible for almost two losses! Baez’s has really cut down on his walks this year, but 5 blown saves are the only thing people will see. Hang in there until Eric Gagne returns.

The 5 Players I Feel Like Writing About

Jason Schmidt – He’s now thrown back-to-back complete games, something he hasn’t done since 2003. The strikeouts aren’t coming as frequently as they once were, but I’ll take a pitcher that can strike out 13 batters in 18 innings while issuing no walks, anyday. Keep a close eye on his walks; they will be key for him this season.

Todd Jones – Since coming back in late April, he’s converted 9 out of 10 save chances. He’s keeping his walks just as low as they were last season, but his strikeouts per 9 innings (K/9) have nearly been cut in half from 7.6 to 4.4. That’s way below the acceptable level for closers and even Bob Wickman strikes batters out more often! As long as he’s converting saves he’ll hang onto the role, but I really feel Fernando Rodney is the better option.

Placido Polanco – While we’re on the topic of Tigers, Polanco has abandoned his patience and has starting to chase pitches out of the strike zone over 30% of the time. Last year he chased pitches just 16% of the time. The 14% increase has resulted in him drawing just one walk all season. Furthermore, his batting average and BABIP have returned back to his career norms. A repeat of last season’s .331 average is probably wishful thinking.

Carlos Lee – Could this guy please get a little more attention? He’s now batting just over .300 with 15 home runs; second only to Albert Pujols‘ 19. The secret to his success has been a bit more patience at the plate. He’s chasing bad pitches about 5% less and it’s resulted in a 5% decrease in his strikeout rate. It’s easier to make contact when you swing at hittable pitches.

Roy Halladay – Jason Schmidt was not the only pitcher to throw back-to-back complete games this week. Halladay limited the Angels and Devil Rays to just 1 run each while striking out 9 and walking 2. I think Halladay’s great, but if he just becomes complacent with his ground ball inducing powers and stops striking batters out, he’s in danger of turning into Tim Hudson.


Daily Graphing – Rafael Soriano & J.J. Putz

As proof that I have too much time on my hands (if FanGraphs wasn’t proof enough), I was trying to think of which two pitchers currently made up the best setup-man/closer combination in baseball. The Angel’s tandem of Francisco Rodriguez and Scott Shields came to mind immediately along with the early season success of Mets’ Duaner Sanchez and Billy Wagner. As I went through the list of setup-men and closers, I came across the Mariners’ unlikely duo of Rafael Soriano and J.J. Putz; neither of which are “officially” a setup-man or a closer at the moment. Abandoning my original mission of finding the best pair, I thought these two would be perfect for my first Daily Graphing in over a month.

Back in 2004, Soriano looked like he might be headed to the starting rotation after posting a 1.53 ERA in 53 innings of relief in 2003, but Tommy John surgery limited him to just 10 innings the past two seasons. Putz on the other hand has thrown 123 innings the past two season with a 4.17 ERA and even served as closer for a brief period of time in 2004. This season, the two have combined for a 2.45 ERA in over 36 innings of work.

graphs_1795_1100_0_pitcher_season_1_blog_20060512.png

Neither of the two have any problems striking out batters as Soriano strikes out over 11 batters per 9 innings (K/9) and Putz currently has a K/9 over 12! As you can see, Soriano has always had immense strikeout potential, but this season, Putz has almost doubled his 2005 strikeout rate. Most of the rise is due to less reliance on his fastball (which Putz used to throw almost exclusively) and increased use of both his slider and splitter.

graphs_1795_pitcher_daily_10_blog_20060511.png

In terms of batted balls, the two couldn’t be more different. Putz has taken his groundball tendencies to new heights (or should that be lows?), by inducing groundballs 64% of the time. And Soriano manages to have 52% of his balls lifted into the air. Both of them are near the league leads in the respective specialties.

graphs_1795_1100_0_pitcher_season_4_blog_20060512.png

Typically, a 52% flyball rate might cause concern in the home run department, but I honestly don’t think it’s much of an issue with Soriano, considering his extremely high strikeout rate, not to mention his home-runs-per-fly-ball percentage has historically been low. Even though Putz does an excellent job of keeping the ball on the ground, he’s has had trouble with home runs in the past, but most of them were off his fastball which, like I mentioned before, he’s become less reliant on.

While Soriano and Putz aren’t exactly household names, through the first six weeks of the season, they have been two of the very best relievers in baseball. There’s absolutely no reason why they shouldn’t be able to continue their success. Next time you’re discussing the best setup-man/closer combinations (assuming these two eventually get slotted in permanently), you’d be wise to include them in the discussion.


Leverage Index

Leverage Index (LI) is now available for all games and on a player-by-player basis. Much thanks to Tangotiger for letting us use his Leverage Index table to generate the graphs and player data. You can read more about Leverage Index here: Hardball Times: Critical Situations

There have also been some changes made to the Win Probability table which have resulted in some slight changes to Win Probability Added for each player. For the most part, all players should remain ranked the same in WPA, but pitchers should now have slightly more value than before and batters slightly less.


Win Probability Updates

We’ve listened to your suggestions and have improved our Win Probability section by adding box scores, inning markers, and WPA season totals!

Click here for the new Win Probability Charts & Box Scores….
Click here for the new WPA Season Totals….


Win Probability

You may have noticed (or not) that I haven’t been writing much recently. That’s because I’ve been working away at putting together a Win Probability section which can be found under the “teams” tab. We’re going to try and plot each and every game during the season and include the Win Probability Added for each player on each team. You can read all about Win Probability here:

The Hardball Times: The One About Win Probability (Dave Studeman)
Major League Baseball Graphs (Dave Studeman)

Since we’re automating these graphs, our calculations might vary slightly from other WPA charts you’ve seen, but they should be “good enough” until I can tweak them to death. All credit/blame for each play is assigned to the pitcher or batter. We do not take good/bad fielding into account. Hopefully there aren’t any bugs, but if you find any, please let us know.

Click Here For Win Probability Graphs…


Speed Plot – April 5th, 2006

Daily Best

Jeremy Bonderman – It pains me to give Bonderman best of the day (mostly because he’s a favorite of my fantasy baseball nemesis), but giving up just 3 hits and striking out 8 in 6 plus innings of work was too good to ignore. He induced 13 ground balls and only 2 fly balls, one of which was an infield-fly. Playing against the Royals certainly didn’t hurt.
Runners up: Bronson Arroyo, Josh Beckett

Ivan Rodriguez
– Even though he had arguably the worst plate discipline of any player last season, he managed to get the bat on the ball last night all 11 times he swung. Three of those times he connected for doubles, one time for a home run, and the other time for a single making him a perfect 5-5 on the night. He also drove in 5 runs in the 14-3 drubbing of the Royals.
Runners Up: Tori Hunter, Jay Gibbons

Daily Worst

Seth McClung – Sure McClung’s fastball might top out at over 100 mph, but when you walk 7, maybe it’s time to ease off the gas a bit. He also gave up 5 hits and 7 runs in just 3 innings of work.
Runners Up: Odalis Perez, Steve Stemle

David Ortiz – The Red Sox pitching managed to fend off the Rangers tonight and it’s a good thing too. The usually great Ortiz struck out once, hit into not one, but two double plays and didn’t get on-base once. A very poor night for the runner-up MVP.
Runners Up: Bernie Williams, Matt Holliday

The 5 Players I Feel Like Writing About

Prince Fielder – The contact watch is over! For the first time this season (all of 3 games), Fielder didn’t strike out once and drove in the winning run in the bottom of the 8th inning. He still only made contact with the ball 50% of the time, but it’s the results that matter. Right?

Orlando Hernandez
– In his first start for the Diamondbacks, he was impressive striking out 8 and surrendering only 1 run in 5 innings of work. Anyone taking bets on another 7-1 start from El Duque? If he can stay healthy, he should do just fine.

Derrek Turnbow
– He’s notched a save in all three of the Brewers’ games, but has walked 2 and given up 4 hits making things a little dicey at times. It’s way too early to make any assumptions, but it’d be nice to see him make things easier on himself instead of having to gut out 1 run games with runners on 2nd and 3rd.

Danny Haren – Walking none and striking out 8 players in one of the most feared lineups in baseball was definitely impressive. Besides giving up a solo home-run to Matsui in the 2nd, most of the damage was done on a 3 run-homer by Sheffield in the 3rd. He’s never had too many problems giving up home runs in the past, so I wouldn’t expect it to be much of an issue this year. It will be interesting to see if he can continue to strike batters out at anywhere near his current pace.

Jonathan Papelbon – Given the nod to close out the game last night, Papelbon was excellent, striking out two in a perfect ninth. In his short stint in the majors last year, he showed all the skills necessary to be a top closer. If he’s not needed in the rotation, I wouldn’t be shocked to see him hang on to the closers job all year long.


Daily Graphing – Curt Schilling

After having the worst season of his career in 2005, it looked like a healthy Curt Schilling took the mound in the Red Sox season opener, going 7 strong inning and giving up only 2 runs. This off season, there was much talk about whether he would return to his 2004 form and while it’s still very early in the season, this first start was a much needed positive sign for Red Sox fans. Let’s take a look at why he was successful in his first start and if it’s something he’ll be able to duplicate.

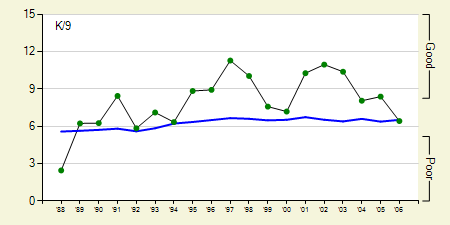
K9

Despite his 5.69 ERA in 2005, he continued to strike batters out without too much of a problem. Batters chased his pitches outside the strike zone 29% of the time which was 3rd best among starting pitchers. Additionally, batters fouled off pitches they made contact with 51% of the time which also ranked him in the top 10. Basically, he didn’t lose his “stuff” even though he had a poor season.

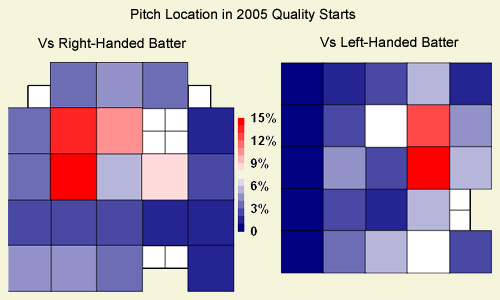
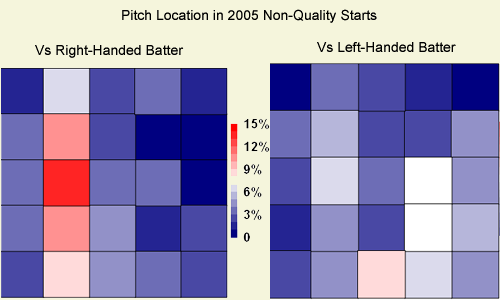
In his first start of the 2006 season, everything fell pretty much inline with his 2005 stats except for two things. First of all, batters had even more trouble putting the ball in play as they fouled off his pitches an extremely high 59% of the time compared to the 51% last season. Second of all, he located pitches differently. Take a look at the pitch location charts (data provided by Baseball Info Solutions) for his quality and non-quality starts from August and September of 2005.

QS
NQS

Schilling mainly pitched to right-handed batters outside, but notice how he also threw right-handed batters inside much more often in his quality starts and almost never in his non-quality starts. Furthermore, in his quality starts, he did a good job locating his pitches outside against left-handed batters while in his non-quality starts, he was all over the place. Now take a look at his first start of the 2006 season:

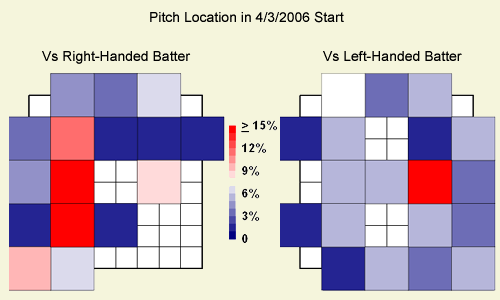
Opening Day Start

Looks exactly like a Schilling quality start from 2005, doesn’t it? Schilling’s peripherals were excellent last year and remained strong in his first start this year. As long as he continues to pitch inside to right-handed batters and locate his pitches against left-handed batters, I don’t see any reason why he can’t still be a very dominant pitcher.


Speed Plot – April 4th, 2006

The Daily Best

Brad Penny – Blanking the Braves for 5 innings while striking out 8 and walking none was enough to give Penny top honors for the day. Between injuries in 2005, he actually had a few scattered performances just like tonight’s. His strikeouts per 9 innings (K/9) made a nice climb out of the gutter towards “good” territory last season, but his walks per 9 innings (BB/9) headed in the wrong direction. This was definitely a good start.
Runners Up: Sergio Mitre, Vincente Padilla

Aaron Boone – Today, Boone was a triple shy of the cycle, which has happened 1,141 other times the past 4 years. He’s actually accomplished this not so rare feat 3 other times, but his 4 hits (previous best 3 hits) made this by far his best “triple shy of the cycle” performance. He’s also batting .556 on the year and is playing well enough to keep his job, for now.
Runners Up: Brad Wilkerson, Richie Sexson

The Daily Worst

Andy Pettitte – Joining one of the many quality pitchers that had rough starts in their first outing, Pettitte was pretty horrible giving up 13 hits and 7 runs in 4 plus innings of work. He’s giving up 7 or more runs 17 times in his career, but he’s never given up more hits per inning. This start is definitely in contention for the worst of his 12 year career.
Runners Up: Tim Wakefield, Freddy Garcia

Jason Bay – With everyone expecting Bay to have a huge season, he is hitless in his first two games. He did walk 3 times in the opener, but he managed to go 0-4 today and do absolutely nothing when he was the tying run in the 8th inning. He grounded into a double player earlier in the game too. Those worrying that he will not be thrown many strikes this year, fear not. He wasn’t thrown that many strikes last year either and did just fine. I don’t expect to see him in this spot again.
Runners Up: Laynce Nix, Jeff Francoeur

Prince Fielder: Contact Watch!Fielder is now 0-9 with 7 strikeouts.

MLB.com’s Customer Service – I have now been on hold by MLB.com for 77 minutes and 6 seconds. I think I have listened to an entire Mascagni opera which makes me want to dig up my copy of “Raging Bull”. Maybe if I pop it in now, I’ll finish it just in time to actually talk with a representative.

The 5 Players I Feel Like Writing About

Johan Santana – Looks like he’s off to his typical slow start as he gave up 10 hits and 4 runs in 5.2 innings against the Blue Jays. He struck-out just 3 batters and walked 1. Over the past two seasons he’s had a 4.05 ERA the first half, compared to a 1.62 ERA in the second half. The biggest difference being his struggles with the long ball early in the season.

Jim Thome – Two games into the season and the man who hit over 40 home runs for 4 consecutive seasons, already has 2 home runs this year. He’s batting .500 on the season, with no strikeouts. His isolated power (ISO) is way off the chart! Aren’t small sample sizes fun?

Brandon Webb – Pitching at Coors Field yesterday, Webb took his ground ball tendencies to the utter extreme by inducing 21 ground balls and a single fly ball. The only pitcher to have a higher GB:FB ratio in a single game the past 5 seasons is Zach Day. Back on June 6th, 2003, Webb induced a personal high 25 ground balls.

Josh Willingham – Joining Albert Pujols and Chris Shelton in the 2006 multi-homer game club, Willingham is showing why he was touted by many as a “fantasy sleeper”. Going 3-7 in his first two games with just one strikeout isn’t too shabby. In the opener he made contact with every single pitch he swung at. So far, so good.

John Lackey – Being the Lackey fan that I am, I was disappointed to see him have such a poor outing in his season debut. He struggled to keep runners off base in every inning, but despite his 5 earned runs and 9 hits, he still struck out 4 and walked only 1 in 4 innings. He’s been a pretty slow starter the past two years (6.18 ERA in April), so there should be much better days ahead of him.


Speed Plot – Opening Day

The Daily Best

Roy Oswalt – It looks like Oswalt is well on his way to his third straight 20 win season as he blanked the young Marlins for 8 innings while striking out 8 and walking one. Now that he’s out of Roger Clemens‘ shadow in Houston, maybe he’ll get a little more attention and maybe even a Cy Young award? Third time’s a charm.
Runners up: Jake Peavy, Jason Jennings

Hideki Matsui – In the 2005 season opener he went 3-5 with 1 HR and 3 RBI’s and this year started off pretty similar. In his 4-4, 1HR, 4 RBI effort he got hits off four of the five different A’s pitchers. Did you know that this was his 2,061 consecutive game if you include the 1,573 games he played in Japan? That’s getting up there and would (but doesn’t) give him the 3rd longest streak.
Runners Up: Albert Pujols, Alex Rodriguez

The Daily Worst

Barry Zito – This is really a no-brainer. In his shortest outing ever, he managed to give up 7 runs including a grand slam to Alex Rodriguez. I’m not the biggest Zito fan, but let’s chalk this one up to opening day jitters and a total lack of control. On the bright side, there’s no place for his ERA of 47 to go but down.
Runners Up: Jon Leiber, Derek Lowe

Prince Fielder – On his first opening day, Fielder did nothing to help his Rookie of the Year campaign. He went 0-4 striking out in all four of his at-bats. While the odds of him striking out in 100% of his at-bats for the season are slim, it might be a while before he improves on last year’s 28% strikeout rate. The power’s there, but the contact is lacking.
Runners Up: Garrett Anderson, Mark Grudzielanek

The 5 Players I Feel Like Writing About

Jason Jennings – In an odd opening day pitcher’s duel at Coors Field, Jennings held his own against Brandon Webb by going 7 strong innings while striking out 6 and giving up only 1 run. He’s coming back from a broken finger that kept him out most of last season and while it’s a nice story to see him do well, there’s not much in his past to suggest he can continue his opening day success.

Matt Murton – I wrote a glowing Matt Murton Daily Graphing back in February and between batting .400 in spring training and his 3-5 opening day performance, he’s done nothing to shy me away. It was especially nice to see him hit a home run since power’s been the knock on him.

Chris Shelton – I wasn’t so high on Shelton this off-season because of the way he finished out 2005 (and his fairly average plate discipline), but a few more 2 home run games will make me change my mind in a hurry.

Chris Reitsma – How long do you think it will take Bobby Cox to remove Reitsma from the closers role (again). Given a three run lead, he nearly allowed the Dodgers to complete what would have been, a rather mind blowing comeback. Actually, he barely has borderline closer stuff, striking out just over 5 per 9 innings, with only his extremely low walk rate of 1.7 to save him. Only problem is, the Braves don’t exactly have a deep bullpen and cutting Joey Devine didn’t help.

Fernando Rodney – With Todd Jones on the disabled list, Rodney is more than capable of handling closer duties as he proved by pitching a perfect ninth against the Royals (maybe not the best example). He struck out a quality 8.6 per 9 innings last season, but converted only 9 of 14 save chances after taking over the closers role when Kyle Farnsworth was traded to the Braves. He’ll be the guy at least until Jones comes back.


2006 Stats Are Live

Much to my surprise, FanGraphs actually works with 2006 stats which are now up and available for viewing. There will be some additional site enhancements later this week.