Blake Snell Has Been in the Zone (Somewhat More Often)
When the World Series opens on Friday night at the Rogers Centre, Blake Snell will take the ball for the Dodgers against the Blue Jays, hoping to replicate the success he’s had thus far in October. After an injury-shortened regular season, the two-time Cy Young winner has thoroughly dominated opposing hitters through his first three postseason starts, putting together one of the most impressive October runs in recent memory.
Runs — remember those? — have been hard to come by during Snell’s starts this postseason. He surrendered two during the seventh inning in the Wild Card Series opener against the Reds after holding them scoreless on one hit and one walk (against nine strikeouts) through the first six frames. Since then, he’s logged 14 consecutive scoreless innings, six against the Phillies in Game 2 of the Division Series and then eight against the Brewers in Game 1 of the Championship Series. He allowed just one hit in each of those last two starts, and while he walked four Phillies (and again struck out nine), he didn’t walk a single Brewer while punching out 10.
Thanks to his pickoff of Caleb Durbin, who singled off him, Snell faced the minimum 24 batters through eight innings — a postseason first for anybody besides Don Larsen in the 1956 World Series en route to his perfect game. It was just the second time in Snell’s 10-year major league career he completed eight innings, the other being his no-hitter against the Padres on August 2, 2024. He only needed 103 pitches for that Milwaukee masterpiece, just the third time this season he’s gone past 100. The Dodgers bullpen — in this case Roki Sasaki and Blake Treinen — put Snell’s gem at risk by combining to allow three walks, a double, and a sacrifice fly, but Treinen struck out Brice Turang with the bases loaded to ice the game. That wasn’t even the first time the Dodgers’ rickety bullpen sullied and nearly squandered one of Snell’s postseason gems, as Alex Vesia and Edgardo Henriquez allowed three runs to the Reds in what ended up a 10-5 victory, and Emmet Sheehan and Treinen combined to allow three runs to the Phillies before Vesia and Sasaki shut the door in a 4-3 win.
With the caveat that he has one or perhaps two starts remaining and has totaled fewer innings than those who have pitched in the World Series, Snell’s postseason performance thus far places him among the best of the Wild Card era (1995 onward):
| Player | Team | Season | G | GS | IP | ERA |
|---|---|---|---|---|---|---|
| Kenny Rogers | DET | 2006 | 3 | 3 | 23.0 | 0.00 |
| Matt Cain | SFG | 2010 | 3 | 3 | 21.1 | 0.00 |
| Justin Verlander | DET | 2013 | 3 | 3 | 23.0 | 0.39 |
| Blake Snell | LAD | 2025 | 3 | 3 | 21.0 | 0.86 |
| Tom Glavine | ATL | 2001 | 3 | 3 | 20.0 | 0.90 |
| Masahiro Tanaka | NYY | 2017 | 3 | 3 | 20.0 | 0.90 |
| John Smoltz | ATL | 1996 | 5 | 5 | 38.0 | 0.95 |
| Madison Bumgarner | SFG | 2014 | 7 | 6 | 52.2 | 1.03 |
| Ryan Vogelsong | SFG | 2012 | 4 | 4 | 24.2 | 1.09 |
| Curt Schilling | ARI | 2001 | 6 | 6 | 48.1 | 1.12 |
| Player | Team | Season | G | GS | IP | FIP |
| Blake Snell | LAD | 2025 | 3 | 3 | 21.0 | 1.18 |
| Justin Verlander | DET | 2013 | 3 | 3 | 23.0 | 1.31 |
| Cliff Lee | TEX | 2010 | 5 | 5 | 35.2 | 1.42 |
| Tarik Skubal | DET | 2025 | 3 | 3 | 20.2 | 1.49 |
| Clayton Kershaw | LAD | 2013 | 4 | 4 | 23.0 | 1.53 |
| Josh Beckett | BOS | 2007 | 4 | 4 | 30.0 | 1.64 |
| Zack Greinke | LAD | 2013 | 3 | 3 | 21.0 | 1.71 |
| Adam Wainwright | STL | 2013 | 5 | 5 | 35.0 | 1.73 |
| Masahiro Tanaka | NYY | 2017 | 3 | 3 | 20.0 | 1.81 |
| Cliff Lee | PHI | 2009 | 5 | 5 | 40.1 | 1.91 |
Snell’s era-leading FIP is driven by the third-highest strikeout rate (38.9%) and fifth-highest strikeout-to-walk differential (31.9%) among starters with at least 20 innings in a single postseason; this year’s model of Skubal leads both categories (48% and 42.7%, respectively). Snell hasn’t allowed a homer in his 21 innings, though the same is true for 13 other pitchers at that cutoff, and he’s almost certainly not going to catch Lee, who didn’t allow one in 40.1 innings in 2009.
Because of his tendency to skirt the strike zone as often as possible — from 2020–25, only two other pitchers out of 224 qualifiers had a lower Zone% than his 44.5% — Snell normally isn’t the most watchable pitcher. I can’t exactly recall whether it was during his 2023 season with the Padres or in ’24 while with the Giants, but one night while he faced the Dodgers, broadcaster Orel Hershiser moaned and groaned as though he were enduring oral surgery at the hands of a particularly sadistic dentist while watching Snell meticulously avoid throwing strikes. Indeed, Baseball Prospectus’ Patrick Dubuque, who unearthed that zone rate stat a couple months ago (I’ve updated the numbers) described Snell’s style as an “aesthetically repellant brand of pitching, working at the edges of the strike zone with all the grace and rapidity of a cookie-cutter shark, bleeding batters to death.”
In contrast to that reputation, the 32-year-old southpaw has been efficient and effective in his increasingly important games this fall while overpowering and deceiving hitters. From 2020–24, Snell averaged 4.28 pitches per plate appearance; in 2023, when he won his second Cy Young with the Padres, he averaged 4.25, the highest among qualifiers in either league. This year, he traded some strikeouts and walks for contact, and trimmed that to a career-low 4.00; in the postseason, he’s averaged 4.06.
Mind you, it’s been a short season for Snell, his second in a row. In his second trip through free agency in as many offseasons, he signed a five-year, $182 million deal with the Dodgers in late November, but made just two starts before being sidelined by shoulder soreness in early April, and missed almost four full months. Upon returning, he was very good in August and even better in September, closing his season by allowing just one run and nine hits in 18 innings against the Rockies, Phillies, and Diamondbacks while striking out 28 and walking just nine.
Snell finished his abbreviated campaign with a 2.35 ERA and 2.69 FIP in 61.1 innings. Lumping the final three starts of that stretch with his three from the postseason, he’s posted a 0.68 ERA and 1.09 FIP with a 39.4% strikeout rate and 7% walk rate — again with no homers allowed — in his last 40 innings. Batters are hitting .114 and slugging .137 against him in that span.
Keeping Snell’s regular and postseason numbers separate, we can see how much more dominant he’s been since the playoffs began:
| Split | IP | H | HR/9 | K% | BB% | BABIP | ERA | FIP |
|---|---|---|---|---|---|---|---|---|
| Regular Season | 61.1 | 51 | 0.44 | 28.3% | 10.2% | .314 | 2.35 | 2.69 |
| Postseason | 21.0 | 6 | 0.00 | 38.9% | 6.9% | .154 | 0.86 | 1.18 |
So how’s he doing all this? For one thing, Snell is using a different pitch mix. While he’s added 1.1 mph in average four-seam fastball velocity relative to the regular season (96.2 mph, up from 95.1), he’s throwing the heater significantly less often to batters on both sides of the plate, while emphasizing the changeup more against righties and the curve more against lefties; those are his down-and-away pitches. Against righties, he’s dialed back the usage of the curve, his down-and-in pitch:
| Pitch | RH Reg | RH Post | LH Reg | LH Post | |
|---|---|---|---|---|---|
| 4-Seam | 43.4% | 31.8% | 44.0% | 32.6% | |
| Change | 30.3% | 45.3% | 2.1% | 4.3% | |
| Curve | 22.3% | 15.4% | 19.8% | 28.3% | |
| Slider | 3.9% | 7.5% | 34.2% | 34.8% |
With that rejiggerred repertoire, Snell has baffled hitters, and he’s done it in novel fashion, throwing his pitches in the strike zone more often than in any season since his 2016 rookie campaign (49%):
| Season | IP | O-Swing% | Z-Swing% | Swing% | O-Contact% | Z-Contact% | Contact% | Zone% |
|---|---|---|---|---|---|---|---|---|
| 2024 Reg (SFG) | 104.0 | 31.8% | 63.0% | 45.5% | 44.3% | 76.9% | 64.1% | 43.8% |
| 2025 Reg (LAD) | 61.1 | 34.1% | 62.8% | 47.1% | 54.2% | 76.4% | 67.6% | 45.2% |
| 2025 Post (LAD) | 21.0 | 31.4% | 59.1% | 44.4% | 46.9% | 61.7% | 56.2% | 46.8% |
Snell still spends less time in the strike zone than your average bear, but the gap has narrowed in October. His regular season Zone% was 7.6 points below the league average (52.4%), but in the postseason, he’s just 4.7 points below the average (51.5%). Batters have approached him cautiously, swinging less often whether his pitches have been in or out of the zone, but since he’s throwing more strikes, he’s getting ahead in counts and generating more swings and misses. Here’s a breakdown of his pitches in the zone:
| Pitch | Split | Zone% | PA | AVG | SLG | wOBA | Whiff |
|---|---|---|---|---|---|---|---|
| 4-Seam | Reg | 52.8% | 75 | .264 | .417 | .298 | 19.9% |
| 4-Seam | Post | 56.4% | 19 | .211 | .316 | .225 | 22.2% |
| Change | Reg | 37.3% | 27 | .185 | .259 | .191 | 42.4% |
| Change | Post | 48.4% | 11 | .091 | .091 | .080 | 62.2% |
| Curve | Reg | 38.3% | 30 | .233 | .333 | .243 | 23.4% |
| Curve | Post | 36.8% | 7 | .000 | .000 | .000 | 25.0% |
| Slider | Reg | 33.3% | 7 | .571 | .714 | .557 | 28.6% |
| Slider | Post | 29.8% | 5 | .000 | .000 | .000 | 60.0% |
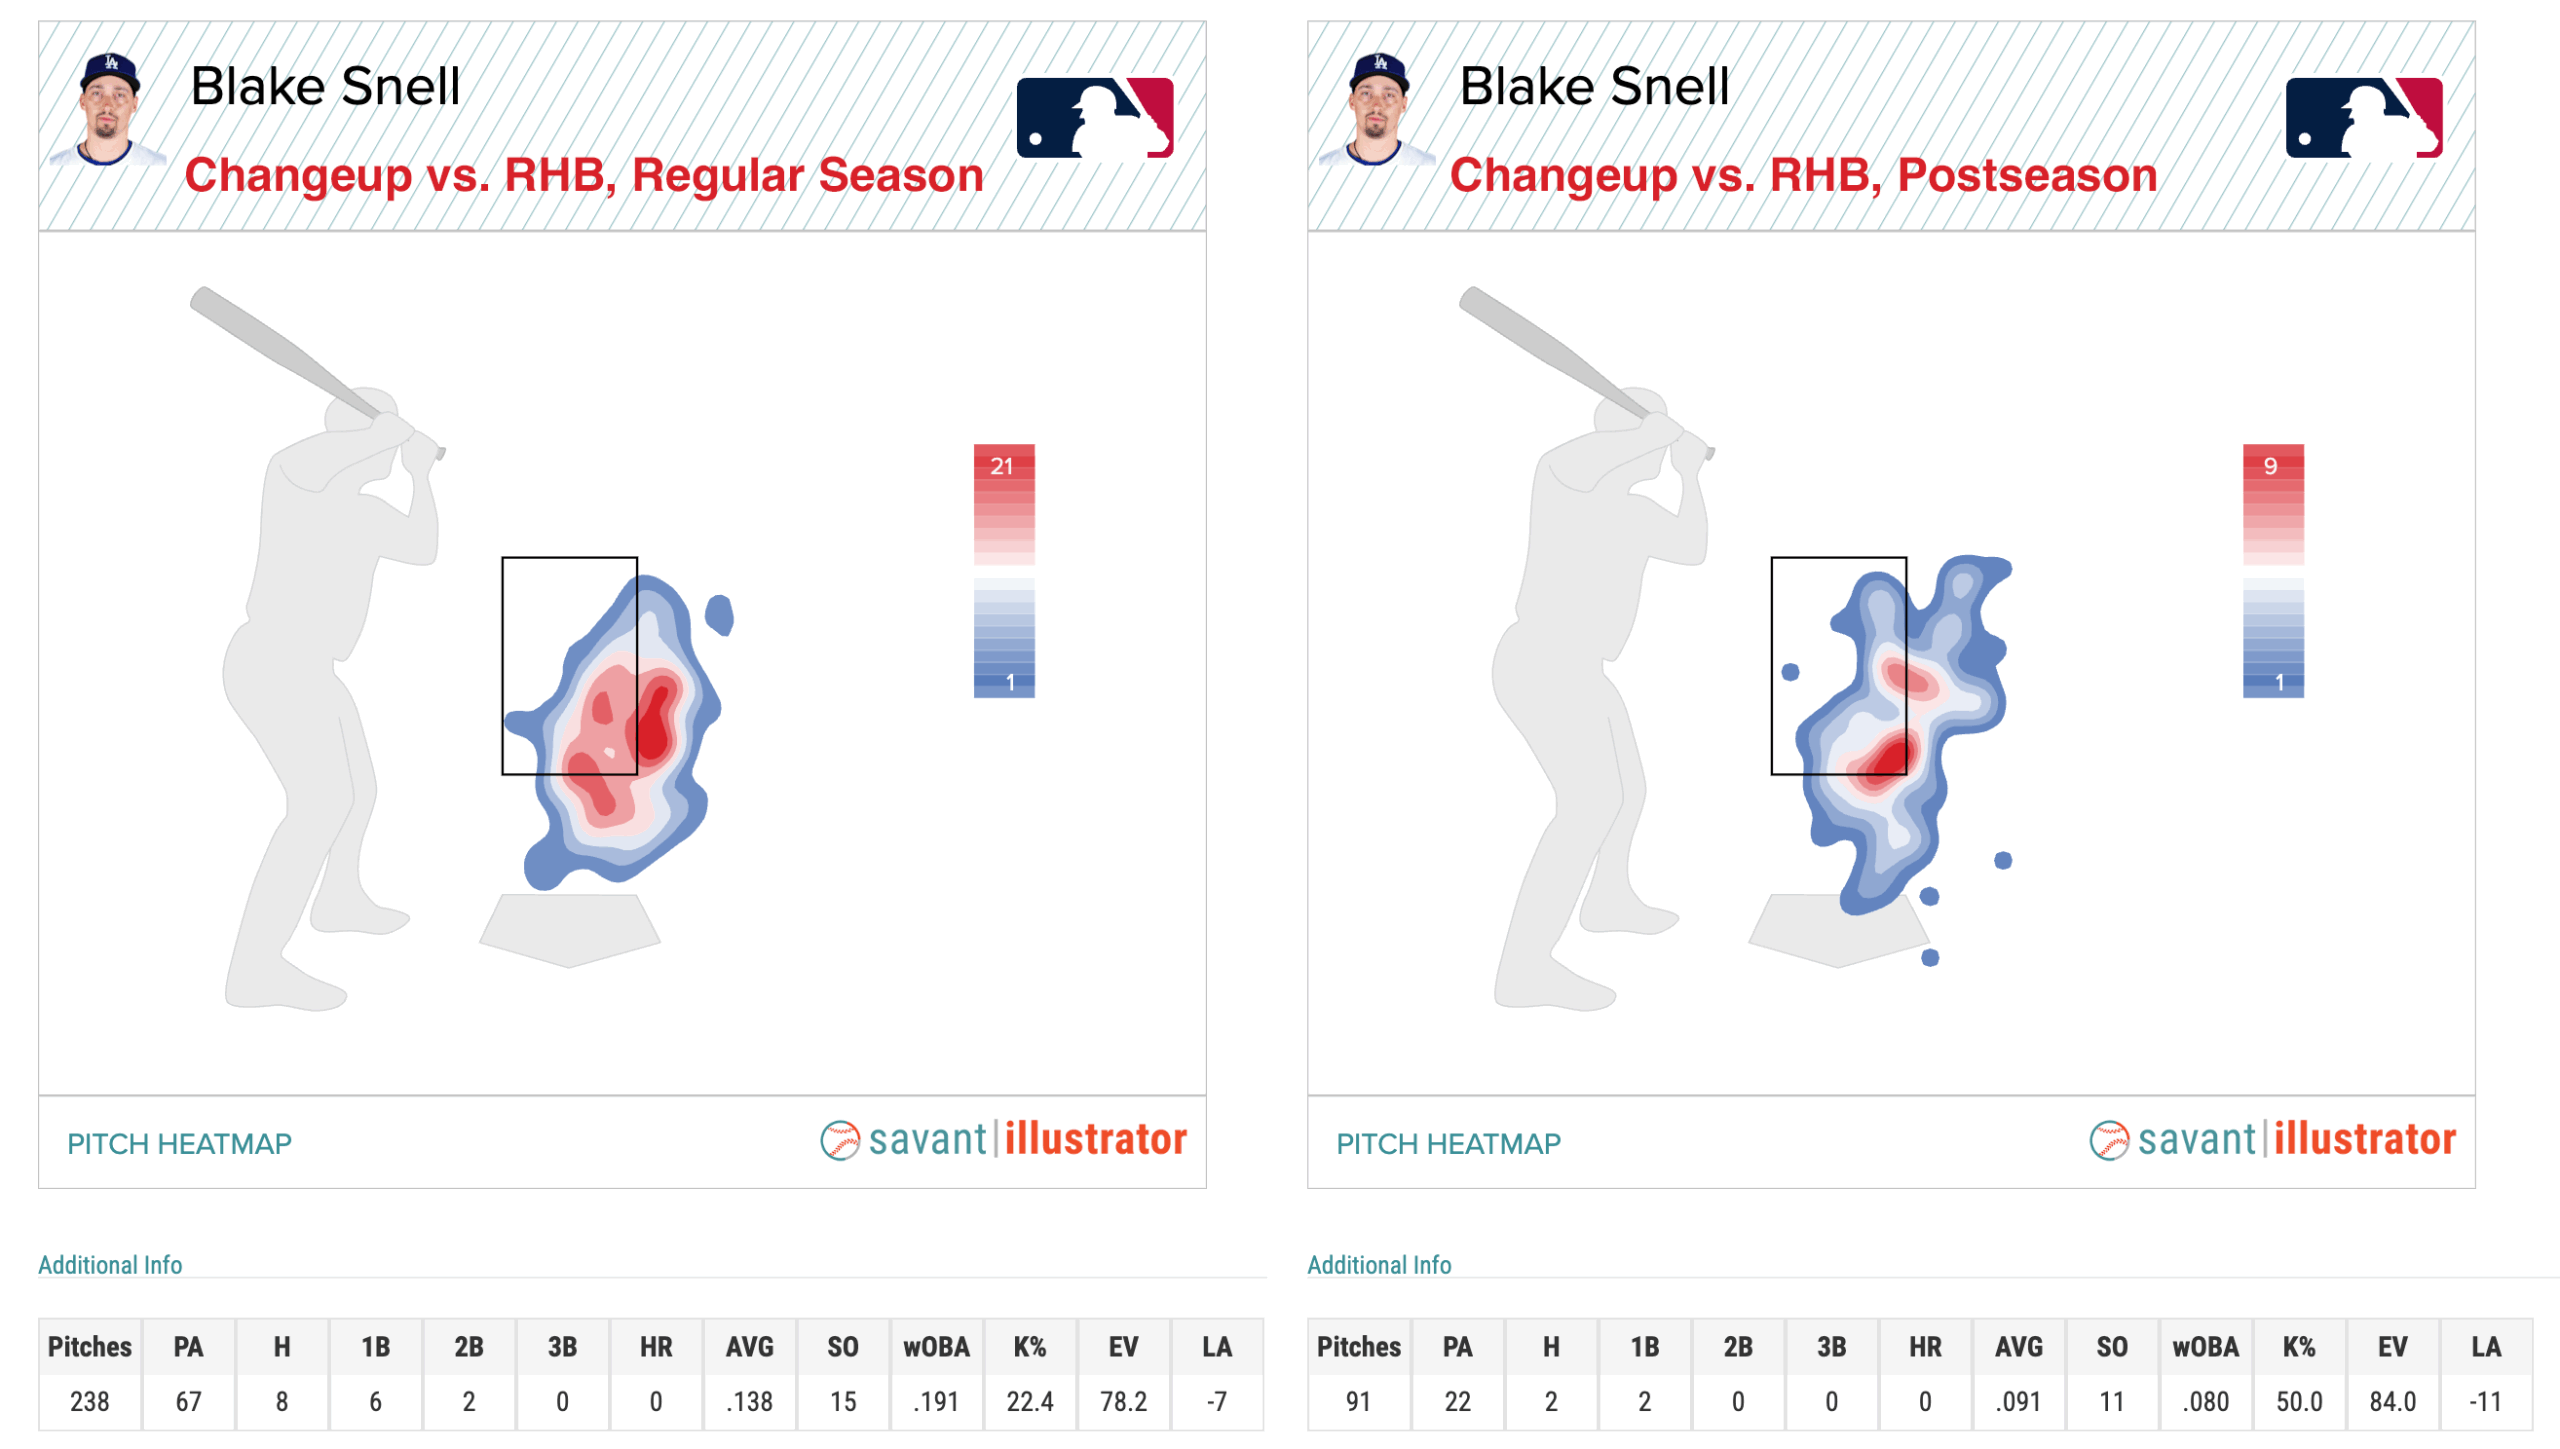
Snell is throwing his changeup in the zone far more often than in the regular season, and batters are whiffing 62.2% of the time when they swing at it. Compare the heat maps of that pitch to righties:
Neither lefties nor righties have been able to do much of anything with any of Snell’s secondary pitches when they’re in the zone — which, other than the changeup, admittedly isn’t all that often — and they’ve done less damage against his four-seamer as well. As for when he’s out of the zone…
| Pitch | Split | O-Zone% | PA | AVG | SLG | wOBA | Whiff |
|---|---|---|---|---|---|---|---|
| 4-Seam | Reg | 47.2% | 28 | .450 | .450 | .481 | 28.8% |
| 4-Seam | Post | 43.6% | 6 | .000 | .000 | .115 | 18.2% |
| Change | Reg | 62.7% | 40 | .129 | .161 | .236 | 46.0% |
| Change | Post | 51.6% | 11 | .091 | .091 | .080 | 71.4% |
| Curve | Reg | 61.7% | 28 | .091 | .136 | .200 | 70.5% |
| Curve | Post | 63.2% | 7 | .000 | .000 | .198 | 75.0% |
| Slider | Reg | 66.7% | 12 | .000 | .000 | .115 | 72.4% |
| Slider | Post | 70.2% | 6 | .000 | .000 | .230 | 50.0% |
Nope, batters also aren’t doing much against those pitches besides whiffing; they’re not even collecting fluky hits off his four-seamer when he misses as they did during the regular season.
What’s also impressive is the extent to which Snell is suppressing hard contact. After a regular season in which his average exit velocity, barrel rate, and hard-hit rate all placed in the 86th to 96th percentiles, he has shaved more than four miles per hour off his average exit velo during the postseason and has yet to allow a single barrel:
| Split | BBE | EV | LA | Brl% | HH% | AVG | xBA | SLG | xSLG | wOBA | xwOBA |
|---|---|---|---|---|---|---|---|---|---|---|---|
| Regular Season | 150 | 86.2 | 6º | 6.0% | 35.3% | .228 | .229 | .315 | .327 | .278 | .287 |
| Postseason | 39 | 81.9 | 0º | 0.0% | 25.6% | .090 | .144 | .119 | .164 | .132 | .173 |
Even Snell’s expected stats look like numbers a pitcher would put up at the plate, if pitchers still batted.
Getting back to that contact profile, one particular key to Snell’s suppression of hard contact is that he’s suddenly generating a lot more groundballs. His 48.7% groundball rate during the regular season was 6.6 points higher than his career mark, and just half a point off his career high, set during his 11-start 2020 campaign. During the postseason, his groundball rate has shot up to 69.2%, and his groundball-to-fly ball ratio has nearly doubled from 1.78 (already a career high, with usual shortened-season caveats) to 3.38. He’s done this even while postseason batters have yet to hit a single infield fly against him, and have pulled the ball with greater frequency than during the regular season (43.5% vs. 37.8%). As for where those grounders are coming from:
| Pitch | GB Reg | GB% Reg | GB Post | GB% Post |
|---|---|---|---|---|
| 4-Seam | 27 | 38.0% | 10 | 52.6% |
| Change | 29 | 65.9% | 10 | 90.9% |
| Curve | 13 | 52.0% | 2 | 50.0% |
| Slider | 5 | 50.0% | 5 | 100.0% |
Snell’s changeup was his most reliable pitch for worm-killing during the regular season, and that’s been especially true in the postseason; 10 out of 11 balls in play against the changeup have been grounders, with an average exit velocity of 84.8 mph and a -14 degree launch angle. When you consider all of his secondaries, they’ve produced an 85% groundball rate with an average exit velocity of 79.9 mph and a -17 degree launch angle.
We’ve long known that when he’s at the top of his form — such as it is — Snell is one of the game’s best pitchers; this is a man with two ERA titles to go with those Cy Youngs. This current version, though, is something else. It could all fall apart against the Blue Jays, as the tendency for any dominant pitcher to regress always looms over such small samples, and the American League champions’ aggressive, contact-oriented approach at the plate could lead to enough seeing-eye hits (or ambush home runs) to change his game plan. On the other hand, Snell’s ability to mix things up lately underscores the confidence he has in his repertoire, his command and his approach. It shouldn’t surprise us if he continues this impressive run.
Brooklyn-based Jay Jaffe is a senior writer for FanGraphs, the author of The Cooperstown Casebook (Thomas Dunne Books, 2017) and the creator of the JAWS (Jaffe WAR Score) metric for Hall of Fame analysis. He founded the Futility Infielder website (2001), was a columnist for Baseball Prospectus (2005-2012) and a contributing writer for Sports Illustrated (2012-2018). He has been a recurring guest on MLB Network and a member of the BBWAA since 2011, and a Hall of Fame voter since 2021. Follow him on BlueSky @jayjaffe.bsky.social.
Good article! Question for you, Jay: have you ever considered having a WAR5 (non-consecutive) version of JAWS as well? I ask because you originally had a 5 year (albeit consecutive) peak formula. Reason I ask is because I think the 7 year peak undersells the dominant peaks of Koufax, Felix, Stieb, Munson, Tulowitzki, etc. What are your thoughts? Thanks!
*5 year (albeit consecutive) peak formula and I think the 7 year peak…