It would be hard to call Livan Hernandez’sretirementsurprising, but some people such as myself were probably a bit taken aback because we assumed he had already retired. That is not meant as a slight. Hernandez is in his late thirties (some would say he is even older), did not pitch at all in 2013, and was dreadful when he last pitched in the majors in 2012. Our own Paul Swydan ranked Hernandez’s 2012 as one of the worst final seasons among pitchers having similar careers.
Beat writers and fans of Hernandez’s numerous teams will have all the best stories and reflections on his career. It would be hard to top Grant Brisbee’s (understandably) Giants-centric farewell to Hernandez, so I am not even going to try. But Hernandez drew attention, even late in his career, for other, non-fan-centric reasons. In 2011, Jeff Sullivan (who today [Livan Day at FanGraphs!] also posted about Hernandez and the strike zone) mentioned that Hernandez had a pretty bad slider in 2011. Yet after that same 2011 season, Swydan noted gave Hernandez an honorable mention for his incredibly slow, but amazingly curvy curve in 2011. Robert Baumann also got in on The Joy of Livan.
Rather than getting into every little statistical detail of Hernandez’ career, let’s look at three different moments from the roughly the beginning, end, and middle of his career.
Livan Hernandez is retiring, officially. Two things: Hernandez didn’t pitch in 2013. And Matt Klaassen is already writing something up about his career. Which means this is two posts about Livan Hernandez in the middle of spring training preceding a season following a season in which Hernandez was inactive. You can’t say FanGraphs doesn’t give the people what they want. The people want more content about Livan Hernandez, even if they don’t actually realize it.
This isn’t intended as a grand retrospective. I’m here to talk about one thing and one thing only, the way in which Livan Hernandez was unusual and the way in which Livan Hernandez survived. Watching him, you would’ve been justified in finding Hernandez profoundly uninteresting, and you might’ve wondered how he hung around so long. A little analysis reveals that Hernandez managed to pitch on his own terms. Everyone remembers Hernandez for the Eric Gregg strike zone. Fewer people remember that, for Hernandez, that strike zone wasn’t too far out of the ordinary.
Before Matt Harvey was hurt, he was virtually perfect. Before Matt Harvey was perfect, he was imperfect, just another talented young pitcher a bit rough around the edges. The emergence of Harvey took a few of the spotlights away from Zack Wheeler, but Harvey going down bumped Wheeler front and center. Wheeler, now, is the great hope for 2014, and should he be able to reach his lofty potential, then come 2015 one might observe one of the rarest of breeds, that being the optimistic Mets fan. Harvey’s an ace if he can come back healthy. Wheeler’s an ace if he can just polish his game. It’s exciting to root for a team with two aces.
But to be sure, Wheeler has more in common with the imperfect Harvey than with the perfect Harvey. The numbers suggest he’s still an adjustment or two away from becoming the pitcher prospect types have dreamed about. Wheeler always walked hitters in the minors, but the strikeouts were there to pick him up. He continued walking hitters upon reaching the majors, but the strikeouts were present in lesser numbers. What we can tell is that Wheeler needs to throw some more strikes. Another thing we can tell is that that statement deserves an asterisk.
One of the many rites of the baseball offseason is the publication of minor league prospect and organizational rankings. It’s my turn to take a swipe at this process, and I’m going to take a little bit of a different tack. The organizations will be ranked from top to bottom, and a key word that you will see over and over again is “impact”. Each team’s inner core of impact prospects – those that project as likely above average major league regulars – will drive each team’s ranking, though the number of non-impact regulars and the system’s total number of viable future big leaguers will also play a role. Today, systems 16 through 30.
Below, each team will have a brief section, containing the following information:
– IMPACT – The number of impact prospects currently in the system, followed by their names in alpha order, with top-tier impact guys in ALL CAPS.
– Other 2013 Impact – A listing of other players on the team’s prior year impact prospect list, with the positive (in the majors) or negative (downgraded prospect status) reason they are no longer on the impact list.
– Strength/Weakness – Self explanatory
– Depth Ratio – The number of total viable MLB prospects in the organizations divided by the average number of viable prospects in a system.
– One I Like More – A prospect I like more than the industry consensus, and why.
– One I Like Less – A prospect I like less than the industry consensus, and why.
– Observation – One takeaway, big-picture thought on the organization at this moment in time.
Billy Heywood never actually managed the Minnesota Twins. Billy Heywood was a movie character, the titular character from the movie Little Big League. When you think about it, he was technically more of a manager than any of us will be, in that he got to wear a uniform and sit in actual major-league dugouts. The idea behind Little Big League is that Heywood is bequeathed the Minnesota Twins from his grandfather. The Twins stink and Heywood decides to fire the manager and instill himself into the position. The Twins start winning and all the players and Heywood himself find out a lot about themselves in the process. It’s a fairly dumb movie.
We are still quite a ways away from quantifying just to what extent a manager can affect a team, and perhaps further away from quantifying to what extent a manager who is a child can affect a team. There are so many variables, so many anecdotes from players about how managers can influence a winning attitude, that we really can’t put a number on most things. Some we can, like bunting, since a manager is largely responsible for calling those plays. He’s also responsible for initiating intentional walks.
Intentional walks are perhaps less of a lightning rod in our community than something like sacrifice bunts, but there is still a general idea that intentional walks are largely unnecessary, and can even be counterproductive at times, since they are allowing one of the things teams do not want — opponents on base. But as it happens, managers — or perhaps others in front offices that influence managers — appear to be getting smarter about intentional walks.
Foremost, a note on the research. I looked at play-by-play data from 1974 forward, the period in which we have the most accurate data of that kind. Obviously, this only entails an official four-finger, standing catcher type of intentional walks. There are certainly times when pitchers intentionally pitch around a player, but that isn’t really something we can look up definitively.
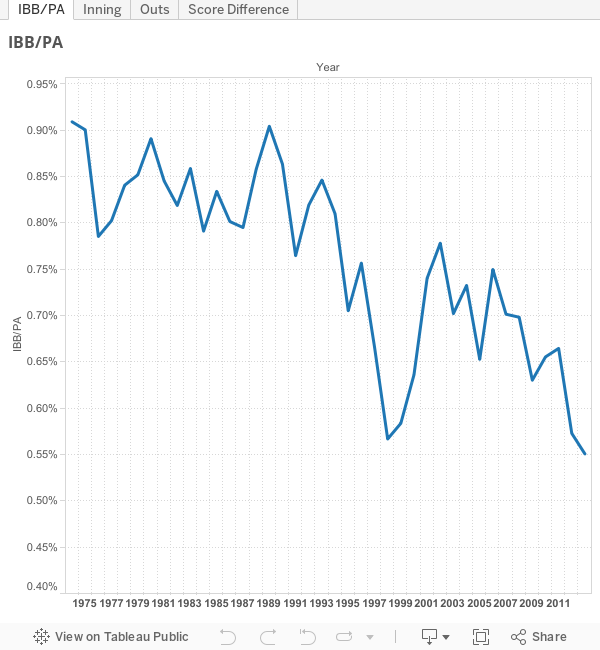
The first chart shows simply intentional walks per plate appearance. There was a sharp drop in the 90s, followed by a large spike in the early 2000s. The easy answer for that spike is that it was a reaction to the power surge showing among hitters that began in the late 90s — managers simply thought it to be more beneficial to put the big sluggers on base rather than have them hit. This, of course, culminated in 2004 when Barry Bonds was intentionally walked 120 times, accounting for almost 9% of the total intentional walks that year. We don’t know if that’s the reason for sure, but it seems like a fairly good bet. Nevertheless, that craziness has subsided, and we now see that IBB levels have leveled off back to the levels seen in the late 90s.
But something else has also happened, as the dirty cheaters who clicked on the other tabs have already figured out. Intentional walks are being used in more high-leverage situations than ever before. They now occur with more outs, tighter scores, and in later innings.
Without breaking down each base/out scenario, we can make a broad statement that intentional walks, if they make sense at all, usually make more sense in the later innings. Walking guys in the fifth or sixth is fairly poor strategy, in fact. Right now, we see that the average IBB happens in the 7th inning, and that is probably skewed a little low thanks the the NL’s always-make-the-pitcher-hit strategy.
More outs when putting a guy on is also a good thing — two outs being ideal, of course — since giving a free pass with fewer outs can lead to more runs for the batting team. In 2013, major league teams were averaging 1.5 outs when issuing a free pass. This ostensibly means that just as many teams issued a free pass with one out as they did with two. And while it’s historically high, that number hasn’t fluctuated all that much since 1974. Teams still need to work on this a bit, it seems.
The average score difference — about 1.38 runs in 2013 — is also trending downward, meaning the managers are using intentional walks when the games are closer. This also points to high-leverage usage. Teams are looking to keep the game close, or maintain their slim leads by bypassing the other team’s biggest threats. On the whole, if you’re going to just walk a guy, that’s probably the best time.
Without getting incredibly granular, it’s hard to make a mountaintop-worthy announcement that teams are figuring out how to use the intentional walk properly. There’s more research to be done here.We do know that the overall frequency of the IBB is down, which is good. We also know that when they do happen, they are happening in higher-leverage situations than five, ten, or 15 years ago. This is almost certainly good. I don’t remember if Billy Heywood every issued an intentional walk, but the fact that he was supposed to exist in a world just like ours save for the fact that a kid ran a baseball team, it seems safe to say he probably did. He may have done it in the fifth inning of a game his team was winning with one out and a man on. If so, that would have been a poor move. He may get a pass because he was 12 years old. Perhaps a petition campaign to teach run expectancies in elementary school is in order.
As perhaps indicated by the piece I published here in the fall concerning the relationship between scouting grades and wins, one of my particular interests — and, I would argue, one of the more compelling frontiers of baseball research currently — is the examination of how a prospect’s scouting profile relates, in a concrete and objective way, to the production that might be expected of him at the major-league level. My assumption is that many, if not all, professional organizations have a means by which to assess such a thing — perhaps some in a less, others in a more, formal way. The bonuses they extend to amateur players indicate that some manner of valuation exists. For the public, however, the process by which such valuations are established is rather opaque.
The intention of this post is to add very, very slightly to the extant body of research on this topic. It (i.e. this post) has its genesis in a pastime that probably won’t be unfamiliar to the reader — namely, flipping through the pages of a Baseball America Prospect Handbook (a text with regard to which I’ve documented my emotional emotions elsewhere). As the reader will probably know, for each organization, the editors of Baseball America identify which prospects within that organization feature the best of this or that tool: Best Hitter for Average, Best Power Hitter, Best Strike-Zone Discipline, etc.
Around the start of the offseason, there was talk that Nelson Cruz was after a $75-million contract. He eventually settled for $8 million. At the same time, there was talk that Ervin Santana was after a $100-million contract. He’s now settled for $14.1 million. Put those numbers together and you have $175 million requested and $22.1 million received. That difference of $153 million is the amount for which the Yankees signed Jacoby Ellsbury. So, that’s some perspective.
Santana reached a one-year agreement with the Braves Tuesday, and it became official early Wednesday. Over the weekend, all the talk was about how Santana would be choosing between the Orioles and the Blue Jays, but then the Braves developed a desperate need, with Kris Medlen preparing for probable Tommy John surgery. In need of a starting pitcher, the Braves signed pretty much the only available free-agent starting pitcher, and so Santana will pitch in the National League for the first time in his career. Probably, that’s a big reason why he made the decision he did.
Watching the Braves rotation grab appendages has been tough this spring. Kris Medlen has ligament damage in his elbow, Brandon Beachy has biceps soreness, and Mike Minor survived a scarred urethra only to encounter shoulder soreness. None of the three is a lock to make the opening day rotation. And this is a team that brought two veteran free agents in for depth and had extra youth at the back end of their rotation. They might be fine without Ervin Santana, but yet that team does inspire a question. How many major-league ready starting pitchers should a competitive team field in a given year?
One of the annual rites of baseball’s offseason is the publication of top prospect lists, organizational rankings, etc.. Over the next few days, my own personal rankings of each team’s minor league systems will appear here on FanGraphs. First, though, I’m going to give you a feel for the methodology – and some of the philosophy – behind them.
Baseball talent evaluation is unique in many respects when compared to the other major sports. An amateur scout can be looking at players ranging anywhere from 16 to 23 years old, and has to somehow put those players into a singular context to justify an organization’s investment in them. With virtually no exception, no amateur player can compete at the major league level without navigating at least part of a minor league system consisting of six or seven levels, excluding the Latin American rookie leagues. Football or basketball draftees, even if they are leaving college early, must compete for NFL or NBA spots immediately – if they can’t, they stay in school, or don’t get drafted. In baseball, there is projection to take into account, or lack thereof. A scout is given a radar gun and a stopwatch to capture the measurables, but it’s his mind, his entrepreneurial spirit and his gut that sells him on the players he recommends, signs, and – hopefully – watches progress toward the major leagues.
There’s a pretty strong and obvious relationship between speed and baserunning. Speed is best demonstrated when running, and “baserunning” has “running” right in the word. There usually isn’t very much interesting to say about a fast guy who runs the bases well. Likewise, there usually isn’t very much interesting to say about a slow guy who runs the bases poorly. It’s more uncommon to hear about a fast guy with baserunning limitations, but we can make sense of that — baserunning skill isn’t 100% footspeed. Speed’s just a component, along with instincts and awareness and reaction time.
But it’s a major component. Not all good runners will be good baserunners, but it feels like all good baserunners should be good runners. Check out the top of last year’s baserunning value leaderboard. Jacoby Ellsbury is a good runner. Rajai Davis is a good runner. Eric Young, Elvis Andrus, Mike Trout, Alcides Escobar — all these guys, good runners. An almost infallible rule is, you need to be able to run pretty well to be able to run the bases pretty well. But note that I had to throw an “almost” in there. And I had to throw an “almost” in there on account of Daniel Murphy, baseball’s premier player with speed without speed.