2010 Disabled List: Injury Locations
In a couple of previous articles, I looked at the 2010 disabled list data for all the teams and player positions. I have finally gone through and compiled the data on body part locations.
Last year Josh Hermsmeyer compiled an injury database with 2002 to 2009 DL information. In it, he set a format for selecting the various body parts. I have gone ahead and used the same categories. I have made another spreadsheet (Sheet 2) with these various designations for people to use. I will format the 2010 injury information so it can be combined with Josh’s data once the new retrosheet data set is released after the playoffs are completed.
To make the body location data easier for interpretation, I have combined Josh’s categories into a few broad categories:
Arms and Hands – hand, wrist, forearm, upperarm
Elbow – elbow
General – generalmedical
Hip – hip
Legs and Feet – ankle, foot, knee, thigh, lowerleg
Neck and Head – face, head, neck
Shoulder – shoulder
Trunk – upperback, back, chest, abdomen
First, here is the injury location data for total days and trips for pitchers and hitters to the DL:
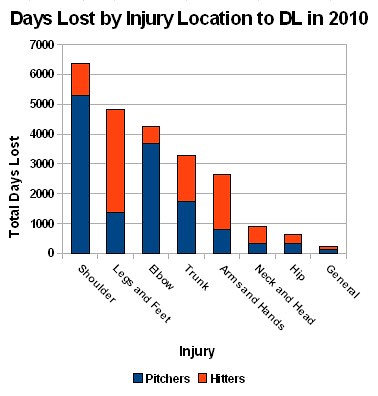
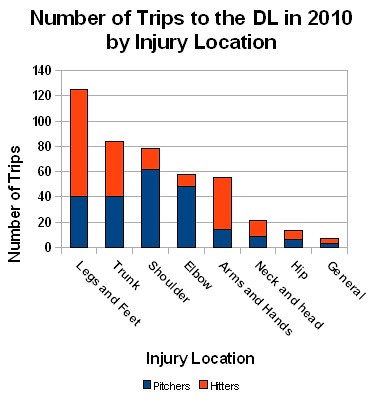
No real surprise here with pitchers dominating days lost to elbow and shoulder injuries and hitters mainly having injuries to their arms and legs.
Finally, here is a comparison of the average number of days lost for pitchers and hitters.

Pitchers take longer to get off the DL, excect for hip and general injuries. Well that is it for today. My next project is a little more ambitious as I want to find the chances of a player going on the DL knowing a set of conditions (i.e. previous injury history, age, etc).