Daily Graphing – Brandon Backe
I'm sick of hearing how baseball playoff games are too long. If it were up to me, game 3 would still be in progress right now (that would put them right around the 48th inning). I wonder who would be pitching in the 48th inning of a game, perhaps Ozzie Guillen? In any event, Brandon Backe will take the mound tonight in game 4 of the World Series as the Astros try to avoid a White Sox sweep. He actually pitched pretty well in his last start, giving up only 2 hits in 5.2 innings while striking out 7 and walking 3. Looking at his season as a whole he's been incredibly inconsistent.
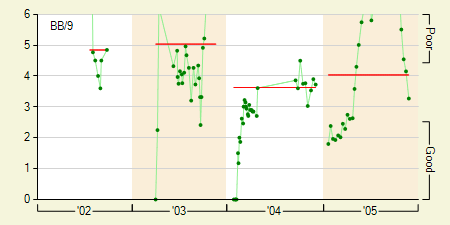
Taking a look at his walks per 9 innings, things started off quite well for Brandon Backe, but then he literally went off the charts. This is not a good thing on the walks graphs. He had thrown 1,050 pitches on the year before he went on his walk frenzy. Guess how many pitches he threw the entire year before? 1,102. That was the most he had ever thrown in the majors and it was over the course of an entire season. Now he had equaled that total in just 2 months. After he went on the DL with a strained rib cage and missed all of August, he seemed to get his walks under control again.
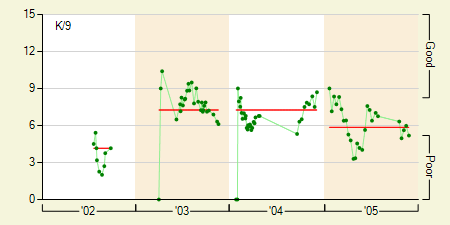
Unfortunately, the same cannot be said about his strikeouts per 9 innings which has drifted down the entire season. All signs point to him being a little overwhelmed with his workload. It will be interesting to see if Brandon Backe can build up the durability to be able to pitch a consistent 200 inning season.
David Appelman is the creator of FanGraphs.