Hitters Are Losing More Long Plate Appearances

Offense is up this year. That’s partly the result of more home runs due to a baseball with less drag. It’s also due in part to the bevy of new rules; while the shift ban hasn’t quite returned us to the golden age of groundball singles, it has at least increased BABIP over recent years, and the bigger bases and pickoff rules have revamped the running game.
However, one major rule change with an as-of-yet undetermined impact on offense remains: the pitch clock. As my colleague Ben Clemens pointed out in the article on rule changes linked above, the impact of clock violations has been minimal. While the clock has likely contributed to the barrage of stolen bases, as the pitcher has less time to divvy up their attention between the hitter and the runner, it’s difficult to separate its effects from those of the disengagement limits. One fear that has been batted around is that the decrease in time between pitches is putting more stress on pitchers’ arms; having to rear back and deliver a pitch every 15 seconds without the opportunity to catch your breath whenever you need to can tire muscles out quicker and lead to a mechanical breakdown. But while the injury data is inconclusive so far, there’s another measurable area in which the impact of throwing pitch after pitch with little respite could show up: long plate appearances.
I limited my scope to PAs that ranged from one to 10 pitches because there simply wasn’t enough data for longer trips to the plate. Even this year, hardly a third of the way through, we have at least 100 PAs of each length, though the shorter PA lengths number in the thousands. I also excluded intentional walks. To kick things off, grouping by PA length, I compared this season’s wOBAs to each of the last two seasons:
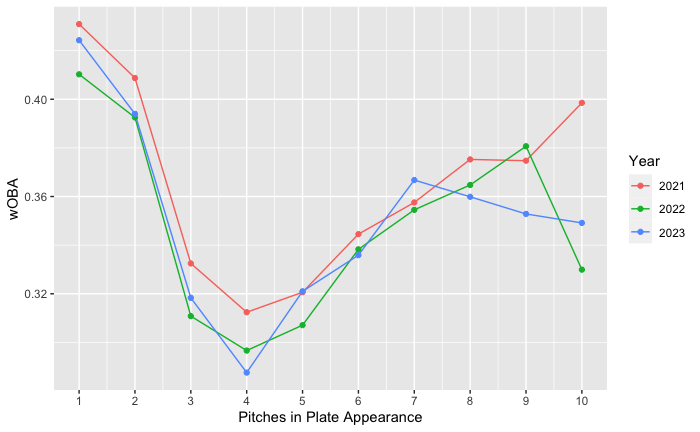
The curves’ shapes are pretty similar, though 2021 jumps out to an early lead before falling back to Earth. This is largely because, after an initial peak and downturn, there was another local maximum for this year’s curve at the seven-pitch plate appearance mark. Last season’s curve didn’t have that maximum until the nine-pitch mark; 2021 didn’t have it at all.
But before I dive into what that might mean, let me reassure you of a couple of things. First, we can control for the fact that certain types of hitters tend to end PAs on the first pitch more than others who might prefer to run up a hurler’s pitch count. For each PA length, I created a weighted average of how well each hitter performed in PAs of other lengths. For example, for every five-pitch PA, I recorded the hitter’s wOBA on PAs of every length except five. Then, I took the average of those wOBAs; I say it’s “weighted” because certain hitters, who had more five-pitch PAs, contributed to the average more than others. This should limit the impact of hitters who had small samples sizes for the PA length in question. Additionally, I limited my sample to hitters with at least 500 total plate appearances in each of 2021 and ’22 and 170 this season (since we’re just over a third of the way through). Lastly, I subtracted the weighted average of wOBAs on non-five-pitch PAs from wOBAs on five-pitch ones. All of that work produced curves with very similar shapes as the ones above:
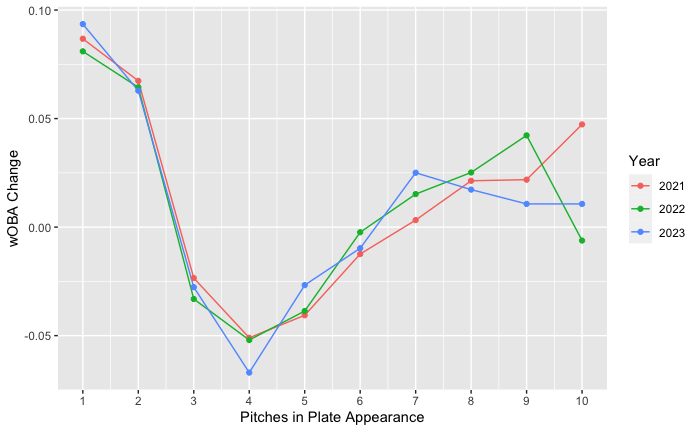
The differences across seasons for shorter PAs all but disappeared, and though the scales on the two graphs are different, the change is notable given that the differences for longer PAs remained the same.
As I alluded to, one more thing left to control for was the difference in run-scoring environment across seasons. To account for this, I looked at the same wOBA changes as above but as a percentage of the wOBA for the PA length in question. For five-pitch PAs, this meant dividing the wOBA change above by the wOBA on five-pitch PAs, and then multiplying by 100:
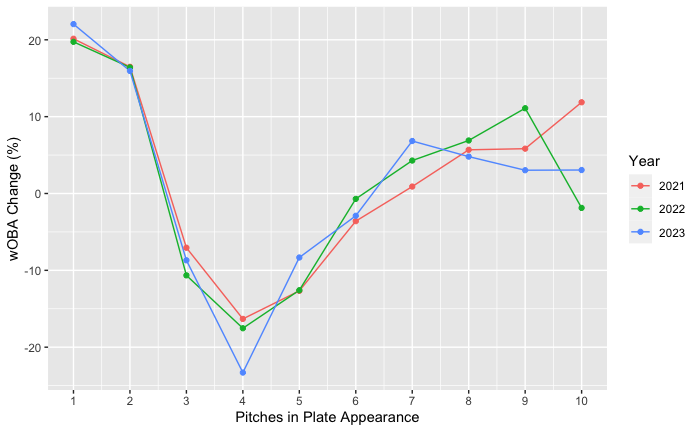
Little change here. So what does this all mean? Well, hitters have the advantage when they put the ball in play on the first or the second pitch, and there’s a massive dropoff once the possibility of a strikeout arises at three pitches. wOBA doesn’t really re-approach average (i.e., a wOBA change of zero) until you get to six pitches, which is where you have a bunch of full counts and hitters who have fouled off a few. Each of the past two years, wOBA has continued rebounding or stayed level through at least nine-pitch PAs. This year, however, the rebound surges at seven pitches and then stops.
Maybe too much emphasis is being placed on the fitness of pitchers. How do batters stack up when they have to make swing after swing with little time in between? To see if this was the cause for this year’s hitting downturn in long PAs, I looked at wOBA by the number of swings in a plate appearance. I didn’t go through my whole wOBA-percentage-change process again since it didn’t move the needle much, and because frankly, it broke my computer and brain:
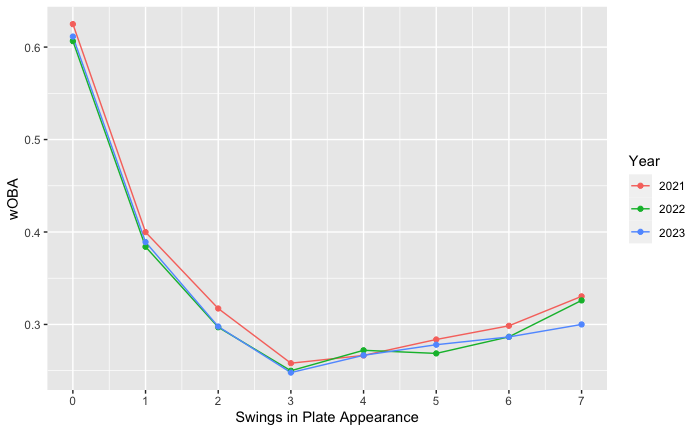
I only went up to seven-swing PAs because the sample sizes shrunk too much beyond that. There aren’t any major differences visible here, but maybe this isn’t the right way to think about swings; after all, this isn’t measuring the effectiveness of the nth swing in the PA, just the ultimate outcome of the PA.
To hone in on just how effective each swing was, I looked at whiffs per swing. Hitters actually appear to be missing less often after piling up swings this year:
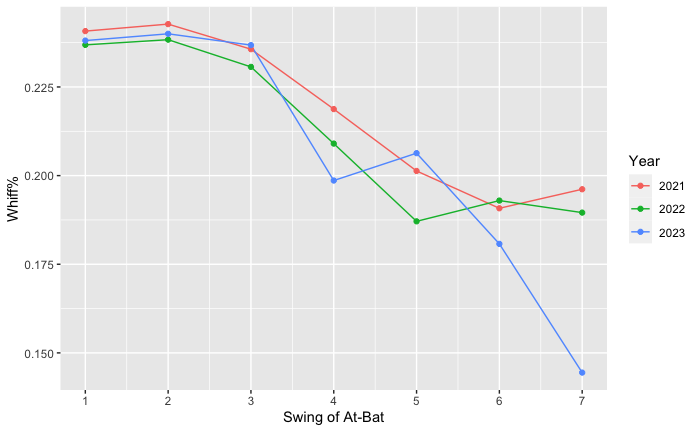
But their whiff rates are higher when we go back to grouping by pitch number, specifically after that wOBA peak at seven-pitch plate appearances from before:
| Season | Whiffs/Swing (<7 pitches) | SwStr% (<7) | Whiffs/Swing (>=7) | SwStr% (>=7) |
|---|---|---|---|---|
| 2021 | 24.0 | 11.3 | 17.4 | 12.4 |
| 2022 | 23.6 | 11.2 | 17.0 | 12.3 |
| 2023 | 23.7 | 11.1 | 18.3 | 12.9 |
This makes me think that it’s less a matter of fatigue and more a matter of focus. Hitters typically have shorter bursts of action than pitchers; hurlers routinely rack up double-digit pitch counts in an inning, and a long PA won’t do much to change that, but it isn’t every day that a hitter has to battle through a 10-pitch PA. That wears on your mind just as much as your body.
Pitchers still control the action, and while they do have more violations than hitters, their clock-aided gamesmanship is only improving. On the other hand, it seems to me that far less emphasis was placed on how hitters can use the clock to their advantage; making use of their one timeout is paramount to helping them re-focus. With the caveat that I didn’t distinguish between runners-on and bases-empty situations, an avenue for future research given the differences in the clock across those scenarios, I imagine that with more reps hitters will have an easier time keeping their head in the game in this new era and continue to boost offense this year.
Stats are as of end-of-day May 31.
Alex is a FanGraphs contributor. His work has also appeared at Pinstripe Alley, Pitcher List, and Sports Info Solutions. He is especially interested in how and why players make decisions, something he struggles with in daily life. You can find him on Twitter @Mind_OverBatter.
Whoa great work. This is exactly the opposite of what I thought was happening.
Thanks! Me too to be honest – that’s how you know I didn’t fudge the numbers!