How the Same Defense Helps One Pitcher and Hurts Another
Freddy Peralta is having arguably the greatest season of his excellent eight-year career. The right-hander has ridden a career-best 2.69 ERA to a career-high 16 wins. However, I used the word arguably for a reason. Peralta’s 3.64 FIP is just the fourth best of his career, and his 3.93 xFIP is tied with 2024 for his fifth best. There’s a gap of 0.95 runs per nine innings between his FIP and his ERA. When you multiply that times his actual innings total of 163 2/3, FIP thinks he should’ve given up just over 17 more earned runs than he actually has allowed. None of this is surprising. Pitchers underperform or overperform their peripherals all the time. The interesting thing is that Statcast says that no pitcher has benefitted as much from the defense behind him as Peralta. When he’s has been on the mound, the Brewers defense has been worth just under 14 fielding runs. It’s neither this simple or this clean-cut, but it’s easy to combine these two numbers and make an inference: Defense can explain more than 80% of the difference between Peralta’s FIP and ERA.
On the other end of the spectrum is Peralta’s teammate Brandon Woodruff, who returned from shoulder surgery in July and has gone 6-2 over 11 starts and 59 2/3 innings. He’s posted a 3.32 ERA, 3.26 FIP, and 3.40 xFIP. In other words, FIP thinks Woodruff has gotten exactly what he’s deserved. However, Woodruff’s xERA is a scant 2.27. When you combine all those numbers, it means Statcast thinks several batted balls that should have resulted in outs instead fell in for non-homer base hits. The difference is a bit over six runs. Coincidentally or not, Statcast says the Milwaukee defense has been at its worst behind Woodruff, costing him just under five runs, once again just about 80% of the gap between an ERA estimator and his actual ERA.
That’s why we’re talking about Peralta and Woodruff. No two teammates have a bigger gap between the fielding run value of the defense behind them. It’s nearly an 18-run gap! It’s jarring. With 26 FRV, Statcast thinks the Brewers have the fourth-best team defense in the game, but somehow none of that brilliance has been shining on Woodruff. We’re going to use Statcast data to break down, as best we can, the reasons behind it. Hopefully, the comparison will show the various ways a team can provide defensive value. Let’s start with the catching numbers.
| Pitcher | Pitches Taken | Framing | Throwing | Blocking | Total FRV |
|---|---|---|---|---|---|
| Freddy Peralta | 1,529 | 4.6 | -0.7 | 1.1 | 5.0 |
| Brandon Woodruff | 444 | -0.1 | -0.3 | 0.0 | -0.5 |
Brewers catchers have been just a bit below average with Woodruff on the mound. There’s nothing particularly notable there. When Peralta has been on the mound, however, they’ve been at their best. He’s gotten a ton of help in the framing and blocking departments. Why has Peralta gotten so much framing help? Let’s start with who’s doing the catching. The first column shows how each catcher’s framing has graded out this season. The next two columns show the percentage of each pitcher’s takes (that is, pitches where the umpire has had to either call a ball or a strike) they’ve caught.
| Catchers | Framing Runs | Peralta% | Woodruff% |
|---|---|---|---|
| William Contreras | 3 | 82 | 70 |
| Danny Jansen | -7 | 14 | 11 |
| Eric Haase | 0 | 4 | 19 |
Peralta has gotten to throw to William Contreras more than Woodruff, and Contreras is the only catcher on the team with good framing numbers.
Next, we need to note that Contreras was doing a better job of framing earlier in the season, when Woodruff was still recovering from his surgery. Contreras was worth six framing runs from March through July, but in August and September, he’s been worth negative three. Any number of factors could be at play here. It’s a long season. He could just be a bit nicked up. He could be drained from the daunting task of catching Jacob Misiorowski’s scattershot 103-mph fastballs. Whatever the reason, Woodruff wasn’t around when Contreras was doing his best framing.
The second factor is that the areas of the plate where Contreras is strongest line up a bit better with Peralta’s pitch locations. The visual below shows three heat maps. The one on the left shows pitch locations when Peralta throws the ball in the shadow zone – the area within one baseball’s width of the edge of the plate, where catcher framing happens. The one in the middle shows Woodruff’s locations, and the one on the right shows Contreras’ strengths as a framer this season.
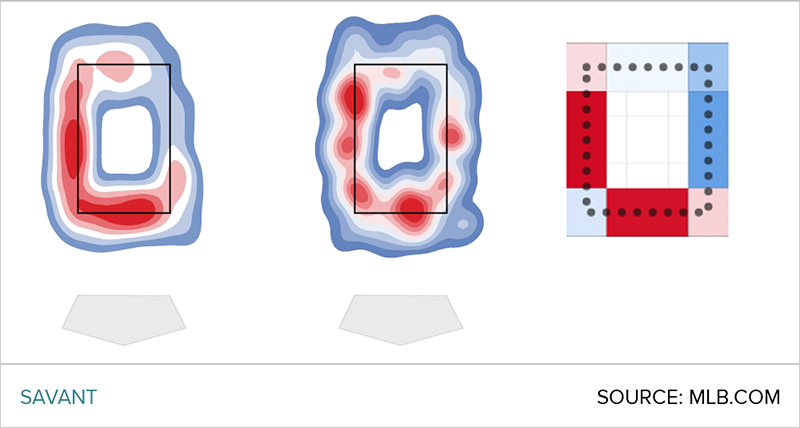
Woodruff and Peralta are pretty similar, missing most frequently at the bottom of the zone and to their arm side. Those two spots are also where Contreras is at his best. However, you’ll notice that when Woodruff is on the edge of the plate to the arm side, he tends to miss near the corner, either high or low, where Contreras isn’t as great and where strikes are harder to come by anyway. Lastly, Woodruff also tends to miss on the edge to his glove side too, the spot where Contreras is at his absolute worst.
I’m sure there are other factors at play here, and all these differences are subtle — Peralta has thrown to Contreras more, and he got to pitch to Contreras earlier in the season when the catcher was on his game from a framing perspective; Peralta has also hit the edges of the zone in areas where Contreras tends to be a better framer — but when you put them all together, you can see how Peralta could end up with a significant advantage. Now let’s get into the balls in play.
| Pitcher | Non-HR BIP | FRV | Range | Arm | DP |
|---|---|---|---|---|---|
| Freddy Peralta | 397 | 7.7 | 6.1 | 0.8 | 0.8 |
| Brandon Woodruff | 140 | -4.3 | -3.6 | -0.1 | -0.6 |
In every single category, Peralta has received help from his defense, while Woodruff has been let down. We can get even more granular, though, which is always something you like hearing when you’re already 1,000 words into an article. Let’s start with batted-ball tendencies. This season, the Brewers have graded out as positive defensively at first base, shortstop, center field, and right field. They’ve graded out negatively at second base, third base, and left field. Now take a look at the two pitchers’ balls in play. Once again, Peralta is on the left and Woodruff is on the right.
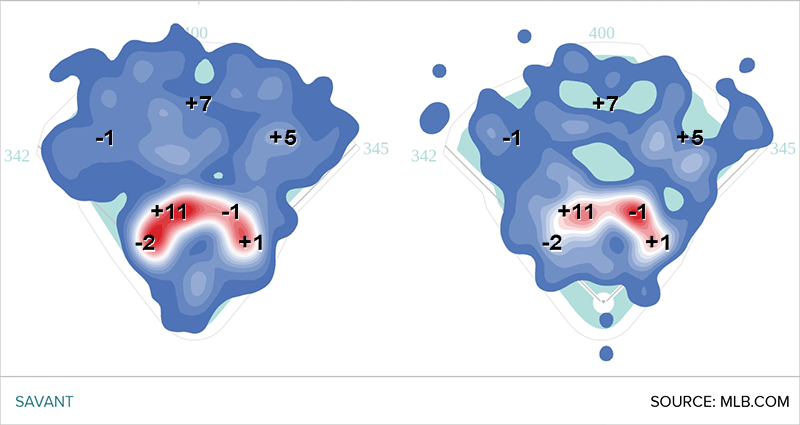
As you can see, Peralta throws more pitches that are hit to the spots where the Milwaukee defense is the best. His grounders go to the left side of the infield, where the defense has been much better. He’s induced more balls to center and fewer to left. So far, 39.2% of Woodruff’s balls in play have gone to second, third, and left, compared to 35.9% for Peralta. It sounds like a small difference and it is, working out to roughly half a batted ball per start. But as we’ve seen so many times, those small factors start to add up. Once again, the date compounds them further. Here’s how the Brewers infield and outfield have graded out by month.
| Mar/Apr | May | Jun | Jul | Aug | Sep/Oct |
|---|---|---|---|---|---|
| -6 | 8 | 11 | 6 | 5 | -3 |
This is yet another area where Woodruff missed most of the good times. After an ugly start in April, the Brewers were at their best in May, June, and July. They were worth 17 runs before Woodruff debuted on July 6, and they’ve been worth just four since. The biggest difference has come in the outfield. Milwaukee outfielders put up 12 FRV before Woodruff’s season debut, but just one after it. That’ll happen when you lose Jackson Chourio to a hamstring injury and Garrett Mitchell to a shoulder injury. Peralta spent much more time pitching in front of those excellent defenders, while Woodruff has spent more time pitching in front of Isaac Collins and Blake Perkins, whose numbers have been worse. As you can see, the only position where Woodruff has seen better defense is center field, and it’s by a whopping 0.19 runs.
| Position | Peralta | Woodruff | Difference |
|---|---|---|---|
| 1B | 1.6 | -1.5 | 3.1 |
| 2B | 0.0 | -0.5 | 0.5 |
| 3B | 0.4 | 0.3 | 0.2 |
| SS | 3.1 | 0.2 | 2.9 |
| LF | 1.5 | -1.6 | 3.2 |
| CF | -0.4 | -0.2 | -0.2 |
| RF | 1.4 | -0.9 | 2.3 |
The biggest differences have come at first base, left field, and shortstop. Joey Ortiz and Andruw Monasterio have split time at shortstop for both pitchers, and it’s not as if the pair has been bad when Woodruff is on the mound. They just haven’t had as many chances to show off their skills. Woodruff has allowed 17 balls to shortstop, and 16 of them have resulted in outs. Joey Ortiz did get one ball stuck in his glove for a moment, turning a would-be double play into a fielder’s choice. The one single came off the bat of Vladimir Guerrero Jr., and it was sort of a freaky play.
Nobody’s to blame here (except maybe the third baseman), but this gigantic hop cost Woodruff a run. The bigger difference, though, is that he hasn’t been on the mound for any plays like these:
All those great plays by Ortiz came with Peralta on the mound. There’s surely some luck involved, but mostly it’s that he’s pitched more innings and induced more balls to short, giving Ortiz’s talent a better chance to shine.
Woodruff has only pitched with Andrew Vaughn at first base, while Peralta has pitched with Vaughn, Rhys Hoskins, and a couple times Jake Bauers at first. None of these players is an incredible defender, but Hoskins has graded out better than Vaughn this season. Still, Woodruff has only allowed 12 batted balls to first base all season. Ten of them were either popouts or groundouts. Here are the two plays that went awry:
This is some serious bad luck, for both Vaughn and Woodruff. That first play is a bullet that left Ian Happ’s bat at 106.9 mph. Vaughn is playing shallow because he’s holding the runner on first base. He dives and deflects the ball behind the second baseman, who ends up sprinting in the wrong direction entirely. Yes, a better defender fields that ball cleanly and starts a 3-6-3 double play, but it’s certainly not an egregious misplay.
The second play is even unluckier. Vaughn fields a routine grounder and turns to second to start a double play, but both the second basemen and shortstop are covering the bag. Vaughn’s throw was maybe a bit off-line, but it’s hard to blame him in this situation, and it’s far from certain that even a perfect throw would’ve been caught after the middle infielders bonked into each other. So this goes down as a throwing error, but it’s pretty much the entire defense letting Woodruff down.
That’s what happens when you don’t play as much. Small samples give you unbalanced results. Even though the Brewers have been worse defensively later in the season, the handful of bad plays weighs more heavily.
We could have done this analysis with any two pitchers. Every pitcher has different tendencies, which will either help them or hurt them depending on the catcher, the defense behind them, and the ballpark they’re pitching in. It’s fun to see a pair that diverges so widely on the same team (though I’m sure Woodruff would beg to differ). It helps to illustrate just how much can change simply because of timing, injuries, deadline deals, batted-ball tendencies, and pure happenstance. Baseball is a complicated game, and things tend to balance out over time, except when they don’t.
Davy Andrews is a Brooklyn-based musician and a writer at FanGraphs. He can be found on Bluesky @davyandrewsdavy.bsky.social.
This is a really insightful article, and I don’t mean to take away from that, but I think it’s a mistake to look at the FRV behind each pitcher and compare that to the gap between ERA and ERA estimators. I know you acknowledge that it’s not that simple, but there are two problems there.
(1) This is minor but I think it only makes sense to compare RA/9 to ERA estimators if we’re going to use FRV since FRV ignores errors and just looks at the probabilities for each play. Peralta has amazingly only given up 1 unearned run 163 2/3 innings, while Woodruff has given up 3 in 59 2/3. You’d need to adjust to league average RA/9 though which is annoying…
(2) More fundamentally, since FRV includes framing, that’s going to have an impact on all of their ERA estimators too. When Contreras frames a called strike three, that doesn’t just improve Peralta’s ERA, but also his FIP, xERA, etc.
Thanks for sharing the details!