I Know What You Did Last Summer: When Ballplayers Make Babies
To every thing there is a season, and a time to every purpose under the heaven:
A time to be born, and a time to die; a time to plant, and a time to pluck up that which is planted;
A time to kill, and a time to heal; a time to break down, and a time to build up;
A time to weep, and a time to laugh; a time to mourn, and a time to dance;
A time to cast away stones, and a time to gather stones together; a time to embrace, and a time to refrain from embracing;
A time to get, and a time to lose; a time to keep, and a time to cast away;
A time to rend, and a time to sew; a time to keep silence, and a time to speak;
A time to love, and a time to hate; a time of war, and a time of peace.
– Ecclesiastes 3:1-8
On Thursday, Toronto Blue Jays outfielder Nathan Lukes welcomed a baby named Jett into the world. That same day, teammate Daulton Varsho was expecting to welcome his own baby. When I read the news, I did what anyone would do. I thought, “How wonderful for the Blue Jays,” and then I asked the internet to do some math for me.
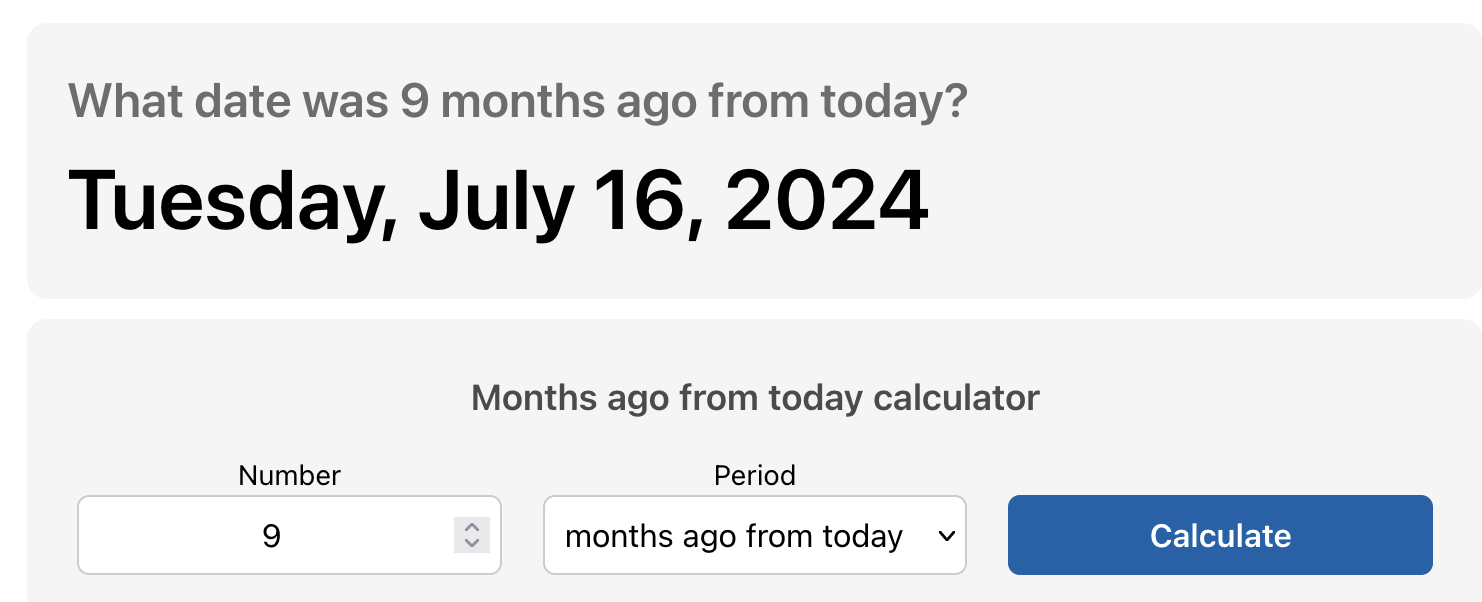
Well that’s fun. Nine months before Lukes and Varsho became fathers, it was July 16, 2024. That date may ring a bell, because it was also the date of the All-Star Game. Lukes wasn’t in the majors at the time, but clearly, both players had very productive All-Star breaks. I decided it was time for a full investigation. Do baseball players make all their babies during the All-Star break?
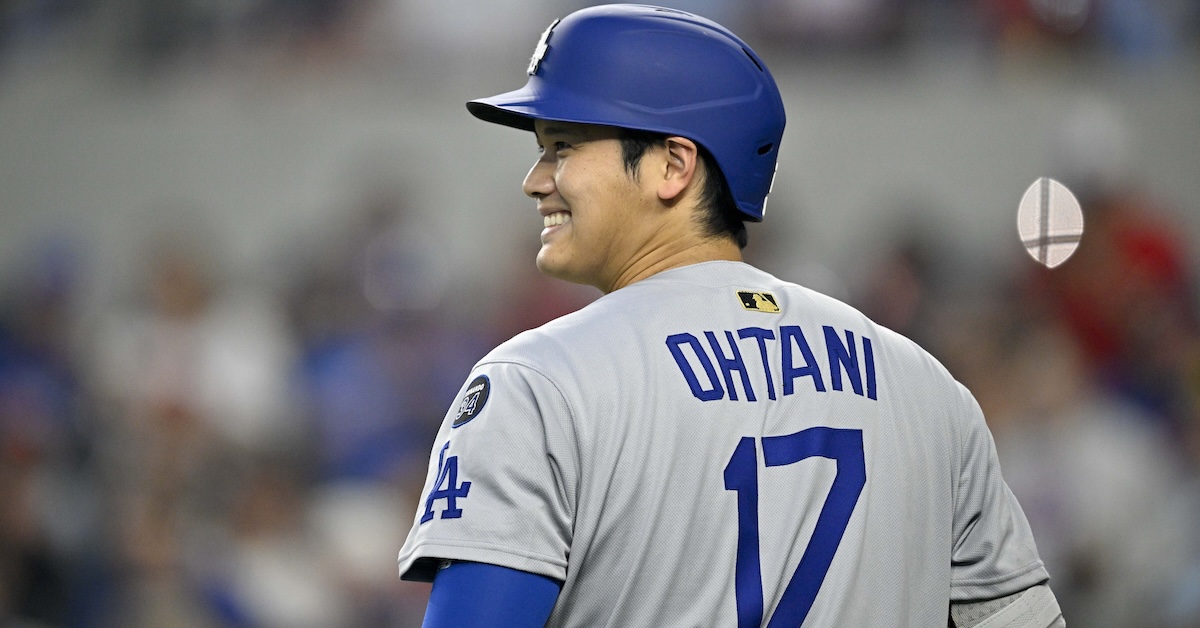
The null hypothesis was pretty simple. This could have been a coincidence, nothing more than a bit of statistical clustering. However, as soon as I started my research, the null hypothesis took a real hit. Alex Bregman went on the paternity list to welcome his own little alliterative Bregman baby (Bennett) into the world, quickly followed by Shohei Ohtani and Nick Lodolo. And the week before, Ryan Johnson, Sandy Alcantara, Jorge Polanco, and Devin Williams all went on the PL too. That’s quite a cluster.
I also considered the possibility that the 2024 All-Star Game just happened to be a particularly sexy affair. Maybe that cluster doesn’t happen every year. Maybe there was just something about last year’s Midsummer Classic that really got people going. However, I found this possibility somewhat farfetched, mostly because of the sartorial situation at Globe Life Field that evening. Do you happen to remember the uniforms players were wearing during last year’s All-Star Game?
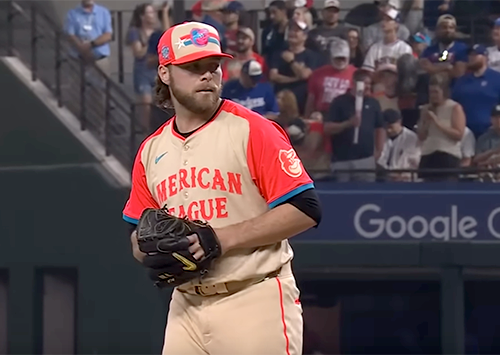
How can you not be romantic about baseball? With all due respect to Corbin Burnes, this look definitely makes it easier. Then again, how should I know what gets ballplayers and their loved ones in the mood? Maybe a particularly scintillating hit-and-run situation is all it takes.
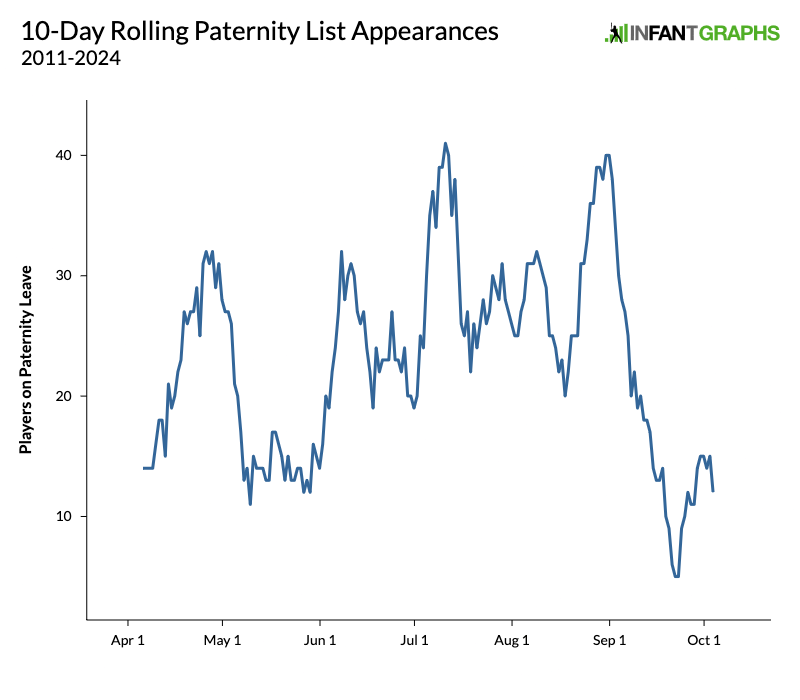
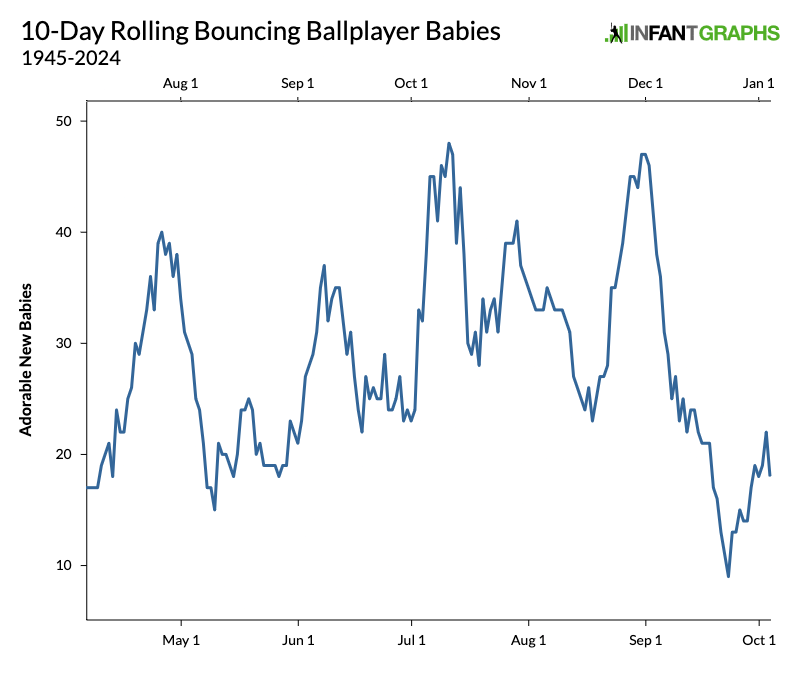
To test my theory, I started by pulling transaction log data from 2022 to 2024. I stopped at 2022 because I didn’t want the weird 2020 season to mess with the numbers, which would’ve been reflected in the 2021 data. Over those three seasons, 162 players went on paternity leave. I combined the data and made a 10-day rolling paternity leave graph, because here at FanGraphs, there is absolutely nothing that we can’t turn into a 10-day rolling graph.
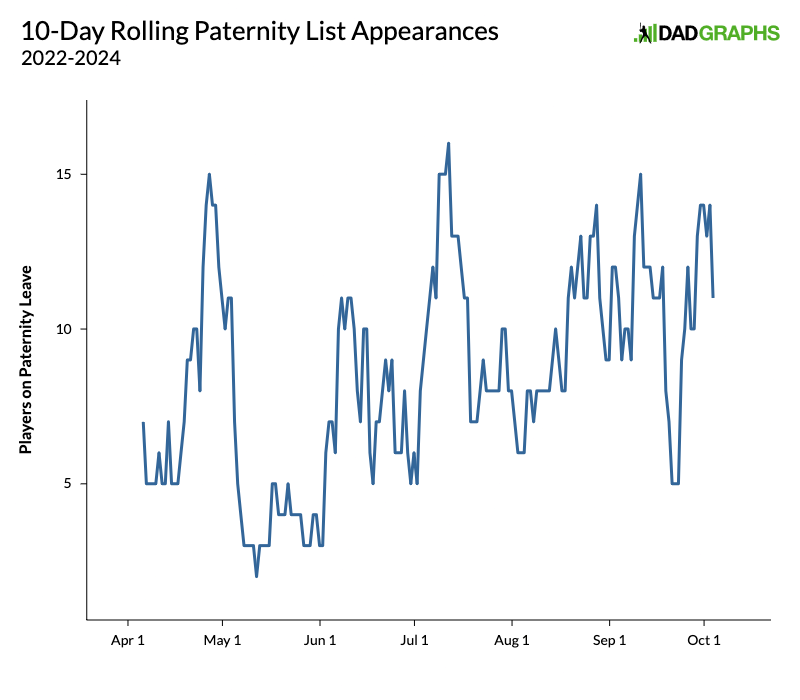
We’ll break everything down later, so there’s no need to go crazy analyzing this graph right now. I just want you to notice that first big spike in mid-to-late April. It’s very real. Nine months after the All-Star break, the graph literally has a baby bump. Ballplayers are getting a few days off during the break, but they’re not exactly resting.
If this is starting to sound familiar, it’s likely because Ben Lindbergh and Meg Rowley once broached this topic on Effectively Wild. It was just about this time two years ago, when four Dodgers and one former Dodger were all on paternity leave at the same time. Ben pulled all the data going back to 2011, when the paternity list was first created, in order to check whether that was a record. He also did a monthly breakdown, but he didn’t necessarily notice a bump in April. Instead, he noticed that July seemed to be the most popular month for ballplayer babies. Our graph above shows a similar July bump, and that makes all the sense in the world.
If you count nine months back from July, you’ll be at October, exactly when the baseball season ends. The two biggest bumps on our chart are coming during the two times when players finally get to come home and rest after several months of baseball. It would seem that their families are happy to see them. That part is pretty self-explanatory, but there’s a second factor at play here, and I think it’s the reason the July bump in particular stood out so much to Ben. Here’s the same graph as before, but now it folds in all the data going back to 2011.
In our first graph, the April and July bumps were nearly the same size, but in this graph, the April bump is much smaller. Once we incorporate the older data, July and September are by far the biggest bumps. The reason for this is that although the paternity list was created in 2011, it took years for regressive attitudes about actually using it to dissipate. Ballplayers are expected to play every day no matter what. That’s why the league managed to go without any paternity leave policy until 2011, and why it still only allows players to take three days off. Three days! I know for a fact that it takes longer than three days for a baby to grow up. Things have changed in recent years. I’ve updated the graph Ben made at the time with the data from 2023 and 2024.
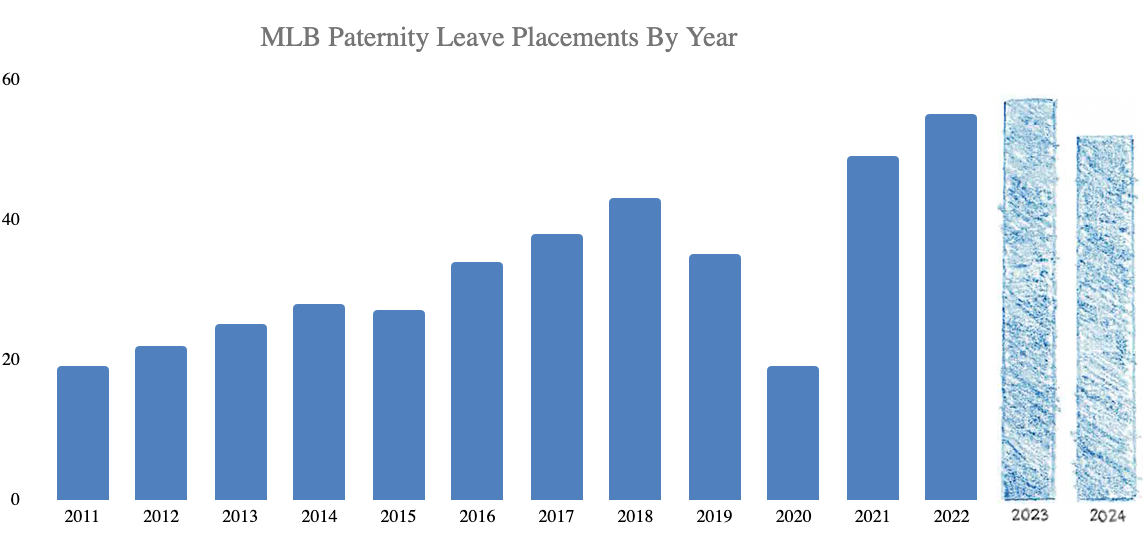
Fewer than 20 players went on the paternity list in 2011, but those numbers rose steadily over the next decade. Over the past four years, they have stabilized entirely. In 2021, 49 players went on the paternity list, In the three ensuring years, those numbers are 54, 56, and 51. These days, nobody’s giving a player grief when he takes a whopping three days off for the birth of his child. But in the before times, players were likely to take paternity leave only at particular times. If you were Mister Tough Guy in 2012, you might not bother taking paternity leave for an April baby. But in July, when things were winding down for the All-Star break anyway, you might not find it quite so shameful to spend an extra day or two getting to know your newborn child.
I suspect the same goes for the larger bump in September. I’ll explain why in a moment, but first I should explain that September is by far the most frequent birth month among the entire United States population. Jay Boice of FiveThirtyEight compiled the data in the graph below from Social Security Administration numbers.
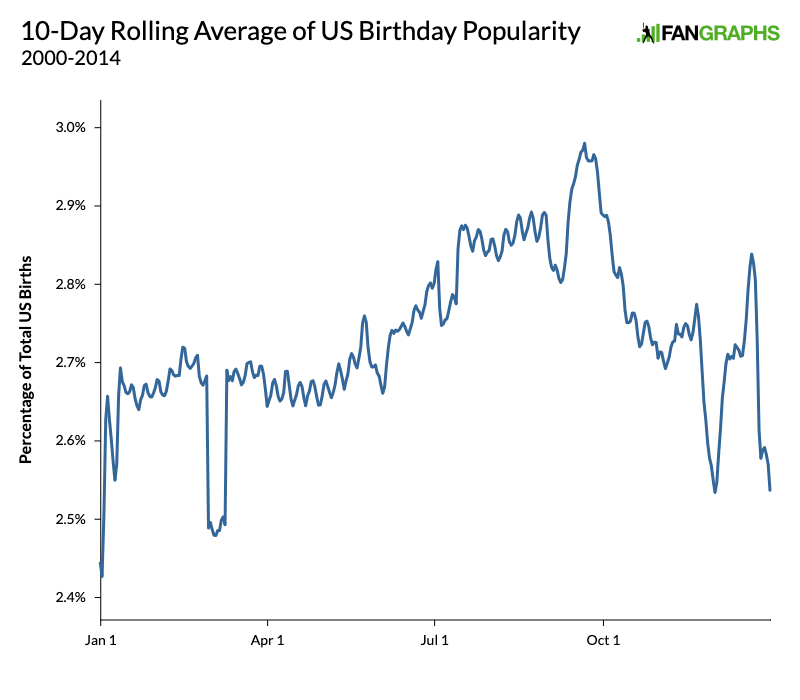
You might be familiar with some of the trends in this chart. Leap days cause a weird gap at the beginning of March. Births spike right before the holidays and crash during them. Because that’s a particularly inconvenient time to have a baby, people schedule inductions beforehand. There are plenty of reasons behind the September spike, and baseball players are clearly not immune to it either. The biggest reason is that the spike comes almost exactly nine months after the holidays, and people tend to make a lot of babies during the holidays. So while it’s definitely still weird that Christmas music tends to be so uncontrollably horny, it’s maybe more appropriate than we realize. As for the baseball reasons, incorporating the older data raised the September bump even further because that’s also a part of the season when players can take some time off without raising anybody’s hackles. Even in the stone age, if your team was out of contention and making September call-ups anyway, it wasn’t as big a deal to take a few days off to be a husband and a father.
For the opposite reason, paternity list appearances crash toward the end of September. When teams are in tight playoff races, players take much less time off. To a lesser degree, that’s even true in our very first graph, which shows only the past three seasons. So while baseball has grown more enlightened in recent years, the playoff hunt still seems to take priority. In the first few days of October, the graph ticks back up a little bit, presumably because most of the playoff races have been settled at that point. If you’re a playoff team, you probably want to give your players a day or two of rest anyway.
I also pulled in one more dataset. Baseball Almanac lists 270 major league players with at least one son who went on to play in the majors too. As nearly all the sons were born during the playing days of their fathers, I pulled the birthdays of all 201 sons born after 1945 and compared them to the overall U.S. data. Because it’s a very small dataset, the graph is very bumpy, but it still shows some clear trends and has the added benefit of showing not just the nine months of the baseball season, but the entire year. Speaking of bumpy graphs, I dispensed with subtext here. The graph below pushes all the dates back nine months, so rather than showing birth dates, it’s showing approximate dates of conception.
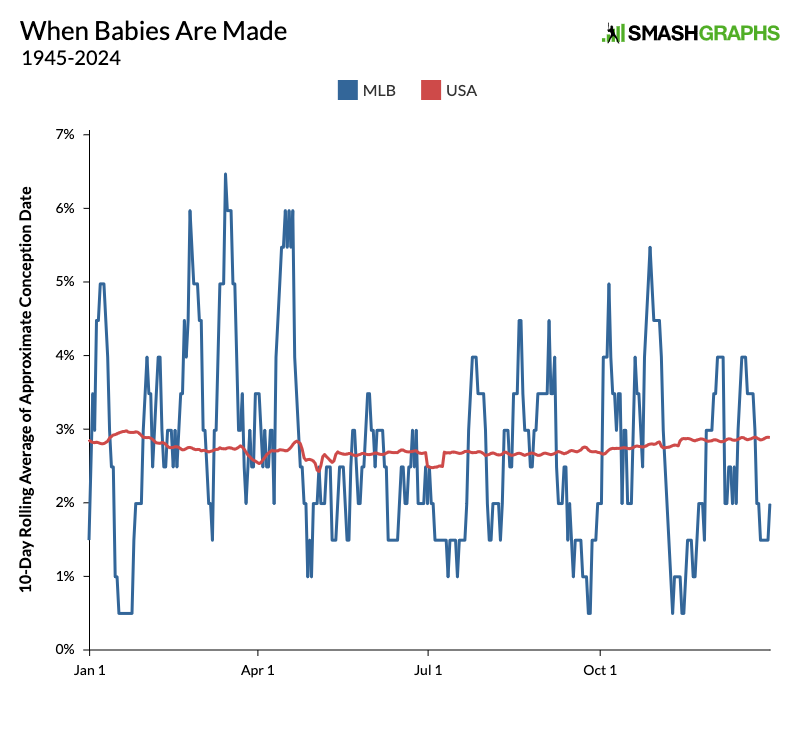
Despite the noisiness of the graph, it’s clear that ballplayers are making most of their babies during the offseason, when they’re home with their families and their lives most resemble the lives of everyday people. There’s a spike as soon as the season ends in October, then a holiday spike. The two biggest spikes come right before spring training and right before the regular season starts. Clearly, hellos and goodbyes are affectionate times in the baseball community. As such, there seems to be one more spike, right after players get home from their first road trip of the season. Call it the “I Missed You So Much” spike.
Next comes the most interesting part of the graph. It’s the lull that starts in June and lasts up until the All-Star break. Our previous graphs didn’t capture this period of relative celibacy because a baby conceived during this time would be born during the offseason, leaving no paternity list data. However, it’s clear that getting back into the grind of the season takes its toll on families, resulting in significantly less grinding.
The final graph below combines all of the paternity list data and the birthdays of legacy players, giving us a sample of 532 births during the regular season. Short of combing the newspapers for every time a player had a baby up until 2021 or so – a worthy project for further study, in case anyone is interested – this is as good as the data will get. The dates on the bottom of the graph are the births or paternity leaves, while the dates on the top show the approximate conception date nine months earlier.
You can see all the trends we talked about. There’s the All-Star Game bump in April, the end of the season bump in July, the holiday bump in September, and then the trough during the playoff race. This graph also makes it clear that there’s another big dip in baby production in August, resulting in fewer births in May. This is unique to ballplayers. Across the rest of the population, conception rates begin to climb again in August. However, that’s when ballplayers are grinding through the dog days of summer. Everybody’s tired. Everybody’s banged up.
I’d like to close by returning to our original subject. I don’t think I’ve made clear just how significant the big spike in All-Star break conceptions really is. To this point, I’ve just drawn a straight line from when a player goes on paternity leave to when he and his partner conceived their baby nine months earlier, but as anyone who’s ever tried to have a baby can tell you, it’s not always that simple.
Generally speaking, sperm can survive for five days in the reproductive system, and an egg can be fertilized up to 24 hours after ovulation. Ballplayers are home for an extra three days over the break. So if we add those days up and spot them an extra fertility bonus of a day or two because they are young and extremely healthy (and we’ll go ahead and assume the same of their partners), we’re talking about a total window of 10 days. If we assume that their partners have cycles of 28 days – though it’s worth noting that number is nowhere near as standard as our media environment makes it seem – there’s only a 36% chance that they’re even home during the time when it would be possible to conceive. And once again, that number is only so high because we’re giving the benefit of the doubt in a couple of areas. All the same, in recent years, the spike in births from those three extra days of rest has rivaled the spike that takes place when everybody gets to go home for good at the end of the season.
This is pure conjecture, but if I had to come up with a guess as to why the All-Star break spike is so dramatic despite the tiny window, that tiny window would actually be my top suspect. Sure, it’s only three days, which means a maximum chance of 36% that conception is even possible. But also, it’s only three days. The scarcity makes it precious. You might be overjoyed to see your loved ones when the season ends in October, but you also know that you’ll have months to spend with them. There’s no urgency. During the All-Star break, however, you only have three days to cram in a whole season’s worth of family business. Clearly, business is booming.
Davy Andrews is a Brooklyn-based musician and a writer at FanGraphs. He can be found on Bluesky @davyandrewsdavy.bsky.social.
How can you not be romantic about….uh, romance?