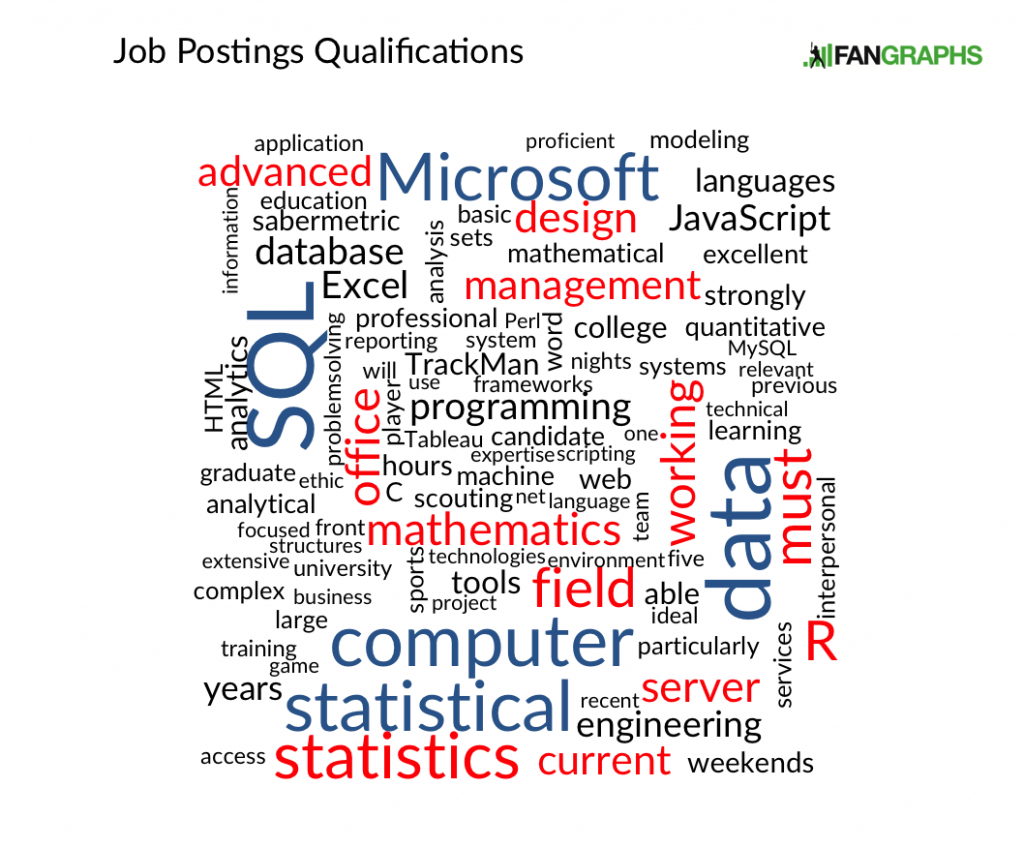
Job Postings Word Cloud
Over the past year, we have posted 32 different job postings from 20 different Major League Baseball teams and 15 job postings from TrackMan, Baseball Information Solutions, Inside Edge, STATS Inc, TruMedia, Wasserman Media Group and the Sydney Blue Sox. At Paul Swydan’s suggestion, I created word clouds to summarize these postings. These give a quick overview of what those jobs entail and the required qualifications. For those not familiar with the research and data science side of baseball, I’ll explain a few of the software tools which are prominent in the job postings and can be found in the word cloud.
To make the word cloud, I collected all the pieces we’ve published since January 2015 that contained “Job Posting” in the title. I separated the text content of each post into two different categories: job description and qualifications. From there, I took those two documents into R and used the tm package to clean the text, removing punctuation and unnecessary words like articles and prepositions. The package also tabulated the words. Additionally, I removed some other words like baseball, experience and strong. These words occurred frequently in the posts, but they were either obvious or not helpful. Then with the processed text data, I constructed the graphic using the aptly named wordcloud package. If you are unfamiliar with word clouds, larger words indicate that the specific word was found more often in the job postings.

The job description word cloud contains typical jargon commonly found in job postings, such as communication, environment and strategy. But words like queries, assist, develop and research summarize what most job postings entail.

I find the qualifications more interesting than the description since it mentions the specific skills candidates need to be considered. Out of the software tools, SQL occurs the most often. SQL is a database querying language. There are many different implementations of SQL databases such as MySQL and Microsoft SQL. There are some differences between them, but the structure of the query language is similar. SQL is popular because most baseball data is kept in large relational databases, which are like very large, very robust spreadsheets. Speaking of spreadsheets, Excel does show up in the word cloud, but not as much other tools such as SQL, R or Python. R is a statistical programming language that is used for creating and evaluating models. Python can be used in a similar manner as R, but R has more Statistics-centric packages.
While much attention in the public sphere is centered around the data and the information derived from that data, communication of that information to the front offices and the team is almost as important. The information is useless if the front office, coaches and players can’t access and understand it. Software used to make end-user tools are found in the word cloud, too, such as JavaScript, HTML and Tableau. HTML and JavaScript are both used to create interactive, browser-based interfaces, and Tableau is an enterprise-centric data visualization tool that’s available in a free public version.
At FanGraphs, we use many of these tools on a daily basis. Excel is ubiquitous, being used for data prep, data visualization or even checking .csv files. For more in-depth or customized research we use SQL to create data sets for articles. R has been used for many research-intensive projects such as Jonah Pemstein’s posts. Bill Petti has written an introduction to using R for baseball statistics at the Hardball Times and he is creating a package to make it easier for people to access data from FanGraphs and Baseball Reference to use in their own analysis.
The analytical tools I highlighted are mostly open-source and there are many free web resources available to anyone to learn who is willing to put in the time and effort.
The last interesting word to pop up in the qualification word cloud is weekends. Who doesn’t love to work weekends?
I build things here.
If you’re not a player or an owner, working in baseball seems like a horrible life.
If your goal is to maximize your income, it certainly isn’t an optimal job. If you’re looking to do something you love, and you love baseball, there aren’t many jobs that are more optimal.