Nathan Eovaldi’s Sneaky-Great Season
Nathan Eovaldi is flying under the radar. Unless you’re particularly attuned to the Rangers’ battle to get back to .500 — they’re 63-65 after a recent 1-8 skid — or doing more than a casual perusal of our leaderboards, you might miss that the 35-year-old righty is carrying a 1.76 ERA into the final third of August. A bout of elbow inflammation that sidelined him for a month has left him just short qualifying for the American League lead, but even so, he’s in the midst of one of the best seasons of his career.
It’s an unlikely, out-of-nowhere season, at that. Eovaldi has e(o)volved a great deal since he debuted with the Dodgers in 2011, but even in the second, more successful leg of his career — the years since his 2017 Tommy John surgery (his second), during which he’s won a pair of World Series rings and made two All-Star teams — he’s never posted a full-season ERA lower than 3.63 (2023 with the Rangers) or an ERA- lower than 82 (2021 with the Red Sox). From 2018–24, he put up a 3.94 ERA (91 ERA-) for the Rays, Red Sox, and Rangers, including a 3.80 mark for Texas last year, which was right at the park-adjusted league average (100 ERA-). That recent work led the Rangers to re-sign him to a three-year, $75 million deal this past winter.
Eovaldi has been on this particular run for a while. After his six-inning, two-run effort against the Red Sox on Opening Day, the highest his ERA has been at any point (setting aside in-game fluctuations) was 2.64, on April 19. Beginning with his next start on April 25 against the Giants and running through his turn on August 5 again the Yankees, he put up an 0.90 ERA and a 2.16 FIP while allowing just 52 hits in 80.1 innings. That stretch probably would have garnered more attention had he not departed his May 27 start after two innings due to what was initially described as right triceps fatigue and later diagnosed as posterior elbow inflammation. He didn’t pitch in the majors again until June 27, when he allowed three runs in three innings against the Mariners, the only time during that 3 1/2-month span in which he allowed more than one run.
The absence probably cost Eovaldi a spot on the AL All-Star team under the assumption that he wouldn’t have been available to pitch given his recent issues. For what it’s worth, the Rangers awarded him the $100,000 All-Star incentive bonus in his contract nonetheless, a magnanimous gesture.
Coming out of the break, Eovaldi was scratched from his first start of the second half due to tightness in his back, and so at least when it has come to meeting the requirement to qualify for the ERA title (one inning per scheduled team game), he’s been a dog chasing a car — sometimes close but unable to catch up. With three of his last four starts lasting seven or more innings, he’s closing the gap, totaling 123 innings in the Rangers’ 128 games. He’ll still probably need a few more starts — not to mention continued strong work — to catch up fully without disappearing from the rankings between starts, but he does have a shot at slipping into the top spot in the AL, ahead of reigning Cy Young winner Tarik Skubal and friends:
| Off. Rk.* | Pitcher | Team | IP | ERA | xERA | FIP |
|---|---|---|---|---|---|---|
| — | Nathan Eovaldi | TEX | 123.0 | 1.76 | 3.15 | 2.91 |
| 1 | Tarik Skubal | DET | 159.1 | 2.32 | 2.69 | 2.21 |
| 2 | Hunter Brown | HOU | 149.0 | 2.36 | 3.10 | 2.91 |
| 3 | Garrett Crochet | BOS | 159.1 | 2.43 | 2.99 | 2.59 |
| — | Drew Rasmussen | TBR | 123.2 | 2.62 | 3.45 | 3.49 |
| 4 | Jacob deGrom | TEX | 140.1 | 2.76 | 3.22 | 3.47 |
| 5 | Joe Ryan | MIN | 143.0 | 2.77 | 3.27 | 3.26 |
As you can see, Eovaldi is outpitching his peripherals by a considerable margin. Sticking with that 120-inning cutoff, the gap between his ERA and his FIP is the majors’ fourth-largest:
| Pitcher | Team | IP | K% | BB% | HR/9 | ERA | FIP | E-F |
|---|---|---|---|---|---|---|---|---|
| Zack Littell | TBR | 133.1 | 16.6% | 3.9% | 1.76 | 3.58 | 4.90 | -1.32 |
| Seth Lugo | KCR | 137.2 | 20.2% | 8.6% | 1.63 | 3.73 | 4.98 | -1.25 |
| Gavin Williams | CLE | 133.1 | 23.4% | 12.1% | 1.22 | 3.24 | 4.49 | -1.25 |
| Nathan Eovaldi | TEX | 123.0 | 25.5% | 4.5% | 0.73 | 1.76 | 2.90 | -1.15 |
| Brayan Bello | BOS | 128.0 | 18.0% | 8.4% | 0.98 | 3.23 | 4.31 | -1.07 |
| Tyler Anderson | LAA | 126.1 | 17.6% | 9.3% | 1.92 | 4.77 | 5.65 | -0.87 |
| Drew Rasmussen | TBR | 123.2 | 22.6% | 5.7% | 0.95 | 2.62 | 3.49 | -0.87 |
| Tomoyuki Sugano | BAL | 131.1 | 15.2% | 5.7% | 1.44 | 3.97 | 4.79 | -0.81 |
| Jacob deGrom | TEX | 140.1 | 27.3% | 5.5% | 1.22 | 2.76 | 3.47 | -0.71 |
| Ryan Pepiot | TBR | 148.0 | 24.3% | 8.5% | 1.58 | 3.95 | 4.56 | -0.61 |
Eovaldi’s FIP is also his lowest since the aforementioned 2021 season, when both his 2.79 FIP and 5.7 WAR led the AL and helped him finish fourth in the Cy Young voting behind Robbie Ray, Gerrit Cole, and Lance Lynn despite just an 11-9 record and 3.75 ERA. His current peripherals are dead ringers for his 2021 marks, with his 25.5% strikeout rate and 4.5% walk rate additionally representing substantial improvements from 2023 (22.9% and 8.1%) and ’24 (23.9% and 6%). Thanks in part to him keeping the ball on the ground more often, his home run rate has plummeted from 1.21 per nine last year to 0.73 this year.
So how is Eovaldi doing this? Not just outpitching his peripherals by more than a run per nine innings, but cutting last year’s ERA in half and then some? Mainly (I think) by becoming less predictable in terms of his arsenal. Over the past few seasons, he’s phased out his slider, which he used almost exclusively against righties, throwing it as often as 25.4% of the time to them as recently as 2021. He’s also become increasingly reliant upon his splitter while backing off the use of his four-seamer — to the point that he now throws the split more often than any other pitch, regardless of batter handedness. And he’s snuck a sinker into the mix against righties, to impressive effect.
Here’s a graph showing how Eovaldi’s usage pattern has changed since the start of 2018, split by handedness; the patterns are similar but not identical. Note the exaggerated orange dot that appears out of nowhere against righties for 2025, representing the sudden reappearance of a sinker that, according to Statcast, he’d thrown fewer than 40 times from 2015–24:
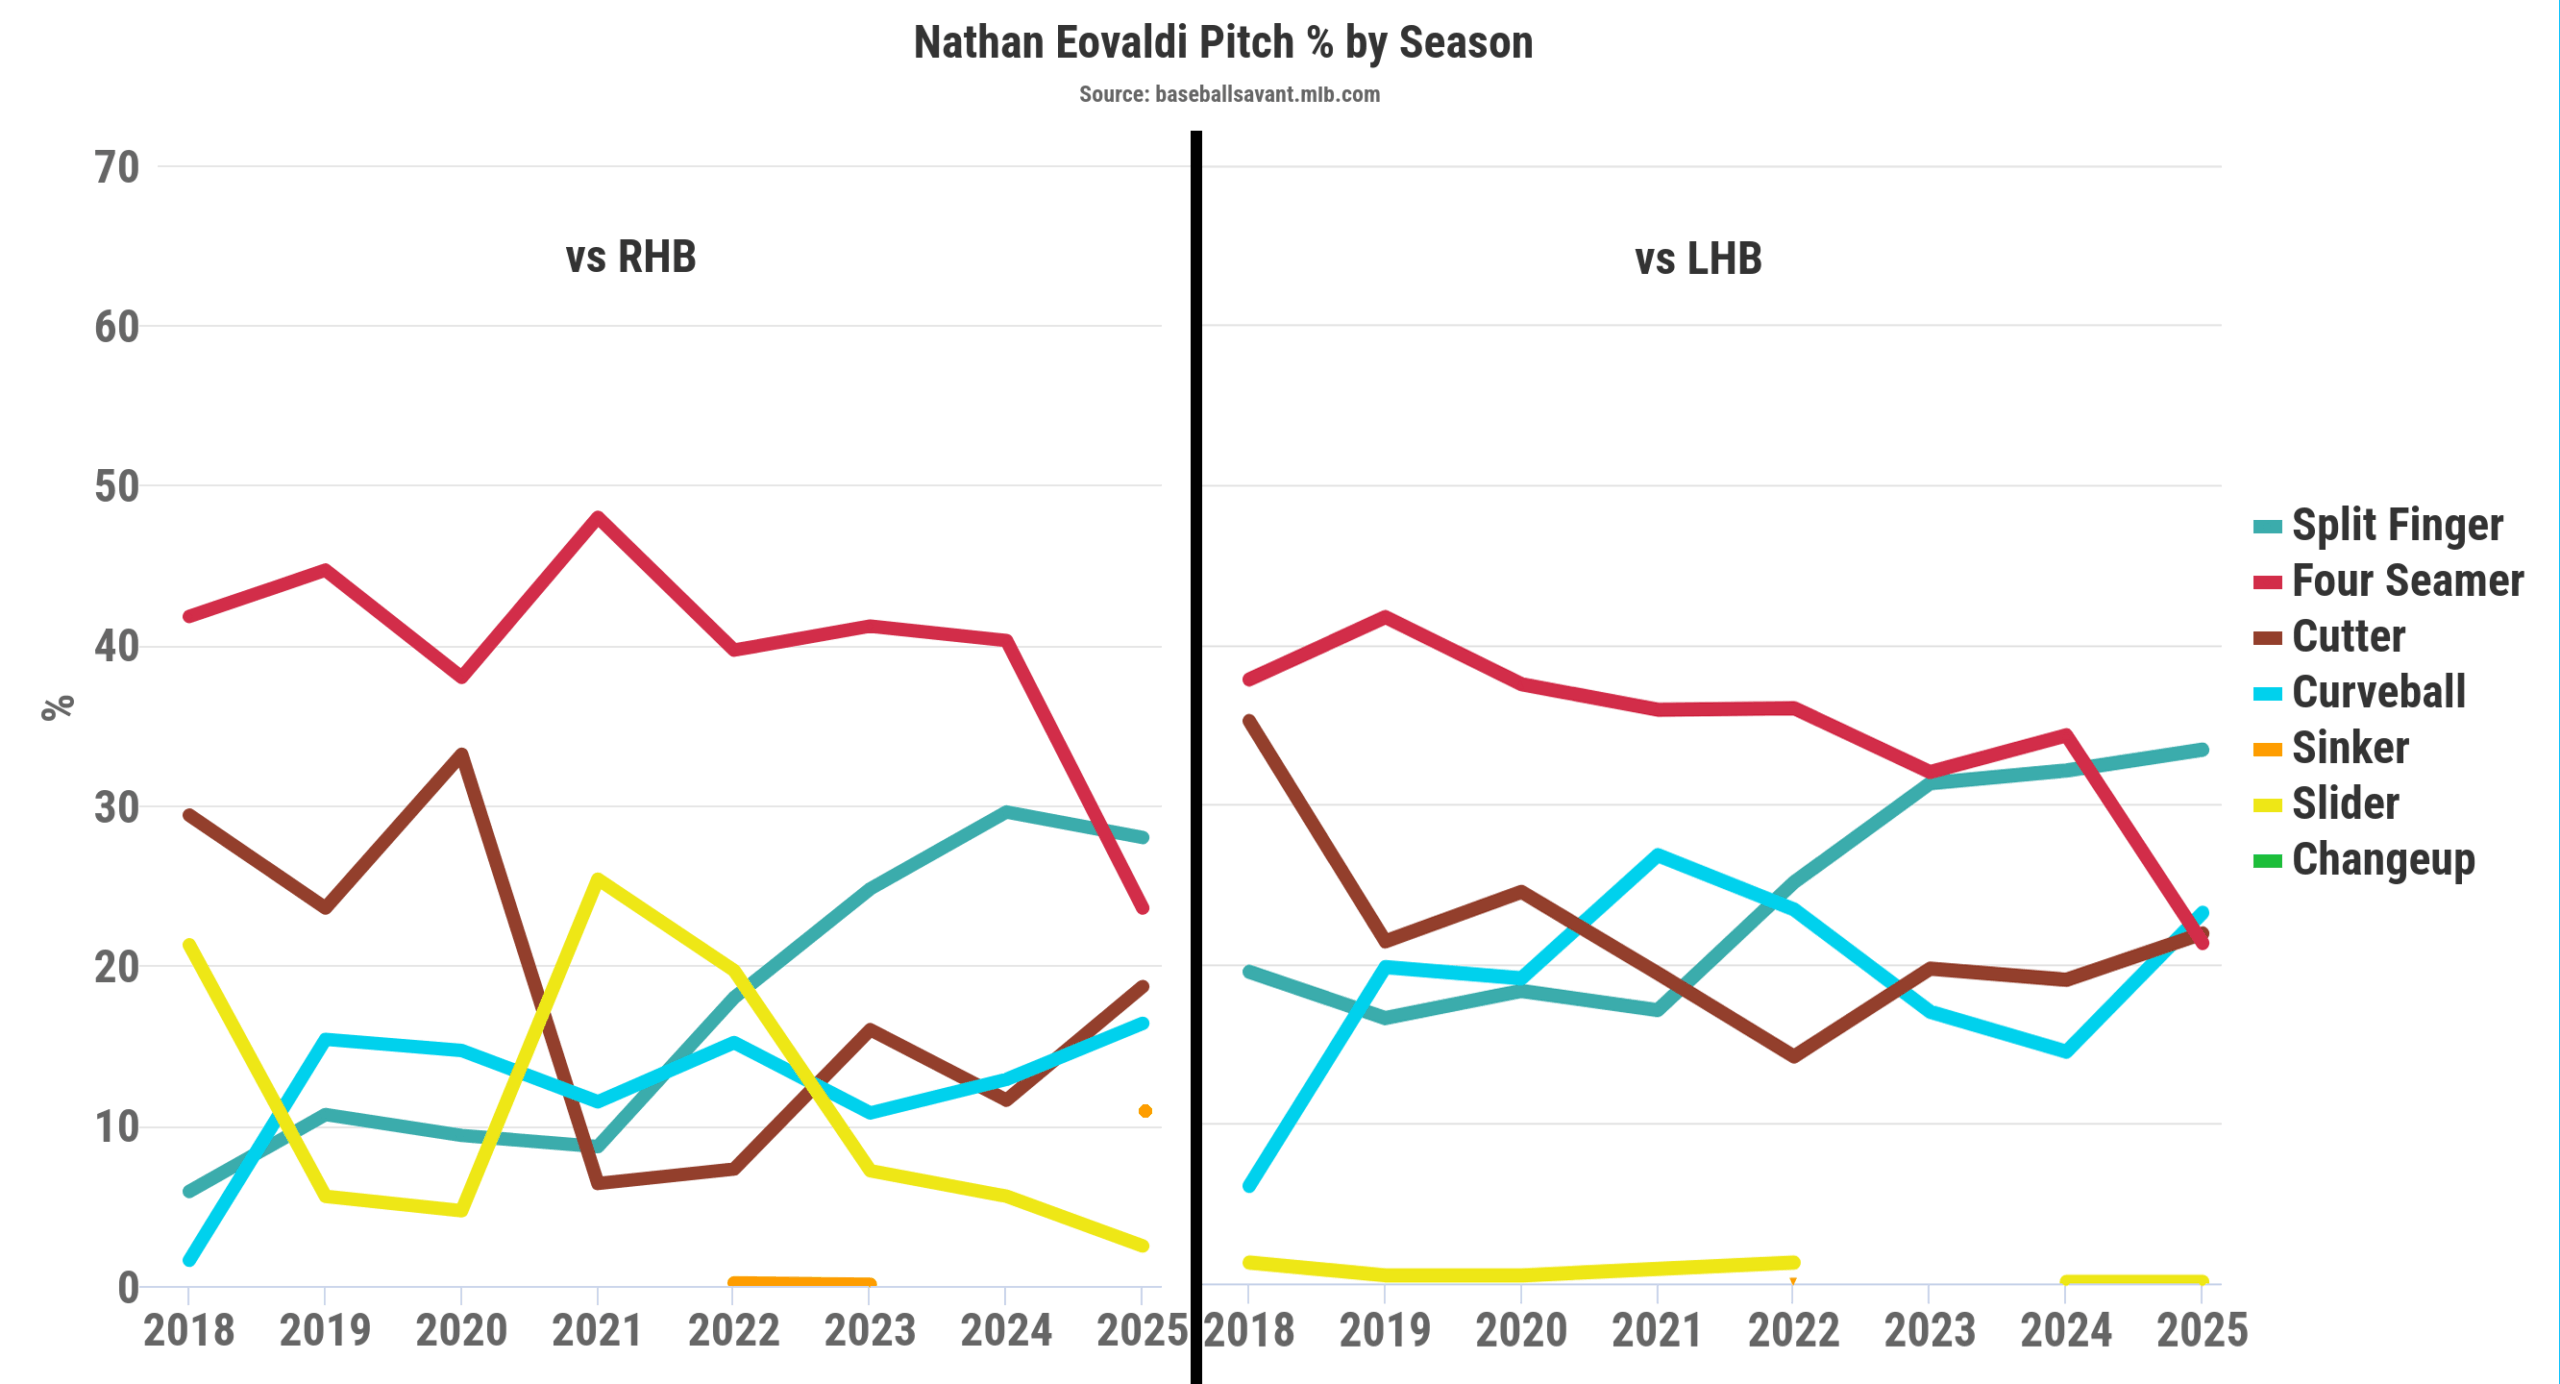
Here’s how his last three seasons look in tabular form:
| Season | Pitch | RH% | LH% |
|---|---|---|---|
| 2023 | Four-Seam | 41.2% | 32.0% |
| 2024 | Four-Seam | 40.3% | 34.3% |
| 2025 | Four-Seam | 23.6% | 21.3% |
| 2025 | Sinker | 10.8% | 0.1% |
| 2023 | Splitter | 24.8% | 31.3% |
| 2024 | Splitter | 29.6% | 32.1% |
| 2025 | Splitter | 28.0% | 33.4% |
| 2023 | Cutter | 16.0% | 19.7% |
| 2024 | Cutter | 11.6% | 19.0% |
| 2025 | Cutter | 18.7% | 21.9% |
| 2023 | Curve | 10.8% | 17.0% |
| 2024 | Curve | 12.9% | 14.5% |
| 2025 | Curve | 16.4% | 23.2% |
| 2023 | Slider | 7.2% | 0.0% |
| 2024 | Slider | 5.6% | 0.1% |
| 2025 | Slider | 2.5% | 0.1% |
Against righties, Eovaldi was previously throwing either a four-seamer or splitter 65–70% of the time, but this year, those he’s reduced that to less than 52%. He’s throwing four pitches to righties at least 16% of the time, plus the sinker at just under 11%. The story is similar against lefties, against whom he’s decreased the usage of his top two pitches from 63-65% to just under 55%; he’s now got four offerings he throws to them over 21% of the time.
The rejiggering of this arsenal is to some extent a reaction to Eovaldi’s waning velocity. Early in his career, he could dial his four-seamer up to an eye-opening 102 mph, and he reached triple digits as recently as 2022, but the average velocity of the heater has declined from 96.8 mph in ’21 to 95.4 last year and then 94.1 this year. Adding the sinker, which averages 93.3 mph, gives him a second fastball with a different shape, one that gets over four extra inches of arm-side movement (17.7 inches versus 13.4 inches) and less drop than the typical sinker. It’s fooling hitters to the point that they’re chasing it out of the zone 51.7% of the time, and averaging 81.2 mph when they make contact with it:
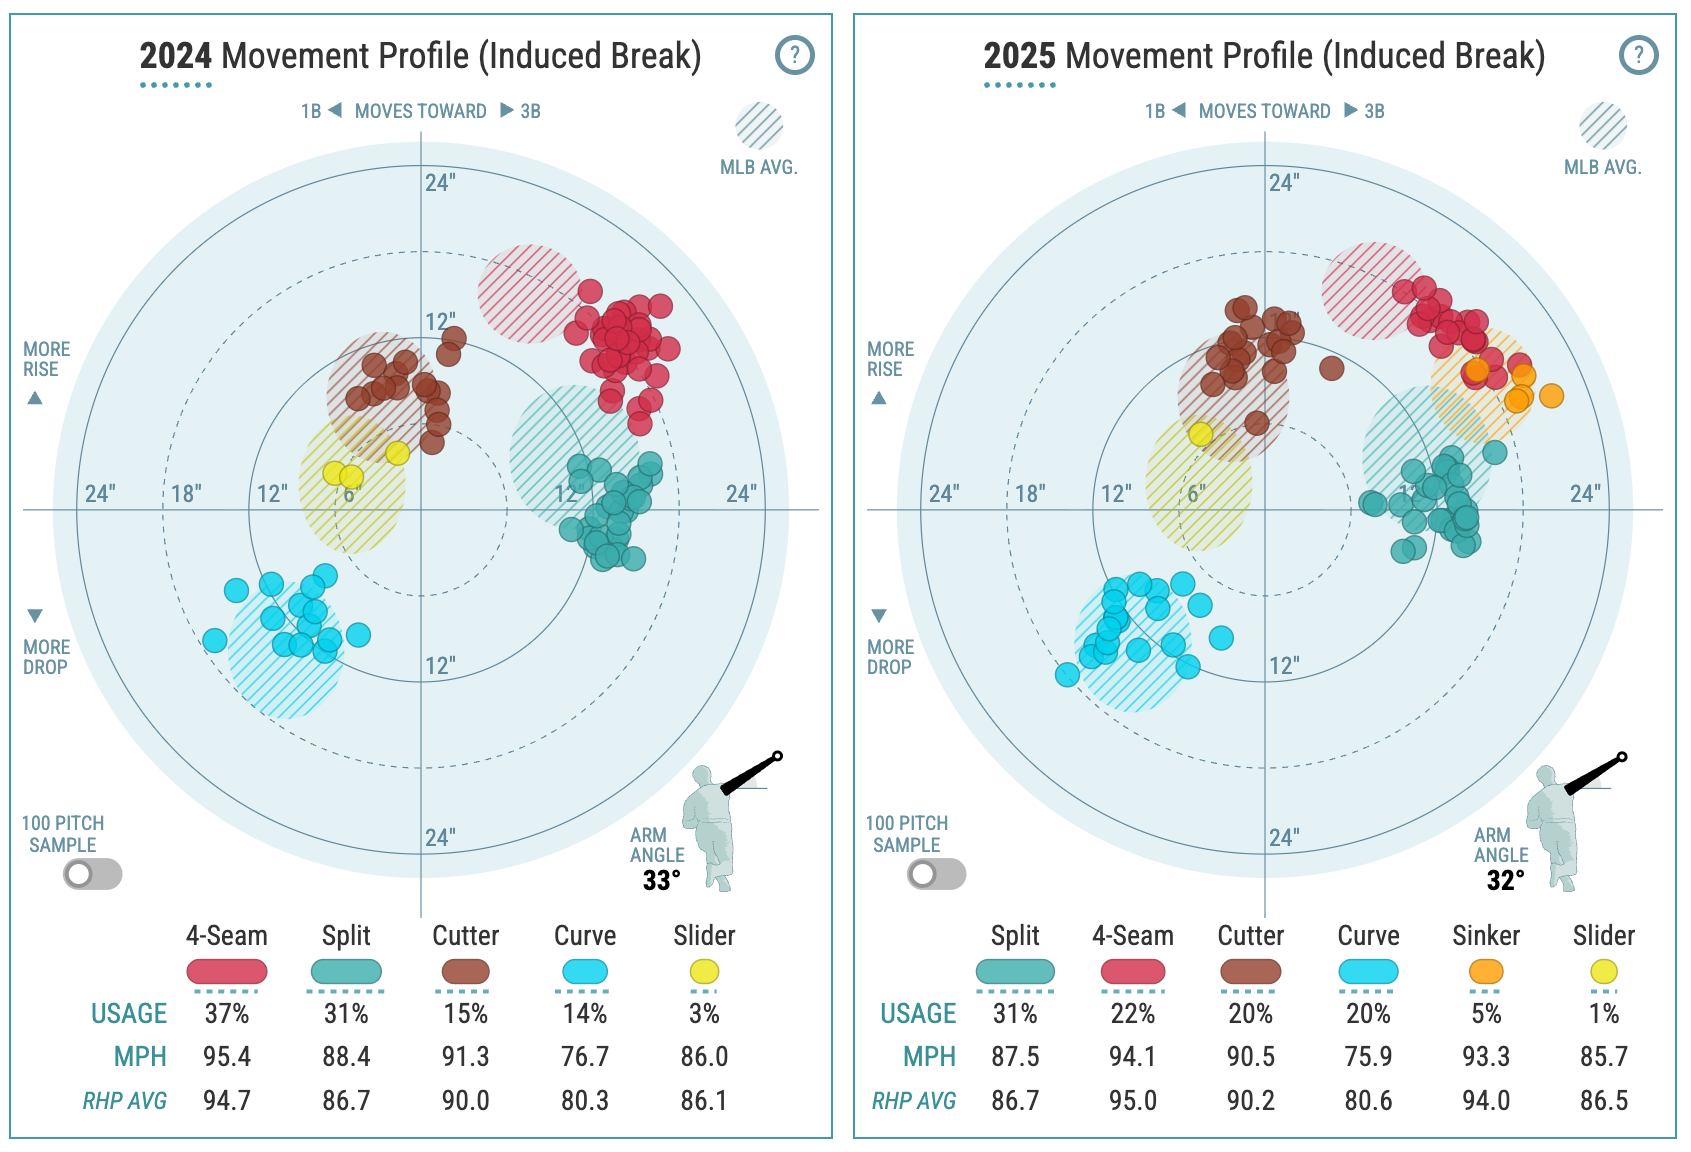
Meanwhile, Eovaldi’s other offerings are all coming in a bit more slowly, with slightly different movement. Aside from the new sinker, our two pitch modeling systems aren’t terribly impressed — or inclined to agree with each other — but it’s tough to argue with the results:
| Season | Pitch | PA | HR | AVG | xBA | SLG | xSLG | wOBA | xwOBA | EV | Whiff% |
|---|---|---|---|---|---|---|---|---|---|---|---|
| 2024 | Four-Seam | 294 | 9 | .212 | .237 | .335 | .387 | .283 | .314 | 90.8 | 17.8% |
| 2025 | Four-Seam | 96 | 4 | .276 | .283 | .471 | .492 | .340 | .357 | 94.2 | 13.5% |
| 2025 | Sinker | 38 | 0 | .222 | .280 | .250 | .398 | .233 | .313 | 81.2 | 10.4% |
| 2024 | Splitter | 198 | 3 | .200 | .232 | .286 | .327 | .234 | .272 | 88 | 36.8% |
| 2025 | Splitter | 166 | 2 | .201 | .227 | .305 | .346 | .248 | .274 | 88.3 | 36.1% |
| 2024 | Cutter | 108 | 6 | .317 | .289 | .606 | .505 | .395 | .356 | 87.3 | 20.5% |
| 2025 | Cutter | 84 | 1 | .173 | .239 | .247 | .437 | .199 | .300 | 87.8 | 19.3% |
| 2024 | Curveball | 73 | 4 | .214 | .215 | .471 | .374 | .304 | .270 | 85.3 | 35.5% |
| 2025 | Curveball | 78 | 2 | .096 | .139 | .178 | .240 | .154 | .195 | 80.4 | 42.9% |
| 2024 | Slider | 23 | 1 | .304 | .364 | .522 | .493 | .352 | .371 | 91.3 | 23.1% |
| 2025 | Slider | 7 | 1 | .286 | .295 | .714 | .617 | .418 | .379 | 92.8 | 0.0% |
While hitters have improved their wOBAs against Eovaldi’s four-seamer, splitter, and rarely-used slider relative to 2024, he’s still holding them to a .248 wOBA or lower with four different pitches, with the cutter and curve particularly more effective. In terms of Statcast run values, his cutter is tied with Drew Rasmussen for first (13 runs), his splitter is tied for second (eight runs), and his curve is tied for fourth (six runs).
In addition to that 81.2 mph average on contact with the sinker, batters are averaging just 80.4 mph when they make contact with the curve. Some of that soft contact is offset by the rockets produced when batters hit Eovaldi’s four-seamer, but overall, his 88.6 mph average exit velocity, 7.5% barrel rate, and 38.5% hard-hit rate are all in the 62nd to 67th percentiles. That’s an improvement given that last year they ranged from the 17th (his 42.6% hard-hit rate) to the 49th (his 7.7% barrel rate).
As his FIP and his .243 BABIP suggest, Eovaldi is primed for some regression. Still, it’s not often we see a starting pitcher carrying a sub-2.00 ERA into late August, let alone finish with one. Here’s a look at all the pitchers over the previous 10 seasons who have had ERAs below 2.00 with at least 120 innings as of August 20:
| Pitcher | Team | Season | IP Aug 20 | ERA Aug 20 | FIP Aug 20 | IP Final | ERA Final | FIP Final |
|---|---|---|---|---|---|---|---|---|
| Zack Greinke | LAD | 2015 | 165.1 | 1.58 | 2.57 | 222.2 | 1.65 | 2.76 |
| Jacob deGrom | NYM | 2015 | 154.1 | 1.98 | 2.70 | 191.0 | 2.54 | 2.70 |
| Clayton Kershaw | LAD | 2016 | 121.0 | 1.79 | 1.67 | 149.0 | 1.69 | 1.80 |
| Jacob deGrom | NYM | 2018 | 168.0 | 1.71 | 2.08 | 217.0 | 1.70 | 1.99 |
| Chris Sale | BOS | 2018 | 146.0 | 1.97 | 1.95 | 158.0 | 2.11 | 1.98 |
| Blake Snell | TBR | 2018 | 139.0 | 2.07 | 3.29 | 180.2 | 1.89 | 2.94 |
| Hyun Jin Ryu | LAD | 2019 | 148.1 | 1.64 | 2.99 | 182.2 | 2.32 | 3.10 |
| Justin Verlander | HOU | 2022 | 143.0 | 1.95 | 2.88 | 175.0 | 1.75 | 2.49 |
| Nathan Eovaldi | TEX | 2025 | 123.0 | 1.76 | 2.91 |
Justin Verlander is the only starter in the past half-decade to finish with a sub-2.00 ERA. Of the six starters who had one at this juncture from 2015–19, three held on until the end of the season, and one with a slightly higher ERA ducked under the wire. Three of these guys — Jacob deGrom (2018), Blake Snell, and Verlander — brought home Cy Youngs that year. That’s not to say that Eovaldi will even if he pulls this off, particularly with Skubal pitching so well, but his chase is definitely something to keep an eye on.
Brooklyn-based Jay Jaffe is a senior writer for FanGraphs, the author of The Cooperstown Casebook (Thomas Dunne Books, 2017) and the creator of the JAWS (Jaffe WAR Score) metric for Hall of Fame analysis. He founded the Futility Infielder website (2001), was a columnist for Baseball Prospectus (2005-2012) and a contributing writer for Sports Illustrated (2012-2018). He has been a recurring guest on MLB Network and a member of the BBWAA since 2011, and a Hall of Fame voter since 2021. Follow him on BlueSky @jayjaffe.bsky.social.
Eovaldi and Degrom have been bright spots amid a dreary last two weeks for Rangers