Reliever Contracts Make Plenty of Sense
Most free agent contracts are relatively easy to predict. Calculate the going rate for a single win, multiply it by the player’s projected wins above replacement over the length of the deal, and the result will come pretty close to the actual contract. This generally holds true for every type of player save one: the humble relief pitcher.
The Mets gave Luke Weaver $22 million for two years. The Tigers gave Kenley Jansen $11 million for his age-38 season. The Reds gave Emilio Pagán two years and $20 million, with the second year a player option. Run all of the reliever contracts signed this offseason through a dollars per win calculation, and they’re almost uniformly going to come out looking like terrible deals.
The sport appears to be smarter than ever, and yet teams keep shelling out gobs of guaranteed money on bullpen arms who hardly ever top 2 WAR. What’s their problem? Well, maybe teams have collectively decided to behave irrationally in one specific market, but I don’t think it’s that. I think teams are behaving as rationally in the reliever market as any other, but they happen to be using a different metric for evaluating reliever deals. The relevant metric, I think, isn’t dollars per win, but something like championship win probability added.
In the 2025-26 offseason, I calculated that teams have paid roughly $8 million per projected win for starting pitchers and position players. Here I’ll note that for multi-year deals, I ignored years after 2026, simply calculating the upcoming season’s dollars per win. Other calculations factoring in the performance decline of players on multi-year deals have come in higher, but the point is to establish an apples-to-apples baseline with relievers. Also, I used the AAVs in our Free Agent tracker, which are adjusted for deferrals. Lastly, my data set for both relievers and non-relievers includes all deals signed as of January 10 – my apologies to Pierce Johnson.
Even for non-relievers, dollars per win has all sorts of issues as an evaluation framework. As many baseball analysts have observed over the years, there’s good reason to believe that wins ought to be valued in a nonlinear fashion. A player projected for two wins may well be worth $16 million for a single year’s work, but a player projected for four wins is likely worth a good bit more than $32 million, while a player projected for a single win is probably worth a bit less than $8 million.
The reason is the scarcity of both players and roster spots. Four-win players are nearly impossible to find on waivers or hanging around in Triple-A; that’s less true of players who can produce 1-2 WAR. On Bluesky last week, Jonathan Judge of Baseball Prospectus also argued that those who get paid in free agency constitute a small and specific share of the player pool, and so dollars per win only has limited applicability.
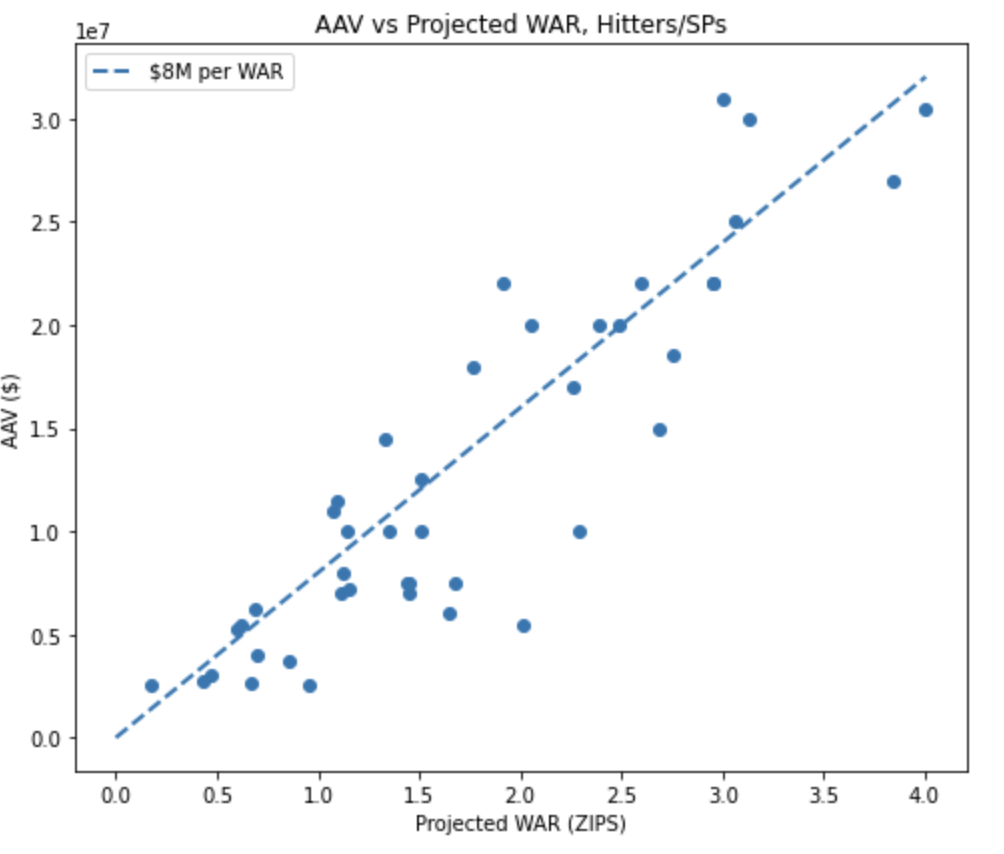
Even with these caveats, a linear application of dollars per win tends to explain the contracts of position players and starting pitchers with a high level of accuracy. Below is a plot of all the 2026 hitter and starting pitchers who have signed contracts with an average annual value (AAV) of at least $2.5 million. On the x-axis is their projected WAR per ZiPS; the y-axis is their AAV. The blue line is an $8 million AAV. As the plot shows, multiplying 2026 projected WAR by $8 million gets you pretty close on almost every contract signed:
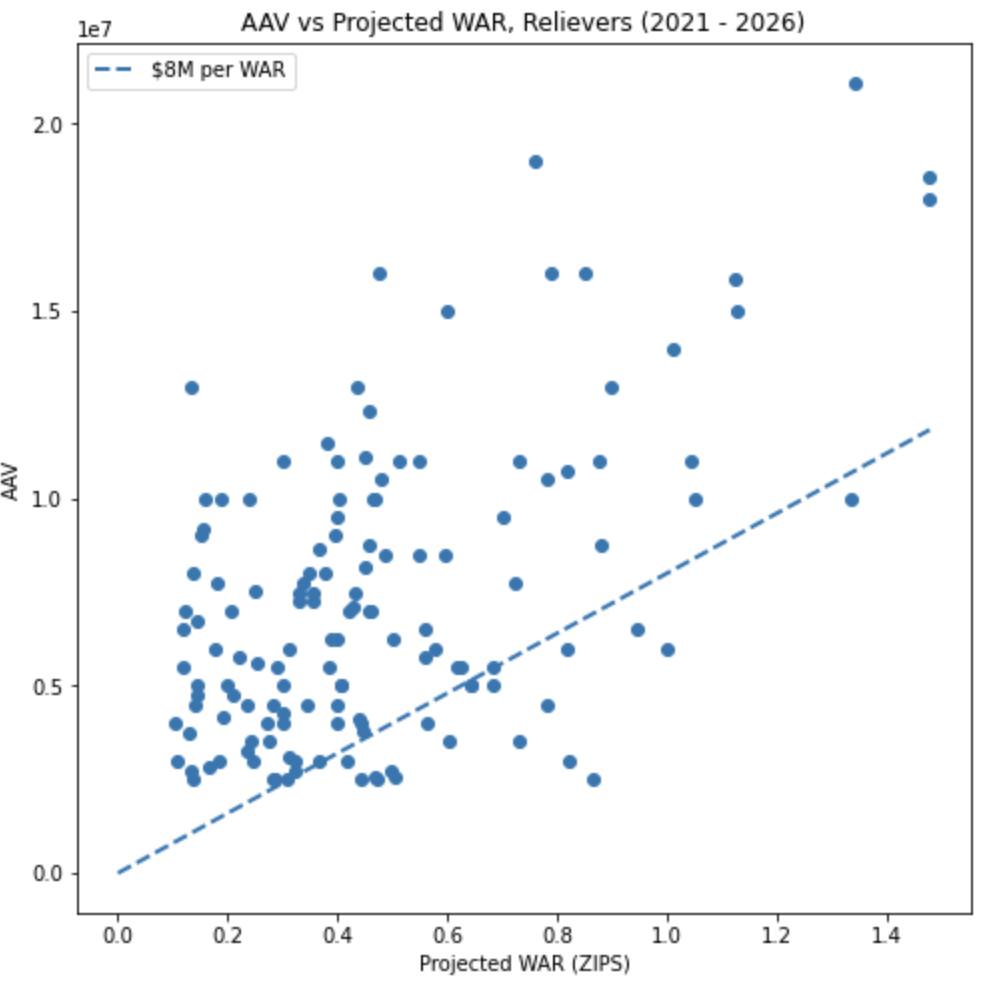
That isn’t the case with relievers. The plot below features all reliever contracts signed since 2021, with the same $2.5 million AAV cutoff. Nearly every deal lands above $8 million per win. The median reliever contract in the 2020s surpassed $15 million per projected win, nearly double the going rate for position players and starting pitchers:
None of these insights are particularly novel. Back in 2011, Jack Moore wrote a piece for this site titled “Can WPA Explain How Teams Buy Relievers?” As Jack wrote, “simply declaring ‘teams are overpaying relievers’ ad nauseam does very little to advance our understanding of how the game actually works,” and suggested a win probability framework might better capture the whims of the marketplace.
In 2018, Russell Carleton expanded upon this theme in his story titled “Why Relievers Are Getting Paid.” Russell pointed out that “teams aren’t collecting context-neutral wins,” which is what WAR more or less measures. In other words, the win that takes a team from 88 to 89 wins is much more valuable than the one that takes them from 78 to 79. Relievers, Russell says, have the ability to swing “the games that will make or break a season.”
I’m going to take Russell’s idea one step further. Competitive teams are not just willing to pay high prices for high-leverage relievers because they can make the difference between playoffs and no playoffs. They’re paying for the playoff innings themselves. In other words, the Dodgers didn’t pay Edwin Díaz $69 million just to deliver a 2.25 FIP over 65 regular season innings. He commanded a $23 million AAV because, if they happen to once again find themselves in the 10th inning of World Series Game 7, they’ll have Díaz instead of a starting pitcher working on zero days rest. (Jarrett Seidler suggested something similar last month, which got me thinking about this topic in general.)
Proving that teams are paying relievers by cWPA instead of WAR presents a boatload of complications, not the least of which is the general public tendency to only project regular season statistics. Unfortunately, there’s not really a way around that — a projection can’t assume a player will compete in the postseason in 2026, let alone two or five or 13 years in the future. Mostly this is fine, and you wouldn’t necessarily expect a player to be significantly more important in the regular season than the postseason, and so it all makes roughly enough sense.
But this all breaks down for relievers. WAR, leverage-adjusted for relievers though it is, can’t fully explain the prices teams are paying for bullpen arms. It’s not that they don’t care how a guy performs in April or July; that can go a long way to whether you get to play in October, after all. But they’re also paying for a conditional: If we make the playoffs, then this player will have disproportionate value. Given that, perhaps something like cWPA gets a little bit closer to matching how they pay for other types of players.
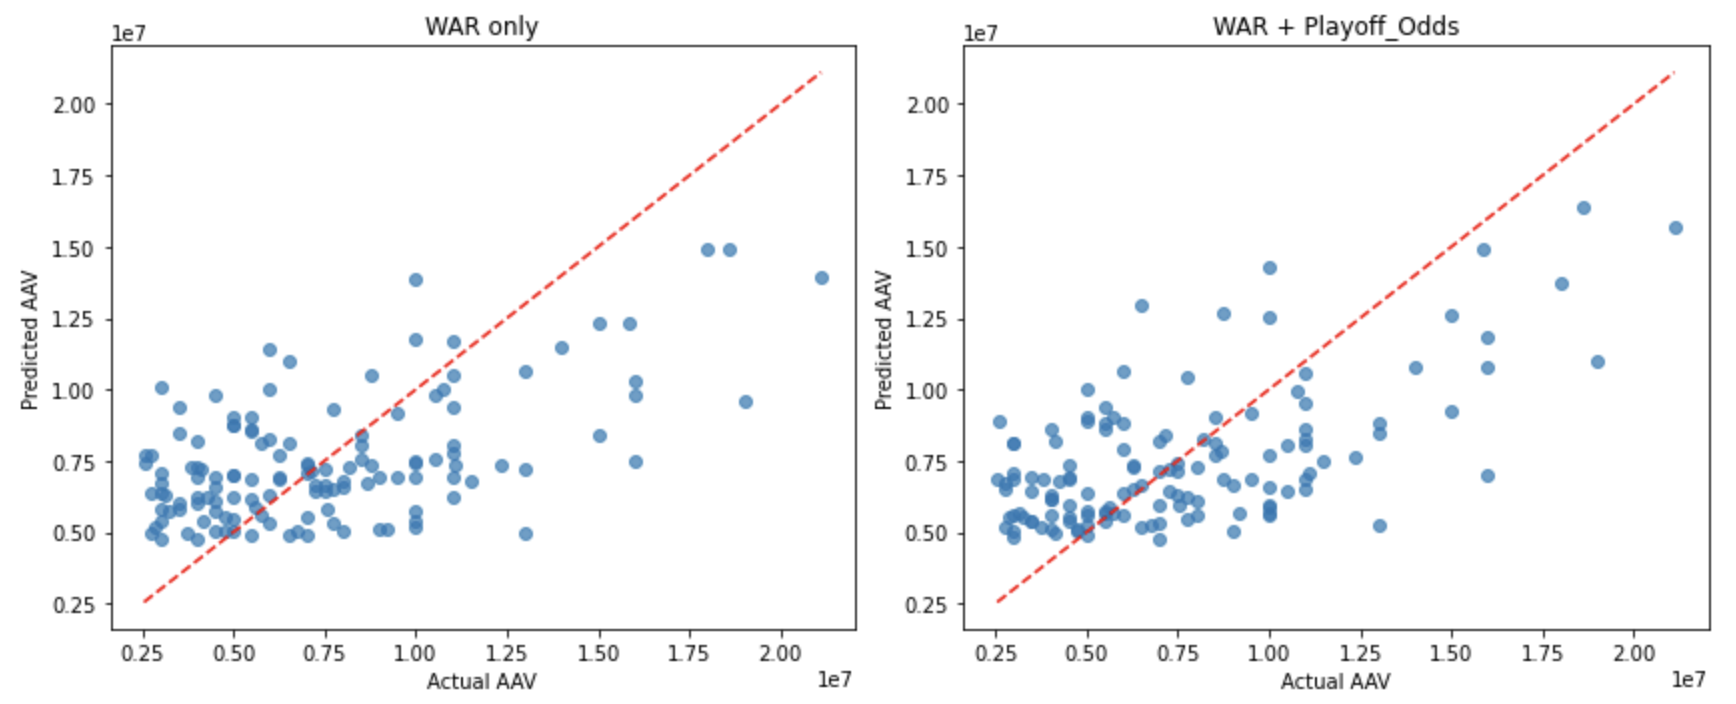
Because there’s no easy way to do cWPA projections for relievers, I came up with a roundabout way to account for this tendency. Taking that same 2020s dataset of reliever contracts, I first created a simple linear regression model that predicted reliever contracts using only projected WAR. That model had an r-squared of 0.3; in other words, it predicted 30% of the variation in reliever contracts during this decade.
I then added the preseason playoff odds for the relievers’ signing team into the model. (For 2026 playoff odds, I created a proxy from Steamer projections; they aren’t perfect, but I think they’re close enough. I put them in a Google sheet if you want to beef with them.) It wasn’t a huge jump, but the addition of playoff odds meaningfully improved the model predictions. The r-squared jumped to 0.37; the larger contracts in particular came much closer to the predictive line:
And this isn’t just a case of better teams spending more money. I performed the same exercise with the starting pitcher and position player dataset; adding the playoff odds increased the r-squared from 0.8 to 0.81. One could also argue that this model merely captures the fact that only playoff contenders will pay full market prices for relief pitchers. But I don’t think that’s exactly right either. As playoff odds — and therefore World Series odds — increase, teams will spend marginally more on each reliever, holding all else constant. To me, this suggests a specific premium for relievers applied to their projected championship win probability added.
The dominant contract framework has always been, in some sense, a little bizarre. We tend to think of teams paying players based on a projection of their regular season performance, but a team’s ultimate objective is to win in the playoffs. Even the nerdiest clubs aren’t just trying to maximize their regular-season winning percentage; they want to win the whole thing, even if the latter goal is on some level more of an arbitrary accomplishment.
Generally, these goals overlap. If you sign a shortstop, he doesn’t magically become more important when the playoffs start. But that’s not true of relievers. A single playoff inning pitched by a reliever can significantly alter a team’s chances of winning or losing a World Series, and the postseason schedule allows that same reliever to appear in virtually every game. (Hello, Louis Varland.) Relievers, especially the best of the best, escalate in value when the playoffs begin, and teams are paying those players accordingly. By dollars per win, it might not pencil out; sub in cWPA, and the math may well start mathing.
Michael Rosen is a transportation researcher and the author of pitchplots.substack.com. He can be found on Twitter at @bymichaelrosen.
I don’t think I understand the charts. The first two have AAV on the Y-axis, but the scale is 0-3 and 0-2. If I understand the text correctly, the projected WAR is only for 2026, right? I don’t think any 4-WAR players signed for $3M/year.
The two smaller charts show actual AAV on the x-axis and projected AAV on the y-axis. This threw me for a while because the independent variable, dependent variable, and scalar are not what I was expecting. Its a linear system, so it doesn’t really matter which is which, it just made it a little confusing. Again the AAV scale is between 0 and 2, which seems wrong unless I’m missing something.
If the addition of playoff odds only improved the correlation from 0.3 to 0.37, I think we have a ways to go. Teams seem to value 1) proven closers, 2) stuff/K-rate, and 3) swingmen who can move between the bullpen and rotation.
I would also note also that MLB instituted a 3-batter minimum in 2020, which changed the way relievers are used – no more platoon specialists. It makes sense to revisit the pre-2020 conclusions/hypotheses about how relievers are valued and paid.
check out the 1e7 on the top left of the plots — that means it’s 2 (and 3) * 10^7, so $20 million and $30 million respectively