It used to be said that old guys couldn’t stick at shortstop.
“You know, it’s kind of like a running back after 30 [years old],” then-Rangers manager Chris Woodwardsaid back in 2020, marveling at the defensive longevity of Elvis Andrus. “Shortstops after 30? There’s not too many of them.”
As of late, though, something has changed. Here is a plot showing the number of primary shortstops qualifying for the batting title in their age-30 season or older. In 2026, there are nine pacing to qualify, almost touching the previous peak in 2014: Read the rest of this entry »
Apparently Luis Arraez is good at defense now. This took me by surprise, and perhaps it also took you by surprise, or perhaps it is at least taking you by surprise in this exact second, as you ingest this blog. Because if there’s one thing you know about Luis Arraez, it’s probably… well, it’s that he is incredible at contacting the baseball with a bat. But if there’s a second thing you know about Luis Arraez, it’s that he is not very good at defense.
This fact is a key totem in the still-raging Arraez Wars of the 2020s. Those who like baseball played the old-fashioned way insist that he is an MVP-level talent, enraging most contemporary baseball fans who understand that singles are only so valuable, especially for a guy who can’t run well or hold down a defensive position.
When Arraez signed with the Giants this offseason under the condition that he would only play second base, the universal reaction was something like, “OK, well, good luck with that.” Such pessimism was warranted. In 2024 — his age-27 season! — he graded out as -7 outs above average at second base in just 42 games played there; given a full season, he would’ve easily been the sport’s worst defender at the position. In 2025, the Padres punted him down the defensive spectrum to first base. But even at first, Arraez looked nearly unplayable, racking up another -7 OAA at the notoriously easy position. (It’s not that hard, tell ’em Wash, etc.) Those lacking the range to play first base often find themselves consigned to designated hitterdom sooner rather than later.
Not so fast, Arraez said. On February 13, Susan Slusser of the San Francisco Chronicle published a story with a shocking lede: “Luis Arráez’s fielding at second base is already vastly improved, at least according to San Francisco Giants infield coach Ron Washington, and Arráez agrees.” Slusser cited Arraez’s hard work over the offseason as the catalyst. Read the rest of this entry »
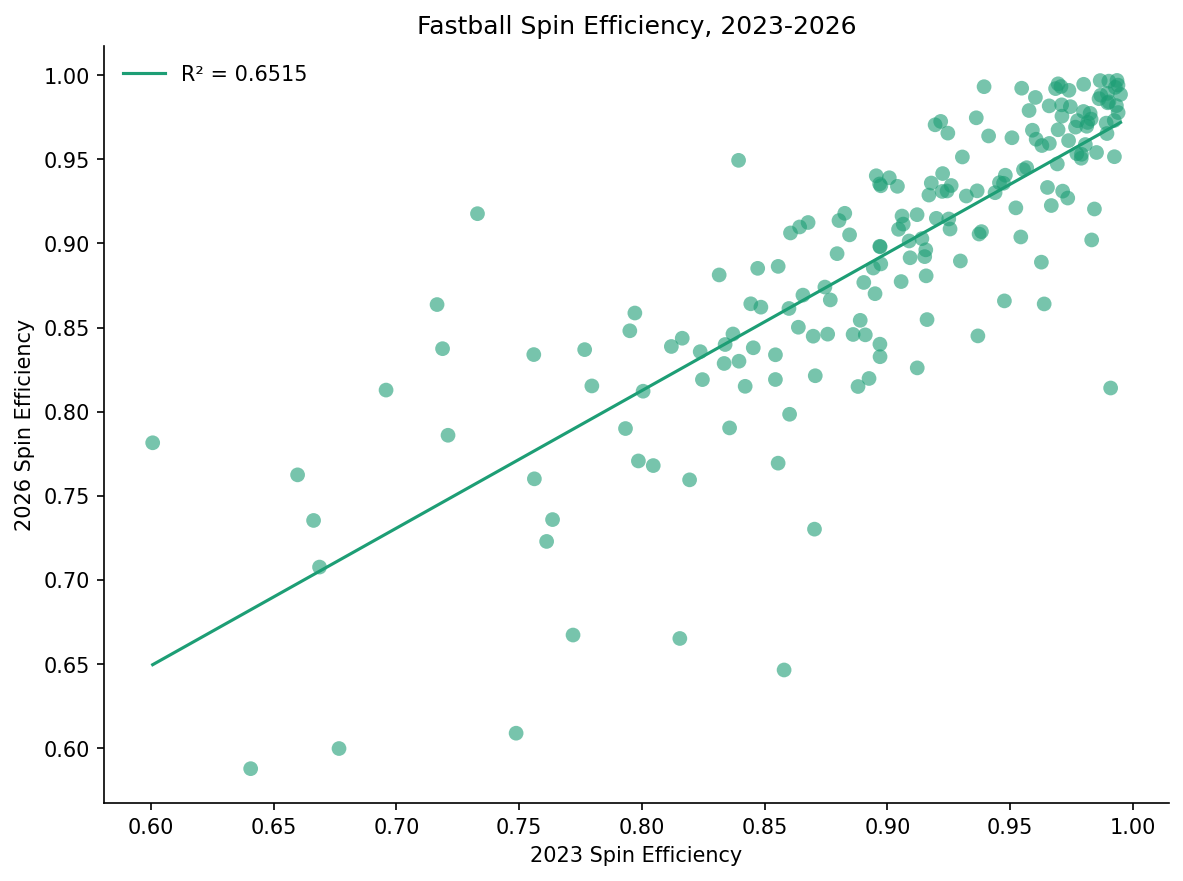
Pitchers can do all sorts of things to change their lot in life — launch plyo balls, rig up a Trackman, add a kick change — but motor preferences tend to be a fixed fact. Most pitchers fall into one of two buckets: pronator or supinator. Pitchers with high spin efficiency (say, 95% and up) on their four-seam fastball belong to the pronator class, while those below 90% can be considered supinators. (As a reminder, spin efficiency is the measure of how much spin is “useful;” a fastball thrown with perfect backspin would have 100% spin efficiency.) These mechanical biases tend to remain constant throughout a career. I took 185 pitchers who threw at least 25 fastballs in both 2023 and 2026; over that three-year span, the r-squared between their spin efficiency was 0.65.
On that plot above, you’ll see, as there always are, a few outliers. One is Joe Boyle. The tale of Boyle is relatively well known at this point, at least in certain social media pitching circles. Over the last three years, Boyle went from throwing from an over-the-top arm angle (53 degrees) to a distinct side-arm slot (26 degrees.) The arsenal, in turn, transformed alongside it. This dramatic slot change coincided with his fastball spin efficiency declining from 86% in 2023 to 67% in 2026, one of the largest drops in that span.
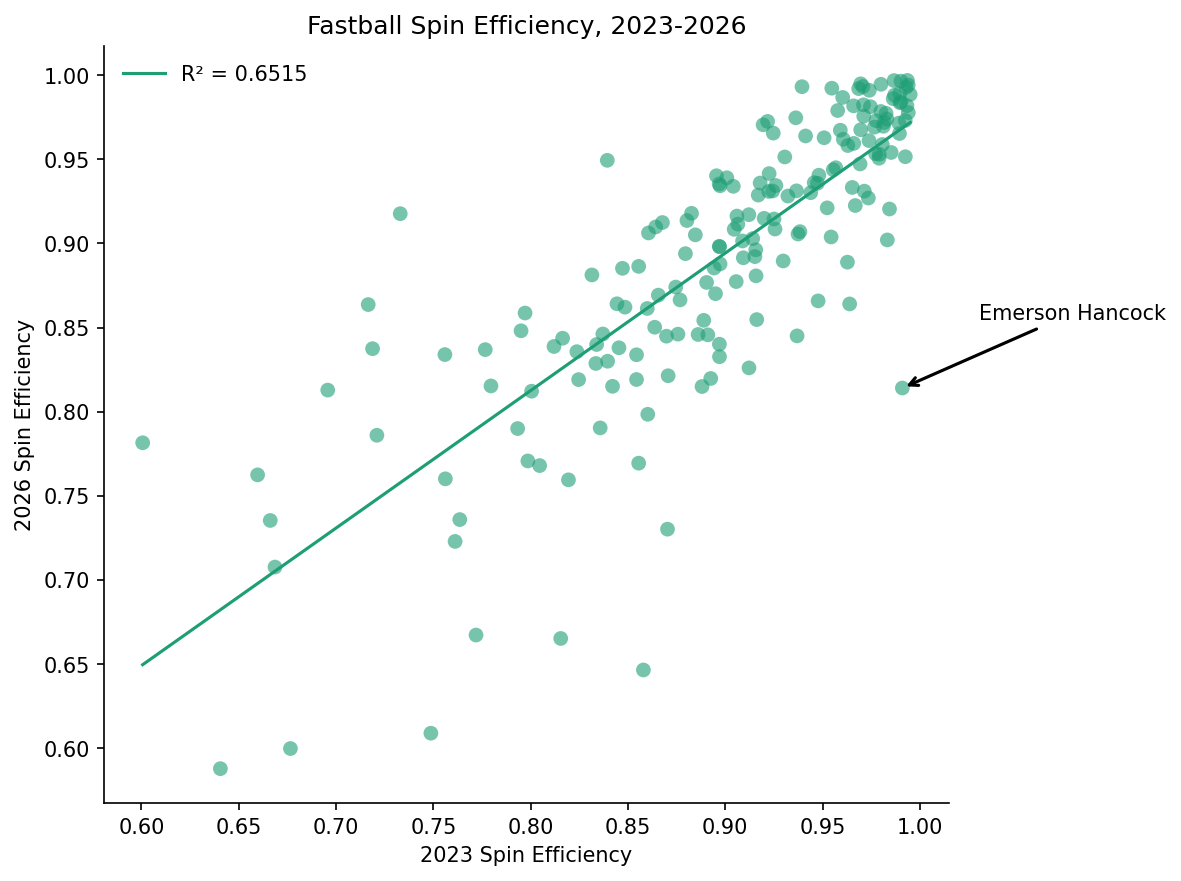
Boyle belongs to that collection of dots on the left of the plot that went from low spin efficiency to even lower spin efficiency. And then there’s one little dot all alone on the right side of the plot. That’s Emerson Hancock.
One morning, about two weeks ago, a YouTube video made me feel like I was asleep at the wheel. Ethan Moore, a former analyst with the Rockies and the Reds, had posted a video titled “Every Baseball Analyst is Missing Something Important.” I’d like to consider myself a baseball analyst, and it sounded like I might be missing something important. And so I clicked to see what that might be.
Over the span of 36 minutes, Ethan broke down a total of three pitches, all of which were thrown by Nolan McLean to Pete Crow-Armstrong in the second inning of a late September game between the Mets and Cubs. He used this plate appearance to illustrate his central claim: There is so much happening in the handful of milliseconds between the release of the ball and the swing of a bat, and that the psychology of the hitter — conscious thoughts, subconscious expectations, muscle memories — dictates the decision of when to swing, and where, and how hard. As Ethan put it, “When the ball is in the air, on the way to the plate, what is actually happening in the mind and the subconscious brain of the hitter?”
It reminded me of another video I saw a bit earlier in the spring. It featured Vinnie Pasquantino, before he captained Team Italy in the WBC, wearing a microphone during a live batting practice session against his Royals teammate Steven Zobac. It’s meant to be a short and funny clip, and it is both of those things, but I just kept thinking about Pasquantino’s subconscious. Read the rest of this entry »
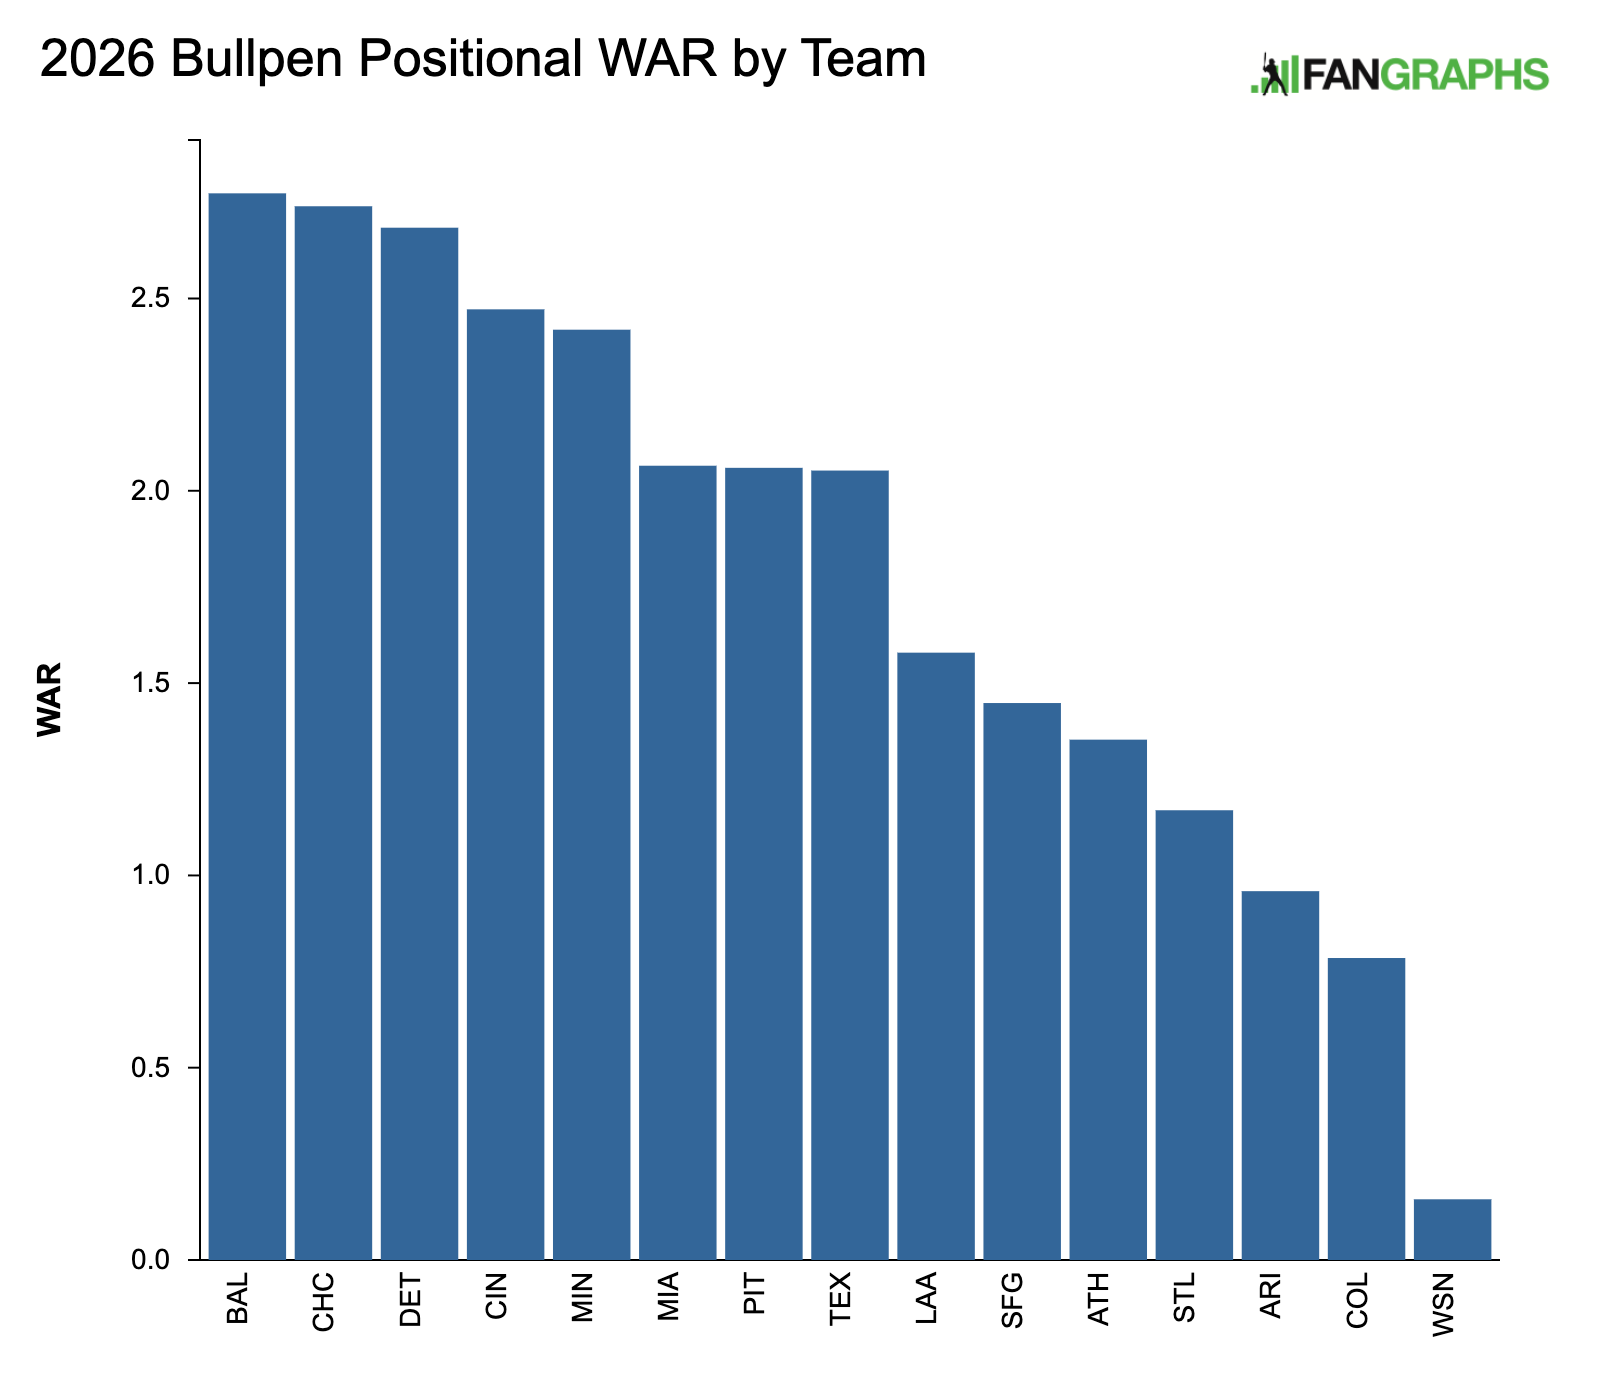
I love relievers. Sure, starters are the belles of the ball, making the big bucks and responsibly scaling back their velocity and throwing six pitches. They’ve got it all together. Not relievers. Relievers are freaky. They’ll throw it crazy-style. They’ll spam a million breaking balls. They’ll have 20-grade command, or an 85-mph fastball, or a pitch you’ve never seen in your entire life. They will burn bright and fast, and then you’ll never see them again.
These are not the best bullpens in baseball. In fact, they are the worst. But every single one has something fascinating going on inside of it. Usually, it’s more than one something. So come along with me on a journey into the deep, dark wilderness of baseball’s mediocre bullpens. This one is for the sickos. Read the rest of this entry »
When pitchers and catchers report, joy abounds. Who doesn’t love grainy cellphone video of a pitcher mounting the slab in the early days of February? But as far as I’m concerned, baseball doesn’t truly start until the first pitch plot surfaces on social media. Not much in spring training matters, but pitch data does. One or two pitches is all it takes to establish the birth of a new pitch or velocity peak. Results — ERA, strikeouts — take a while to stabilize, and in any case, they mean little in the “just trying things out” context of spring ball. But the pitch data — that’s real, man. Nobody throws a new pitch on accident. (For the most part.)
And so, like the well-adjusted baseblogger I am, I’ve spent the first week of spring games knee-deep in the data. Would you believe that as of the final day of February, there have been precisely 4,500 unique pitcher/pitch type combinations? That’s a lot of potential trends to suss out. You, reader, surely don’t want to wade through all of that, so let me present you with a handful of things that have caught my attention in the pitch plot portion of spring training. They fall into three categories: under-the-radar prospects with at least one bonkers pitch, established starters soft-launching new shapes, and relievers with limited big league time popping like potential leverage guys.
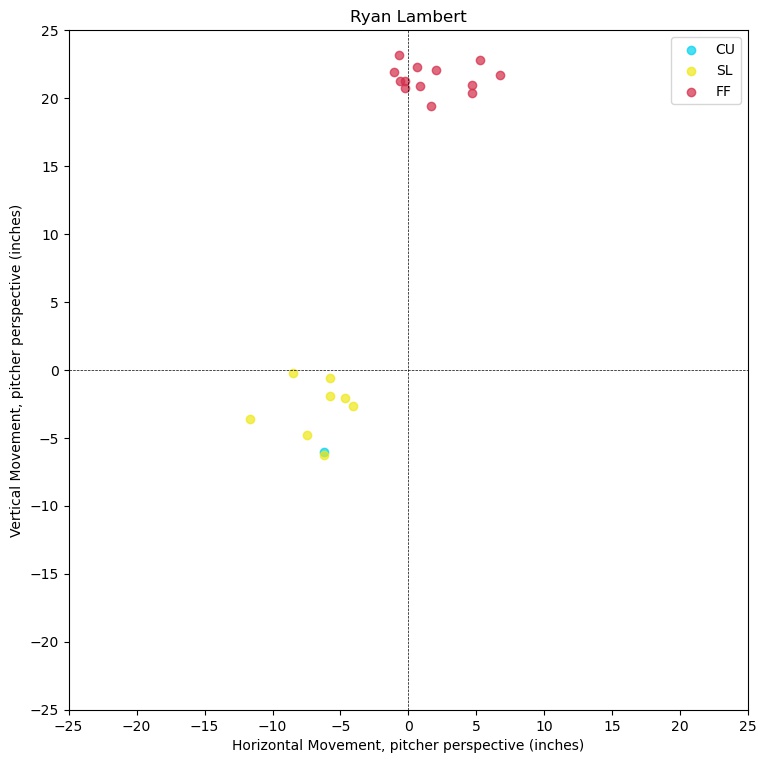
Okay, this one was slightly more under the radar before Lambert went viral for his “30 raw eggs a day” shenanigans. From that story, you surely learned that he throws a fastball with considerable velocity. But what Anthony DiComo’s excellent report elided was the shape of that fastball. In his lone spring outing, Lambert showed off a 98-mph heater with 21.5 inches of induced vertical break. Outside of Lambert’s arm, that pitch doesn’t exist. Only three pitchers topped even 20 inches of induced vertical break on their heater in 2025 — Alex Vesia, Triston McKenzie, and Yaramil Hiraldo (more on Hiraldo later) — and none of them broke 95 on the radar gun. Read the rest of this entry »
For pitchers, it’s really not optimal to show up late to spring training. Roll up to Arizona or Florida sometime in early March, and then you’re behind all your friends, still ramping up when it’s supposed to be go time. Maybe you find your form sometime in May. Maybe your season never gets off the ground. Such a fate is to be avoided, if at all possible.
And so with pitchers and catchers reporting Tuesday, Monday was, in effect, the final day to sign to ensure a regular build-up. Appropriately, there was a predictable run on the straggling starting pitchers of the free agent market. Nick Martinez went to the Rays; Erick Fedde returned to the White Sox; Chris Paddack found a life raft with the Marlins. Also, even though José Urquidy signed with the Pirates last Thursday, we’re bringing him to the party, too. Let’s talk about each of these signings in that order.
Nick Martinez Signs With Rays (One Year, $13 Million)
Martinez is the biggest name of the bunch, and he accordingly received the largest deal — $13 million for a year’s work — as reported by MLB.com’s Mark Feinsand. Of the remaining pitchers available, his 2.1 ZiPS projected WAR was third best.
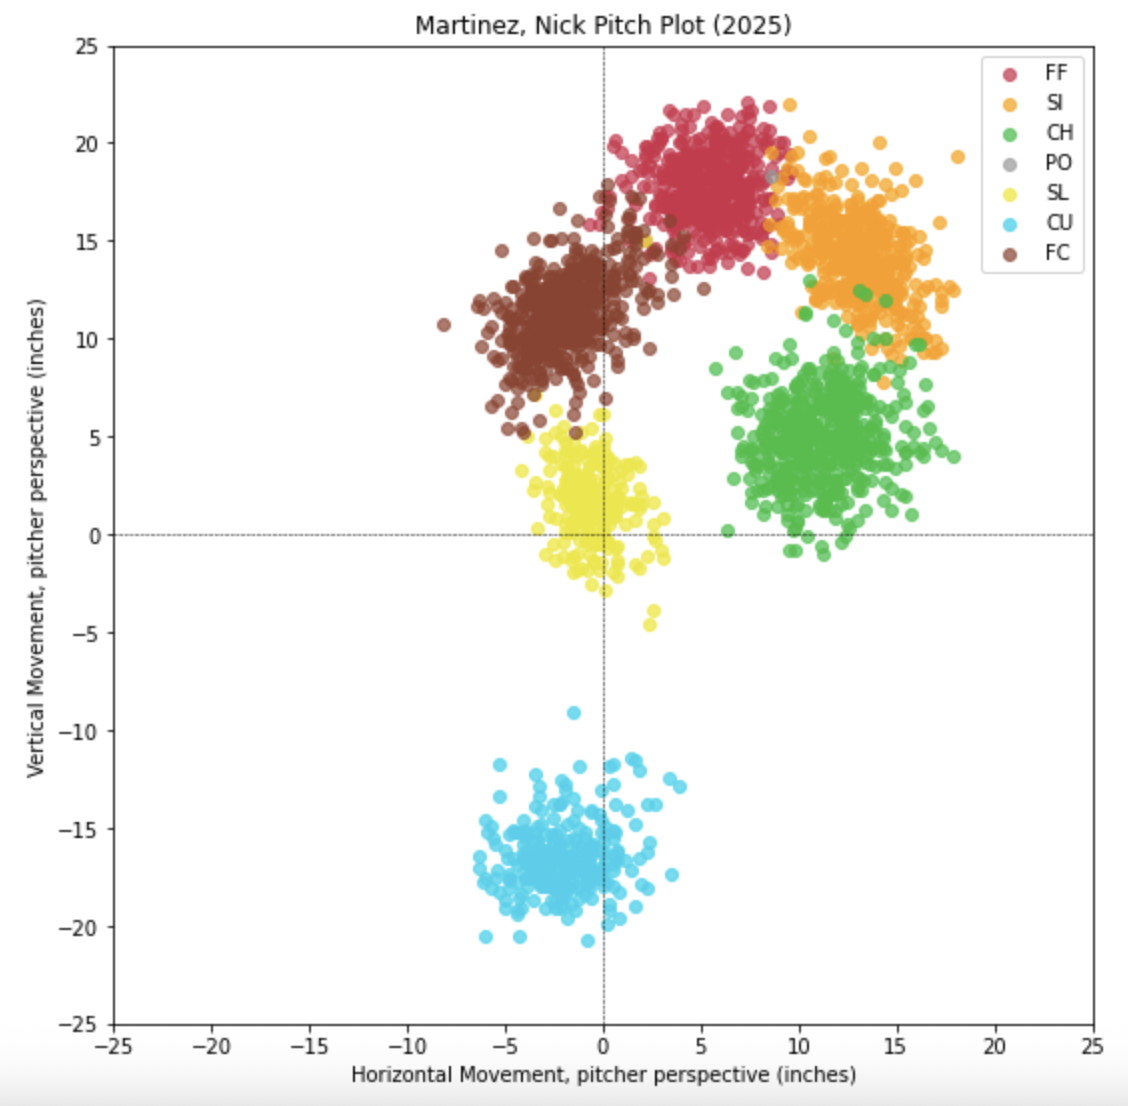
It’s unclear if he’ll assume his typical swingman role in Tampa Bay. The RosterResource crew sees him slotting into the back of the rotation, a place he thrived in the second half of 2024 with the Reds. Despite averaging just 92.6 mph on his four-seam fastball that season, Martinez leveraged a wide mix and impeccable command to deliver a 3.21 FIP over 142 1/3 innings, good for 3.4 WAR. On the strength of that campaign, he received (and accepted) the qualifying offer, bequeathing him a hefty $21.05 million for 2025.
Last offseason, I speculated that Martinez was a good candidate to repeat his surprising success due in large part to his ability to blend his pitches together. These arsenal effects, I thought, would lead to sustainable soft-contact generation, allowing for continued success in spite of a so-so strikeout rate.
In some sense, I was half-right: New arsenal metrics from Baseball Prospectus, introduced months after the publication of that article, reinforced my thesis. Martinez’s 2025 Pitch Type Probability (a measure of unpredictability) ranked in the 94th percentile among pitchers with at least 1000 pitches thrown; his Movement Spread and Velocity Spread also clocked in well above average. True to form, he limited damage on contact, holding hitters to a 34.5% hard-hit rate (90th percentile) and a .275 BABIP.
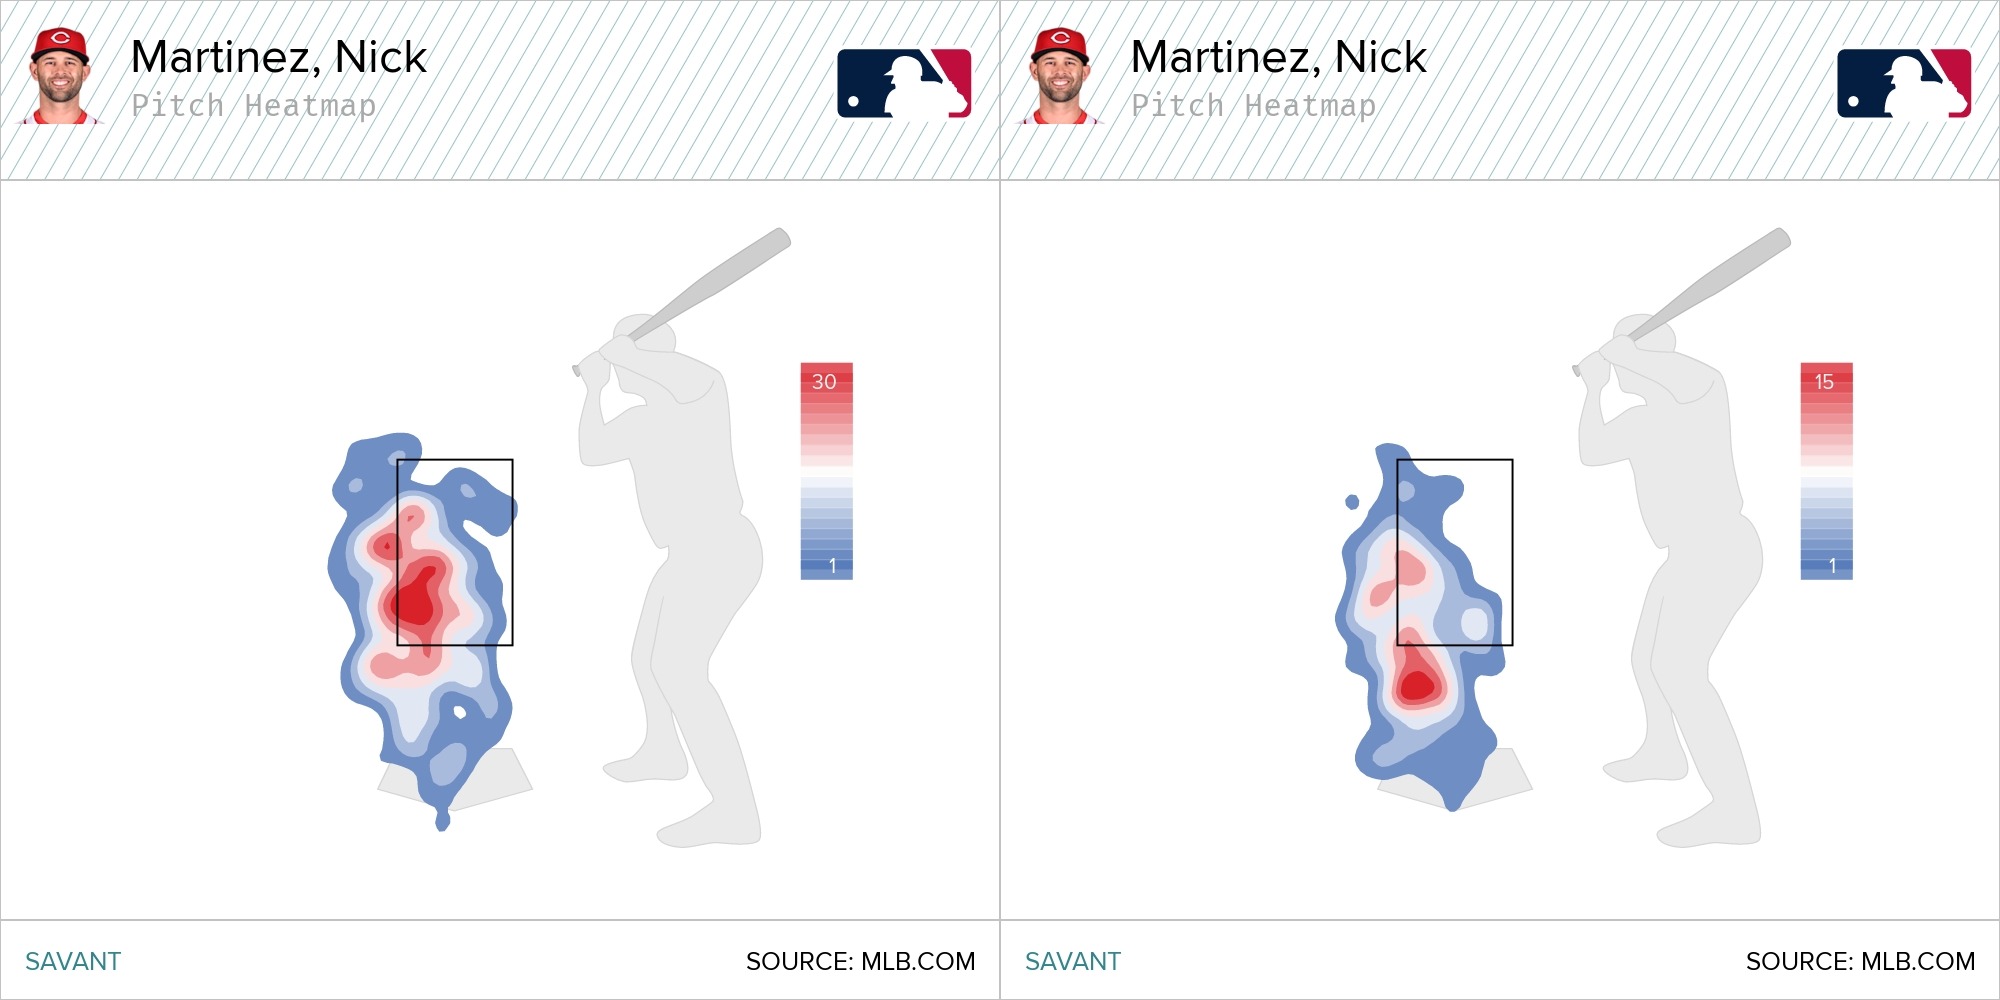
And yet Martinez’s 2025 season was a bust; his ERA jumped from 3.10 to 4.45, with the poor peripherals to back it up. After running a 3.2% walk rate in 2024, some control regression was expected. But his bat-missing went from acceptable to dire, his strikeout rate dropping nearly four percentage points. The main culprit was the changeup, which generated a huge amount of chase in 2024 and fell all the way back to Earth in 2025. The shape did not change significantly, but his command of the pitch slipped considerably. Check out how much more plate his changeup caught against left-handed hitters this season (left) versus last (right):
The changeup unlocks the entire Martinez experience, and its performance will determine whether the Rays will be getting a durable but unexciting innings-eater or a guy you might trust to start Game 3 of a Divisional Series. Either way, he improves the Tampa Bay staff for 2026, giving the team insurance against the wild whims of Joe Boyle. And in the case of a Boyle breakout, Martinez can easily shift back into his familiar swingman role.
Erick Fedde Signs With White Sox (Contract TBA)
It was mad ugly for Fedde in 2025. He started the year in St. Louis, pitching a little over 100 innings of exactly replacement-level ball; at the trade deadline, the Braves picked him up for a handful of gumballs, hoping he’d hoover up some innings in a lost season. Three weeks later, they straight up released him; the Brewers brought him in for a few mopup opportunities before hitting him with a DFA on the final day of the regular season.
That’s not what you want. Fedde’s east-west attack fell apart in 2025; excluding Rockies hurlers, his 13.3% strikeout rate was worst in baseball (minimum 100 innings pitched.) Perhaps fatally, his walk rate ballooned as he opted to pitch around hitters instead of challenging them in the zone.
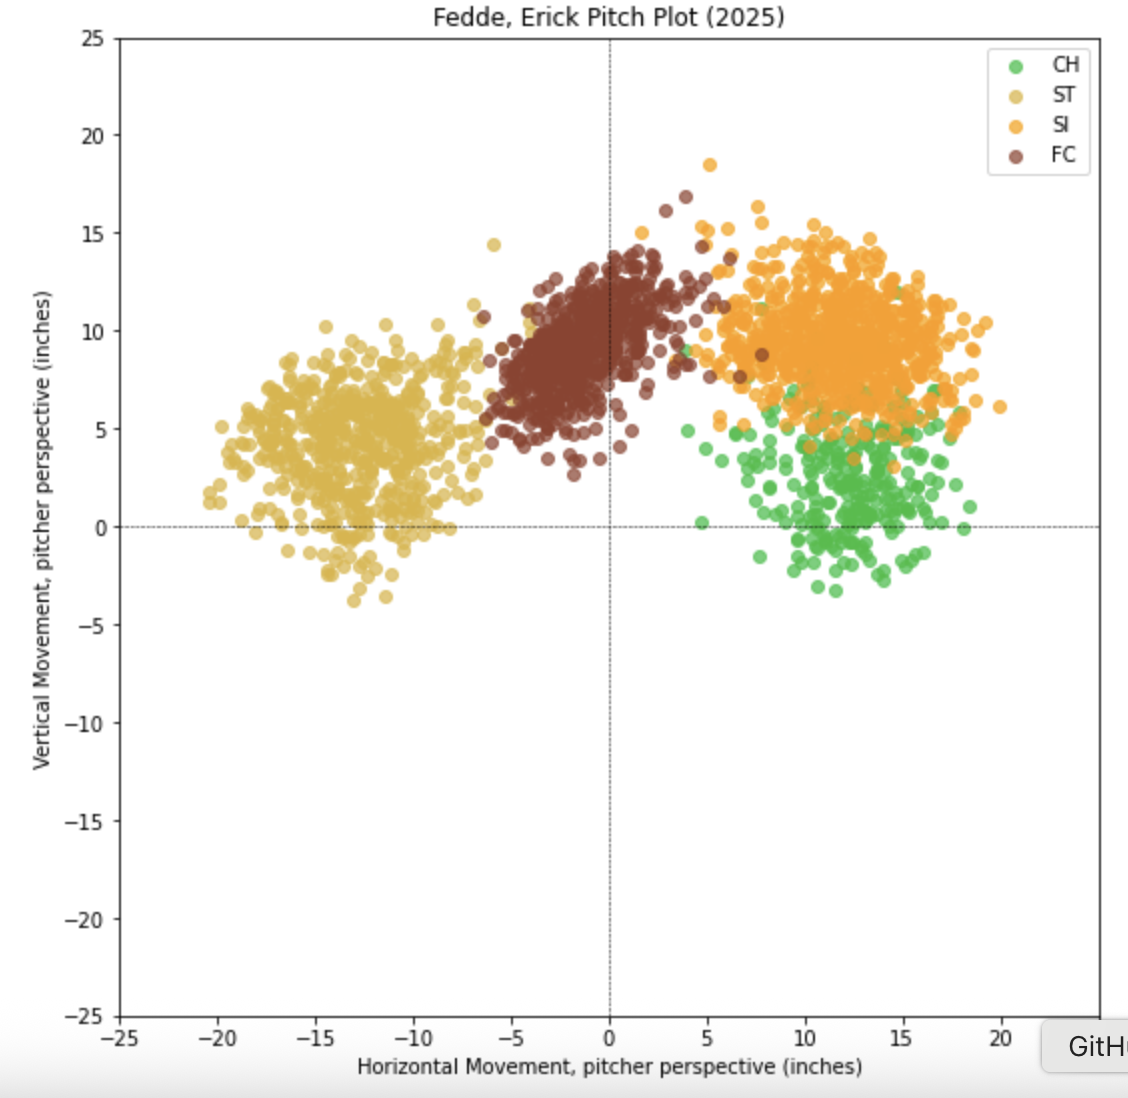
But what better place to resurrect his career? Those handful of months on the South Side in 2024 were the best he’s pitched since his triumphant return from the KBO. In 21 pre-trade deadline starts that year, Fedde bullied righties with his sinker-sweeper combo, and jammed enough lefties with his cutter to viably work his way through lineups. A 3.11 ERA earned him a deadline promotion to a contender, and he proceeded to pitch roughly as well as a Cardinal, though the team ultimately missed the playoffs.
Fedde was still pretty good against righties in 2025, but lefties smoked him to the tune of a .389 wOBA. His cutter lost a crucial couple inches of glove-side bite, and so the pitch tended to finish middle-up instead of on the inner edge. A perfectly straight 90-mph cutter is fodder for tanks; with no four-seam option on the table, Fedde was faced with the difficult choice of getting aggressive with subpar stuff or aiming at too-fine targets.
If getting back with pitching coach Brian Bannister can help Fedde gain back those two inches of break on the cutter, the White Sox can expect him to deliver on his presumably modest deal.
Chris Paddack Signs With Marlins (One year, $4 million)
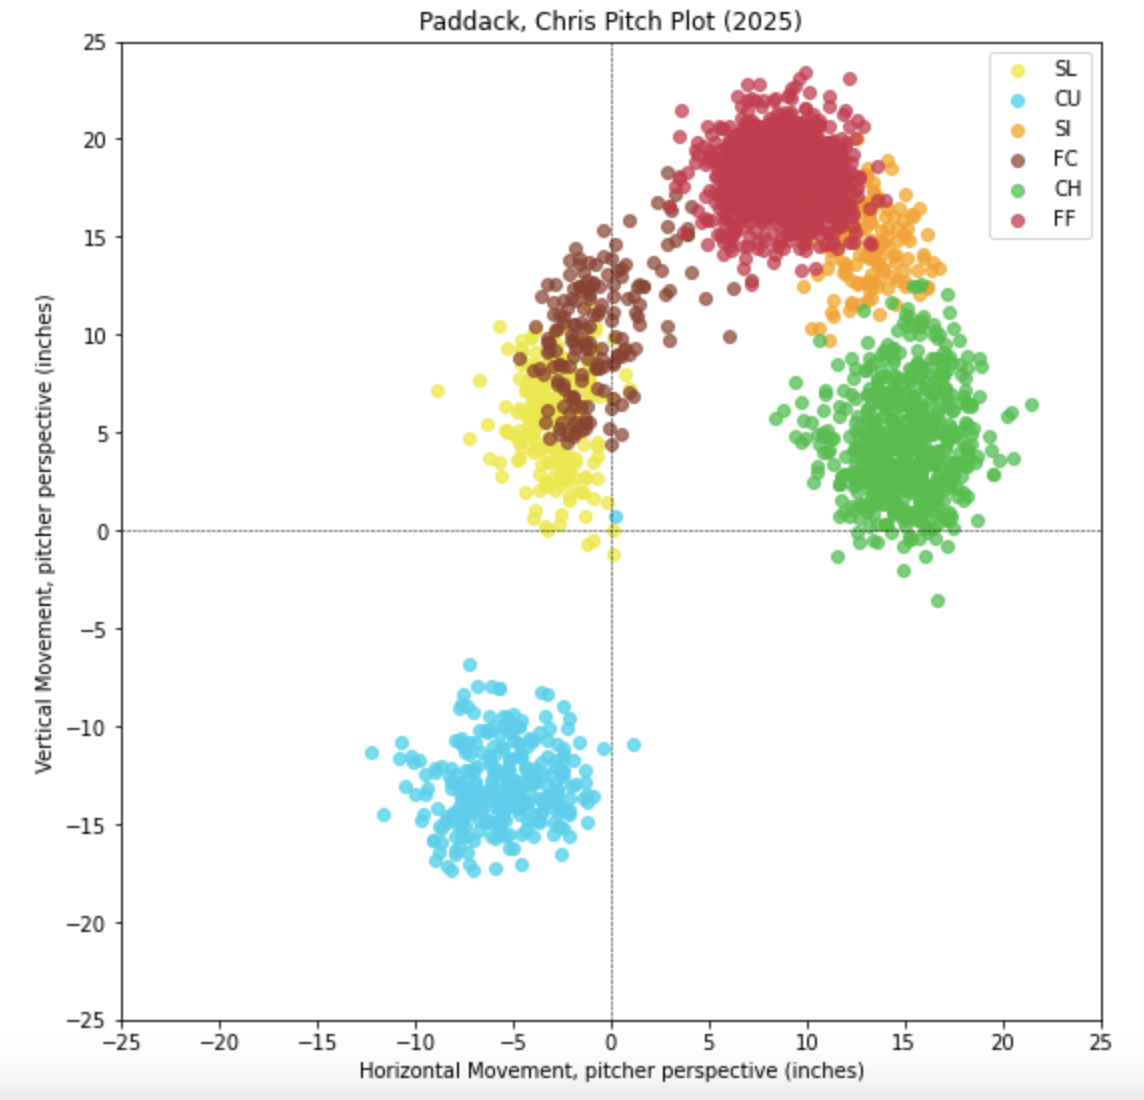
Paddack’s plan of attack is pretty straightforward, venturing not much further than a carry fastball and a butterfly changeup. When you throw a carry fastball nearly half the time at mediocre velocity, you’re going to give up a lot of home runs. So it’s been for Paddack his entire career, and never more so than in 2025, when he gave up a career-high 31 chucks across his 158 2/3 innings of work.
With Martinez and Fedde at least, you can squint at them and see an unlikely path to a 3-WAR season. Paddack, however, presents no such upside. He is what he is: a guy with reliably excellent command and not enough stuff to miss bats or stay off barrels. This blurb is already pretty negative, but still, I must admit that I am surprised that he received a guaranteed big league deal. (And for $4 million, no less.)
I’m not even really sure I understand this signing for the Marlins. RosterResource projects this signing to kick Janson Junk into a long relief role. Junk is, to my eye, a better version of Paddack, featuring similarly excellent command and a carry fastball from a high arm angle. But Junk can throw a pretty good breaking ball; Paddack’s extreme pronation bias prevents him from spinning the ball with any effectiveness. Unless the Marlins are planning to imminently ship out Sandy Alcantara, I don’t see what Paddack brings to their club at present. Perhaps he could work as an unconventional relief arm, throwing only fastballs and changeups.
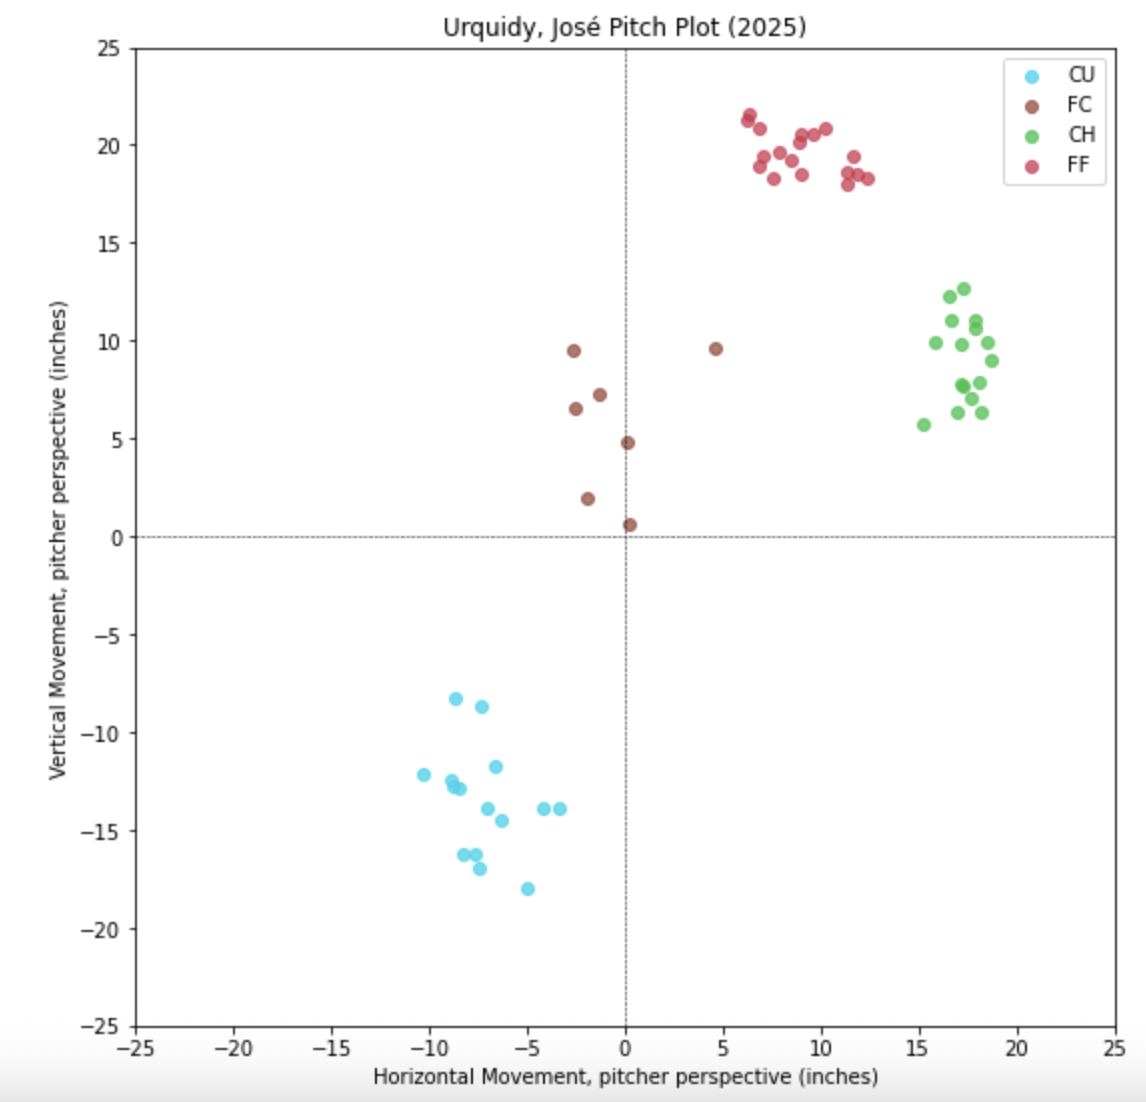
José Urquidy Signs With Pirates (One Year, $1.5 million)
Remember him? Urquidy’s last full season of work was all the way back in 2022, when he racked up 164 1/3 innings for a World Series-winning Astros club. In the three years hence, he’s battled shoulder problems and then, finally, a torn elbow ligament, causing him to miss the entire 2024 season and nearly all of 2025.
Crucially for the purposes of providing analysis in this blurb, Urquidy did briefly resurface in Detroit for 2 1/3 innings of work in September, allowing us to compare his stuff to where it was before the injury. Surprisingly, it was mostly the same. Both before and after, Urquidy possessed a four-seam fastball with crazy carry (nearly 20 inches of induced vertical break), a changeup with respectable vertical separation, and a slow two-plane curveball, and his fastball velocity was nearly identical, 93.1 mph in 2023 and 93.0 mph in 2025. But there was one pivotal difference: Urquidy’s sweeper, which was completely incongruous with the rest of his arsenal and racked up a bunch of whiffs in 2023, did not resurface in his brief big league stint last year.
Like Paddack, the arsenal characteristics (93-mph carry fastball) will ensure a bushel of tanks. Can Urquidy limit damage around the homers enough to hold the fort down until the return of Jared Jones? I think it might come down to the state of that sweeper. Otherwise, I’m not sure he has an out pitch against same-handed hitters. As far as backend bets go, there are worse ideas than giving $1.5 million to a guy who reliably beat his FIP for years prior to the injury. The Pirates aren’t asking for much, and Urquidy seems reasonably likely to meet those low expectations.
In his pitch models piece, Davy outlined in four bullet points what happens when one team gains an edge over the others:
Teams realize the immense value of a skill.
An arms race ensues as they scramble to cultivate it.
The skill becomes widespread across the league.
Since the skill is more evenly distributed, it loses much of its value.
“The second we gained the ability to calculate the value of catcher framing, everybody started working on it,” he wrote. No longer was Ryan Doumit allowed to work behind the plate once it became clear he was capable of leaking 60 runs of value in a single season. Davy produced this helpful plot to demonstrate this convergence of catcher framing value, the Competitive Advantage Life Cycle in action:
All the teams are smart now. Even the Rockies might be smart! Even in areas that ostensibly look like pockets of inefficiency — reliever contracts, for example — there is likely some sort of internal justification for the behavior. Once something can be quantified, the serious outliers disappear. Right?
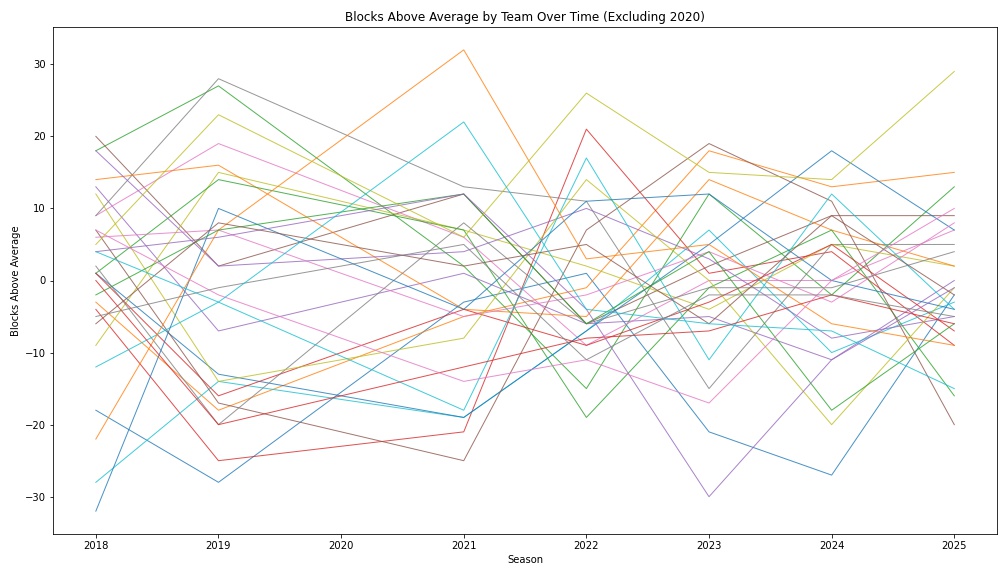
Maybe not quite. Three years ago, catcher blocking statistics surfaced on Baseball Savant, though teams surely were measuring this skill internally for years prior to its public introduction. Has there been a general convergence in the years since? To some degree, yes. Here is the blocking equivalent of Davy’s plot, with Savant’s “blocks above average” metric on the y-axis. There isn’t a clear clustering trend like in the framing case, but the middle of the pack appears a touch tighter.
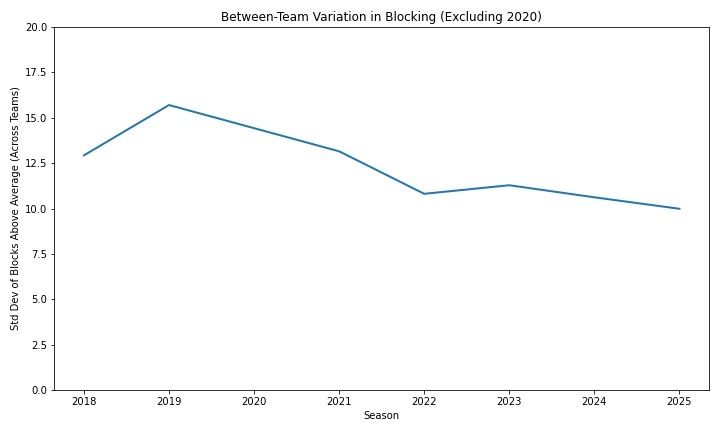
Measured as the standard deviation between teams, the trend is a little clearer. Slowly but surely, teams are beginning to converge.
But the catcher blocking revolution is a tentative one. While it’s moving in the right direction, it’s too soon to say the arms race is fully on. To wit: Last year was the worst catcher blocking season in recorded history.
Though Savant introduced the metric publicly in 2023, they have in the years since provided data going back to 2018. Between 2018 and 2025, there were 538 qualifying catcher seasons. Agustín Ramírez’s -28 blocks below average last year ranked 538th among that cohort. It should noted that blocks above average is not a rate stat; he did all that in just 73 games behind the dish.
The slower convergence on blocking is, I think, understandable. Of all the things a catcher does, it’s among the least sexy. Framing, naturally, has received most of the attention from analysts over the last decade or so; it tends to comprise the plurality of catcher defensive value, even in this phase of the Competitive Advantage Life Cycle. Throwing runners out, meanwhile, gets the most love on broadcasts, and it’s the easiest to spot.
Blocking sort of falls between those two catcher activities. It’s somewhat visible, but the difficult blocks happen relatively infrequently. And the value is muted: Savant estimates each block above (or below) average grades out to a quarter of a run. Even Ramírez’s record-breaking season, then, only resulted in -7 runs of blocking value. By comparison, it isn’t all that remarkable to lose seven or more framing runs; eight catchers bested (worsted?) that mark in 2025 alone.
Additionally, there is not much blocking discourse. What distinguishes a good block from a great block? How much is a block worth? Who is the best at this skill? I don’t think there is a common consensus on these questions.
Defined as it is by Savant, blocking is, in some sense, the fundamental task of catching. Only a subset of all pitches are potentially “framable.” Catching a runner stealing is even less common. But on nearly every single pitch, the catcher must catch the ball. It’s right there in the name! Catcher!
For a full-time catcher, that comes out to tens of thousands of pitches in a single season. Perhaps you are saying, ‘OK, how many of those are actually hard to catch?’ I submit that they all are; professional catchers just make it look easy. Imagine a moderately athletic young person was thrown into a game to catch for nine innings. They’d miss hundreds of pitches. To catch in the major leagues, you cannot miss hundreds of pitches. You need to catch them all.
Compared to the general population, Ramírez is an amazing catcher. He saw thousands of pitches with crazy velocity and mind-bending spin and caught nearly every one. But he did not catch them all. In fact, he made a mess of many catchable pitches in the 2025 season. On Savant, the “blocks above average” statistic is described thusly:
Every pitch is assigned a probability of being a passed ball or wild pitch based upon several inputs, most notably: pitch location, pitch speed, pitch movement, catcher location, and batter/pitcher handedness. Based on that knowledge, each pitch a catcher receives (or fails to) is credited or debited with the appropriate amount of difficulty. For example, if a catcher blocks a pitch that is a PB + WP 10% of the time, he will receive +0.10. If he blocks a pitch that is a PB + WP 90% of the time, he will receive +0.90.
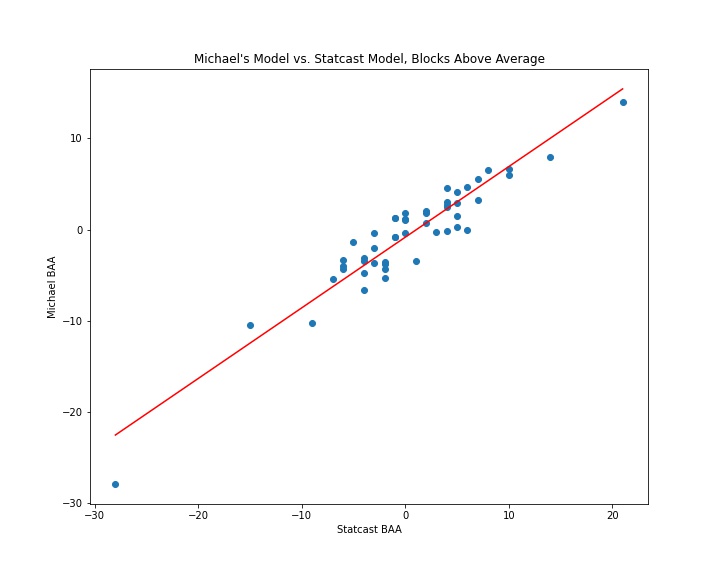
I wanted to better understand what this looked like in practice, so I tried to recreate the Statcast model from scratch and apply it to all the pitches in the 2025 season. I was not privy to some of the inputs of the Statcast model, such as the positioning of the catcher, and my physics knowledge was not robust enough to calculate where a spiked pitch intercepted the ground, as Tom Tango did in this explainer post.
What I do have access to, however, is Python, and a just-good-enough knowledge of machine learning techniques. I started with pitch location, release position, pitch movement, and velocity as my predictor variables. At first, it was terrible. But after some trial and error, I landed on a CatBoost framework, and the resulting model came surprisingly close to reproducing Tango’s model. While it slightly underrated the likelihood of wild pitches, it nonetheless correlated nearly identically with the Savant leaderboard at the individual catcher level (0.9 r-squared).
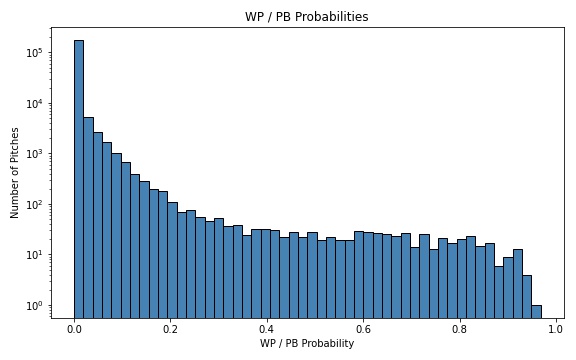
Once I had a good-enough approximation, I set out to better understand the spectrum of wild pitch/passed ball probabilities. Out of nearly 200,000 pitches with runners on base in the sample, just 198 graded out as both a) having a less than 1% chance of being a wild pitch or passed ball, and b) ultimately becoming a wild pitch or passed ball. Here is the general distribution:
Of those 198 extremely unlikely passed balls/wild pitches, 12 can be attributed to Ramírez himself. Funnily enough, he actually graded out as a roughly average framer. But his framing focus, I believe, may have led to some of these inexcusable passed balls. Apologies to the man, but I compiled a reel of his lowlights that can be seen below:
(There is hope yet for Ramírez. Shea Langeliers finished with -26 BAA in 2024; his framing declined in 2025, but his blocking graded out as bang-on average.)
One way to lose lots of blocking value is to whiff on these sorts of catchable offerings, but catchers can make up ground by smothering difficult pitches. Here’s the best block of the year, according to my model, which gave Austin Wells just a 14% chance of corralling this splitter. Leverage isn’t considered here, but it must be noted that this block literally saved the game; the Yankees went on to win in 11 innings:
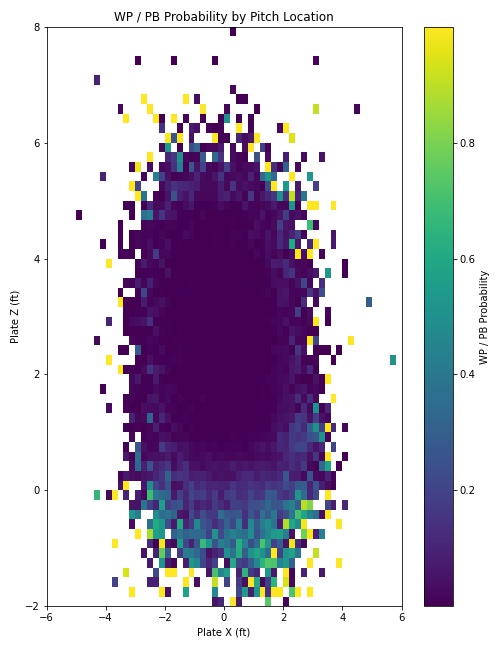
Wells is a decent blocker, but he is far from the best. That honor goes to Alejandro Kirk, who excels not just at limiting mistakes, but also wrangling unruly breaking balls in the dirt. As this plot shows, the highest probability wild pitches/passed balls live down there:
Kirk is able to smother these types of pitches better than anyone in the league. Watch him make easy work of this 89-mph knuckle-curve in the dirt:
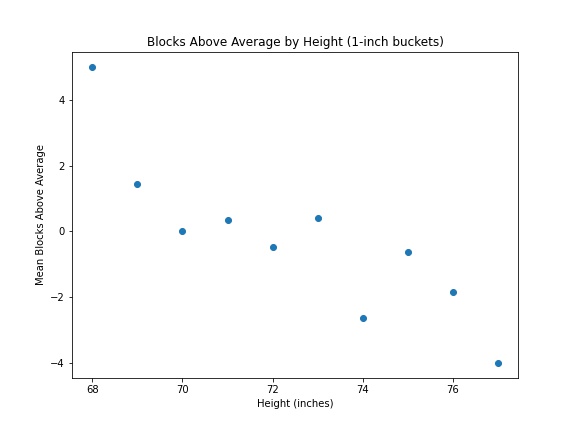
One thing to know about Kirk: He’s short (for a baseball player, anyway.) He’s got a low center of gravity, and he gets down to block those pitches. Does being short help you succeed at blocking? It seems like there’s at least some evidence that’s the case:
For now, Kirk is the reigning king of blocking, and Ramírez its court jester. Give it a few years — say, by 2030 — and blocking will likely find itself in the same place as framing, eliminating itself of Doumit-y characters, anything that reeks of serious lost value. All the mess gets filtered out eventually. As of now, we find ourselves in a purgatorial phase of the Competitive Advantage Life Cycle. Enjoy the imperfections while they last.
Thanks to Stephen Sutton-Brown for technical assistance.
Most free agent contracts are relatively easy to predict. Calculate the going rate for a single win, multiply it by the player’s projected wins above replacement over the length of the deal, and the result will come pretty close to the actual contract. This generally holds true for every type of player save one: the humble relief pitcher.
The Mets gave Luke Weaver $22 million for two years. The Tigers gave Kenley Jansen $11 million for his age-38 season. The Reds gave Emilio Pagán two years and $20 million, with the second year a player option. Run all of the reliever contracts signed this offseason through a dollars per win calculation, and they’re almost uniformly going to come out looking like terrible deals.
The sport appears to be smarter than ever, and yet teams keep shelling out gobs of guaranteed money on bullpen arms who hardly ever top 2 WAR. What’s their problem? Well, maybe teams have collectively decided to behave irrationally in one specific market, but I don’t think it’s that. I think teams are behaving as rationally in the reliever market as any other, but they happen to be using a different metric for evaluating reliever deals. The relevant metric, I think, isn’t dollars per win, but something like championship win probability added. Read the rest of this entry »
Patrick Gorski, Darren Yamashita, Mark J. Rebilas-Imagn Images
At first, it was a trickle. A Gregory Soto here, a Hoby Milner there. On Tuesday, though, we were staring down a veritable deluge. In a single day, the low-to-mid-tier short-term left-handed pitching market got ransacked like a Ralph’s on the Wednesday before Thanksgiving. In rapid succession, three cromulent southpaws inked deals. First, it was Caleb Thielbar, returning to the Cubs on a one-year pact. Foster Griffin followed, lured back from Japan by a $5.5 million guarantee from the Nationals. Finally, Caleb Ferguson linked up with the Reds, also for a single year. (Later on Tuesday, Drew Pomeranz joined the party; he agreed to a one-year contract with the Angels, which be covered in a separate post.) Let’s assess each of these deals in the order in which they signed:
Caleb Thielbar
When Thielbar appeared on one of these roundups around this time last year, it was under sorrier circumstances. The weathered middle reliever had just dropped a stinker, walking 11.1% of hitters on his way to 47 1/3 innings of a 5.32 ERA. The Cubs handed him a “here’s your last chance” $2.75 million; given that Thielbar was heading into his age-38 season, another shoddy campaign would’ve likely marked the end of a surprisingly successful career for the former 18th rounder.
Instead, the wily veteran innovated his way out of a hole, adding a new pitch and delivering a vintage Thielbar performance. The terms of his deal have not yet been disclosed, but considering that many relievers this offseason have signed for more money than they were expected to get, Thielbar almost certainly received a healthy raise to keep playing ball for a living.
In 2025, his strikeout rate remained down a few points from his 30ish% peak, but Thielbar got his command back, in part due to his decision to replace a good chunk of his big old sweepers with a tighter, cutterish hard slider. The slutter (sorry) was a genius bridge between his three other pitches, which are all relatively easy to identify out-of-hand. By adding a pitch that he could conceivably tunnel with his four-seamer, curveball, and sweeper, he seems to have increased the effectiveness of his entire arsenal.
See all of those yellow dots on the pitch plot above? That pitch did not exist before this year. In 2024, Thielbar primarily attacked lefties with the sweeper, throwing it 55% of the time in same-handed matchups. A pitch with all that movement — 14 inches of horizontal movement on average — is hard to land for strikes. His new slider doesn’t have that sort of crazy break, and he had a much easier time throwing it in and around the zone.
And it wasn’t just a chase pitch to lefties. Thielbar also used the new slider as a soft-contact generator against right-handed batters, jamming them inside with respectable velo and glove-side break:
Otherwise, it was vintage Thielbar, slinging slow, high-ride fastballs and some of the prettiest curveballs in the sport. He handled righties and lefties alike, and will assume a similar role in the Chicago bullpen, navigating medium-high leverage situations, particularly when that leverage context coincides with a run of lefties.
Foster Griffin
Last we saw of Griffin stateside, it was 2022, and he was languishing in Quad-A limbo, making brief cameos with the Royals and Blue Jays before hopping on a bus back to Omaha or Buffalo. Back then, he was a fringy bullpen arm, leaning on a cutter with a movement profile that coincidentally resembled Thielbar’s new slider. On top of the cutter, Griffin featured a dead-zone four-seamer at 93 mph, a pretty standard curveball, and a changeup with some quality arm-side fade.
The uninspiring stuff and varied arsenal felt more befitting of a backend starter, and starting is exactly what Griffin took to with the Yomiuri Giants, where he pitched some excellent ball for three seasons. The final was his finest for the Tokyo-based club. He posted the third-best FIP (1.78) among NPB hurlers with at least 70 innings pitched, striking out a quarter of hitters and allowing just a single home run.
What changed? For that, I’ll hand it over to James Fegan, who wrote up a little blurb on Griffin for The Board:
The addition of a low-80s splitter is the profile-changing development since the last of Griffin’s eight career big league innings. Its raw action won’t knock you out of your chair, but it flirted with a 50% miss rate this past season because Griffin almost never leaves it in mistake locations. His steep approach angle makes the pitch nearly impossible to lift, allowing Griffin to allow fewer home runs (18) in over 300 innings in Japan than he gave up in his last full season in the PCL (20) in 2019. Even topping out at 93 mph now, this is still too much of a nibbling profile to project him beyond a multi-inning swingman role. But now that he can wield his splitter as an out pitch to either side, it’s easier to see Griffin carving out a Tyler Alexander-shaped niche at the end of a pitching staff.
The prospect team gave Griffin a 35+ FV grade, suggesting he is unlikely to do much more than hoover up innings for the Nationals. But if there’s a club in need of some innings-hoovering, it’s the Nats, who have a bunch of question marks on the staff after MacKenzie Gore, and that’s assuming they hang onto Gore, which, who knows.
Caleb Ferguson
The second left-handed Caleb in this roundup is 10 years younger than his predecessor. Once a whiff chaser with shaky command, Ferguson leaned hard into contact suppression in 2025, scaling back his four-seamer against same-handed hitters while boosting the sinker to nearly 50% usage. At times, this worked great. His strikeout rate dropped over eight percentage points, but the heavy combination of sinkers and cutters gave Ferguson some of the lowest barrel rates and exit velocities in the league.
Chasing weak contact as a relief pitcher can be a blessing and a curse. Attacking the zone with three fastballs keeps the walks down and the extra base hits to a minimum. But it also means a big chunk of balls in play, and one day the BABIP gods will rise with vengeance and rain misery upon your poor ERA. Unfortunately, this happened to Ferguson at a crucial juncture. Plucked from Midwestern obscurity in Pittsburgh and thrust into a playoff push in Seattle, he initially performed well before running into a spate of poor performances in late August and early September. In a tight postseason race, that was that — Ferguson didn’t get many leverage opportunities for the remainder of the season, and his brief playoff work went terribly. Brought in to close down a seven-run lead in the ninth inning of ALDS Game 3, Ferguson allowed three runs without recording an out, requiring Dan Wilson to throw Andrés Muñoz on a day that he could’ve secured some crucial rest. It cannot be great for a reliever to get shelled on a big stage in his final moments before hitting the free market.
For most of his Mariners tenure, Ferguson was treated like a member of the B team, deployed mostly in losing efforts. Will the Reds, themselves a recent playoff club, trust him to handle leads in close games? It’s sort of on the edge. RosterResource sees Ferguson as the fourth arm out of the pen, behind Emilio Pagán, Tony Santillan, and Graham Ashcraft. Astute readers will note that all three of those guys throw baseballs with their right arm, and so Ferguson will assume the mantle of Most Trusted Lefty, prying that loosely held title from Sam Moll’s fingertips.