Research – What if everything was equal?
The article I wrote about Juan Padilla being the luckiest pitcher in baseball got me thinking that maybe combining the three statistics of BABIP, HR/FB, and LOB% was not the best way to display a pitcher's overall “luck”. So instead of championing “Luck Factor” as a useful stat, I'm going to make a “luckless” ERA or luck independent ERA (iERA) which will have better practical applications. The formula is actually pretty simple:
iERA = ( ((.3627 * IP) – (.1287 * K) + (.1408 * FB) + (.3 * BB)) * 8.28) / IP
Basically this formula was the result of a bunch of relatively simple algebra on the three “luck” statistics HR/FB, BABIP and LOB%. Instead of solving each formula for each player, I plugged in the major league average for each, and proceeded to find out how many home runs, hits, unearned runs, and finally earned runs a player would have if everything was equal. This formula should normalize ERA for park, league, and in some sense, competition. In other words, it gives a pitcher's ERA as if all pitchers pitched under the same conditions.

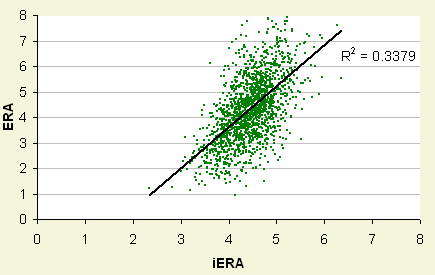
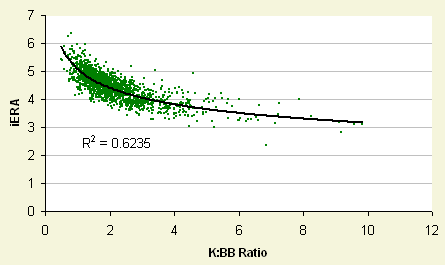
Let's take a look at how iERA compares to regular ERA. Naturally there is some correlation here, but the correlation isn't that great. I just did this to make sure they were actually measuring two different things, and they do. What iERA does have a high correlation with is a pitchers strikeout to walk ratio. Not much of surprise here as strikeouts and walks (and fly balls) are what sets pitchers apart in iERA.

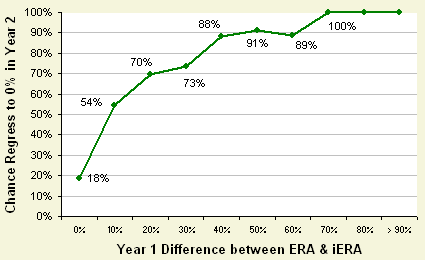
So you're probably asking, why should I care about a pitcher's iERA? It's actually quite good at telling you how lucky a pitcher was in any particular year. As you can see, once a player's ERA and iERA start to differ by more than 20%, there's about a 75% chance that his ERA and iERA will be closer the following year. Once you start to see a difference in ERA and iERA over 70%, it's pretty much a given that his ERA and iERA will be closer the next season.

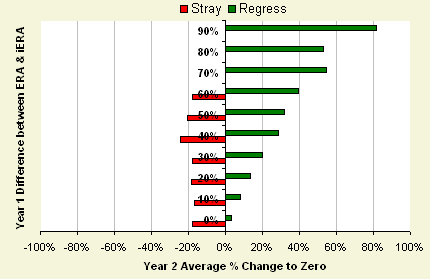
Furthermore, the amount that a player's ERA will revert to iERA is somewhat a function of how far it deviated in the first place. Player's don't tend to stray from a 0% difference in ERA and iERA much further than 20% on average.

So just for kicks, let's take a look at some of the bigger discrepancies in iERA and ERA the past four years and see what they've done the following year. Here are 5 starters and 5 relievers that had a much lower ERA than they did iERA in 2004.
		2004			2005
Name		ERA	iERA	% Dif	ERA	iERA	% Dif
Joe Nathan	1.62	3.80	-81%	2.70	3.65	-30%
Mike Gonzalez	1.25	2.83	-78%	2.70	4.15	-42%
Steve Kline	1.79	4.00	-77%	4.28	4.67	-9%
Luke Hudson	2.42	5.07	-71%	6.38	5.25	19%
Akinori Otsuka	1.75	3.62	-70%	3.59	4.19	-15%

		2004			2005
Name		ERA	iERA	% Dif	ERA	iERA	% Dif
Jake Peavy	2.27	3.83	-51%	2.88	3.56	-21%
Al Leiter	3.21	5.07	-45%	6.13	5.41	12%
Bruce Chen	3.02	4.66	-43%	3.83	4.51	-16%
Carlos Zambrano	2.75	4.02	-38%	3.26	3.91	-18%
Tomo Ohka	3.40	4.81	-34%	4.04	4.63	-14%
Each of them did see an increase in their ERA and they all saw a drastic reduction in the percent difference between their ERA and iERA. Now let's take a look at the players that had a much higher ERA than iERA.
		2004			2005
Name		ERA	iERA	% Dif	ERA	iERA	% Dif
Lance Cormier	8.14	5.12	46%	5.11	4.46	14%
Sergio Mitre	6.62	4.22	44%	5.37	4.17	25%
Mike Wood	5.94	4.37	30%	4.46	4.78	-7%
Brian Fuentes	5.64	4.32	26%	2.91	3.84	-28%
Neal Cotts	5.65	4.39	25%	1.94	4.25	-75%

		2004			2005
Name		ERA	iERA	% Dif	ERA	iERA	% Dif
Casey Fossum	6.65	4.61	36%	4.92	4.50	9%
Derek Lowe	5.42	4.19	26%	3.61	3.69	-2%
Joaquin Benoit	5.68	4.42	25%	3.72	4.74	-24%
Brett Myers	5.52	4.48	21%	3.72	3.75	-1%
Scott Kazmir	5.67	4.62	20%	3.77	4.60	-20%
All of these pitchers saw a decrease in ERA, some more drastic than others. Neal Cotts had a very high ERA and iERA difference in 2005, which will certainly revert in 2006. Brian Fuentes also showed a very big difference in ERA, but notice that it was also reflected in his 2005 iERA. Here's the last list of pitchers which showed a very large difference in ERA and iERA for 2005.
Name		ERA	iERA	Dif
Juan Padilla	1.49	4.74	-105%
Mariano Rivera	1.38	3.38	-84%
Chad Cordero	1.82	4.36	-82%
Huston Street	1.72	4.02	-80%
Cliff Politte	2.00	4.52	-77%

Name		ERA	iERA	Dif
Tim Redding	10.57	5.51	63%
Alan Embree	7.62	4.28	56%
Greg Aquino	7.76	4.39	56%
Ryan Wagner	6.11	3.60	52%
Paul Wilson	7.77	4.91	45%
I'd like to emphasize that just because there is a large discrepancy between a pitcher's ERA and iERA doesn't mean that pitcher still can't be very good or very bad the next season. It just means that there's a high probability that pitcher will have an ERA much closer to his iERA the following season. If you subscribe to the theories of BABIP, HR/FB, and LOB% (and even if you don't), I think you'll find iERA a useful tool as it essentially combines the three of them into one simple stat that you can compare with any player's actual ERA to get an idea of how “lucky” a player was in a single season.
Update: Just a quick addendum, I've been told that iERA is essentially a pre-existing stat called xFIP. I was aware of just FIP, but I wasn't so aware of xFIP. I think xFIP might be a little better (even though the two are VERY close). If you're interested in xFIP, I'll point you over to the article: I'm Batty for Baseball Stats over at the Hardball Times.
David Appelman is the creator of FanGraphs.
Where calculate % Dif?