The Seattle Mariners Should Hit Better

The Seattle Mariners are enduring a pretty miserable season. After last year’s stinker, the Mariners have followed it up with a .438 winning percentage and a pace-worthy of a scant 71 wins. Well, buck up West Coasters, because the Seattle Mariners should hit better through the season’s end!
In fact, the Mariners should be hitting a whopping 29% better.
For several weeks now, I’ve been playing with fielding-independent-hitting tools, specifically the aptly-named Should Hit metric.
Should Hit (ShH, for short) has a variety of uses, though its best used as a BABIP regressor. For your perusal, I created ShHAP!, a Google Doc that’s free for the world to download and allows anyone to regress a player’s present season (or any stretch of statistics), according to a different BABIP.
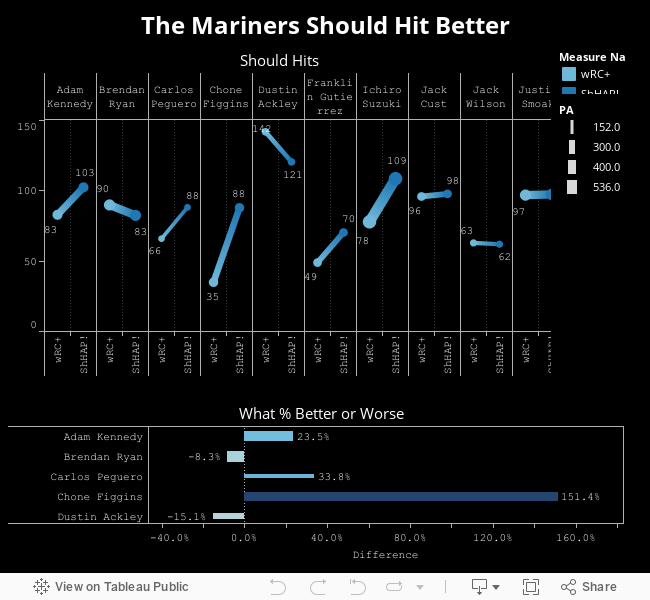
Well, today, let’s put this tool to use and look at the Mariners.
The following table shows us a comparison of each player’s hitting (as per wRC+, weighted runs created plus) and their ShHAP! (what their wRC+ should be, given their career BABIP).
The dark blue segment of each line is their ShHAP!; the light blue is their present wRC+. For Dustin Ackley and Carlos Peguero, I used their rest-o-season ZiPS projections for their BABIP — because they have so few career PAs, their ShHAP! and wRC+ would otherwise be identical.
Also, the size of a player’s 2011 PAs determines the thickness of the bars (I used a minimum of 150 plate appearances). The thicker the bar, the more reliable the ShHAP! projection.
NOTE: You might need to refresh the page to see the Tableau document. If you continue to have trouble seeing it, try going here.
Noteables:
- —Chone Figgins, according ShHAP!, should be hitting much, much better. The problem is his BABIP has been crazy-low since moving to Seattle. Maybe he’s just too old. Maybe he’s struggling with some crazy injury. He’s actually hitting better at Safeco than away from it this year, so it’s hard to say exactly why his BABIP has cratered. If it does return, though, ShHAP! still sees a sub-par performance in his future.
- –I wrote a few weeks ago about Ichiro Suzuki and how I expected him to recover his former BABIP and then start hitting better. Well, now I have a number I can put to that expectation: 109 wRC+. Of course, I could just as easily anticipate he’d not recover his former BABIP (maybe he’ll drop to .310 or .300), but using ShHAP!, I can get that solid number for which I’m looking.
- –If Dustin Ackley maintains his balance of walks, strikeouts, and homers, then he could still be a top tier second baseman if and when his BABIP cools off. That’s impressive. Of course, we expect the league will start to figure him out and eventually those numbers will sparkle a little less. Still, there’s plenty to be excited about.
- –Only Jack Wilson and Brendan Ryan have a BABIPs better than their career numbers, which makes me ask: “What’s in the water in Seattle, and why is everyone else drinking it?”
I’ve also included an HTML table below, detailing the Mariners’ statistics. For some reason, a bit of the formatting refuses to cooperate, but the numbers are in good order:
| Name | PA | HR | SB | BB% | K% | BABIP | cBABIP | wRC+ | ShHAP! | Diff |
| Brendan Ryan | 406 | 2 | 8 | 6.4% | 16.5% | .313 | .297 | 90 | 83 | -8% |
| Dustin Ackley | 207 | 5 | 2 | 11.6% | 15.5% | .329 | .283 | 142 | 121 | -15% |
| Franklin Gutierrez |
269 | 1 | 11 | 4.8% | 16.7% | .261 | .307 | 49 | 70 | 44% |
| Adam Kennedy | 346 | 7 | 7 | 5.8% | 14.5% | .264 | .306 | 83 | 103 | 24% |
| Miguel Olivo | 385 | 15 | 5 | 4.7% | 28.1% | .259 | .297 | 68 | 86 | 26% |
| Justin Smoak | 410 | 12 | 0 | 12.2% | 20.7% | .253 | .254 | 97 | 97 | 0% |
| Jack Wilson | 184 | 0 | 5 | 4.3% | 14.1% | .293 | .291 | 63 | 62 | -1% |
| Jack Cust | 270 | 3 | 0 | 16.3% | 32.2% | .333 | .337 | 96 | 98 | 2% |
| Carlos Peguero | 155 | 6 | 0 | 5.2% | 34.8% | .262 | .310 | 66 | 88 | 34% |
| Ichiro Suzuki | 536 | 2 | 30 | 5.6% | 8.4% | .286 | .352 | 78 | 109 | 39% |
| Michael Saunders |
152 | 2 | 4 | 6.6% | 29.6% | .231 | .268 | 29 | 46 | 59% |
| Chone Figgins | 313 | 1 | 11 | 6.7% | 13.4% | .215 | .329 | 35 | 88 | 151% |
| Weighted Avg | 29.3% | |||||||||
Stats through 8/16/2011.
Great graph, conceptually. Didn’t really dig into SHHAP or SHIP or whatever it is the first time around, so I won’t comment on the results. But just a very appealing end result to look at. Nice.
Thanks, Telo!