
Starting Pitcher Disabled List Analysis (3 of 3)
After analyzing all of the preceding numbers (here and here), I bucketed various players into different bins according to their age, BMI and if they attended college.
The main problem I’ve run into with my analysis is that, as I divide the data, the sample sizes get smaller. With only 947 samples with which to work, the numbers get scattered quickly. For this chart, I’m only looking at the player’s age and his BMI.

The main number that jumps out is the increased Average Disabled List Expectancy (ADLE) for pitchers with a high BMI. More specifically, high-BMI pitchers appear to break down more rapidly around age 29.
Next, I divided the pool of pitchers up into those who went to college and those who didn’t:
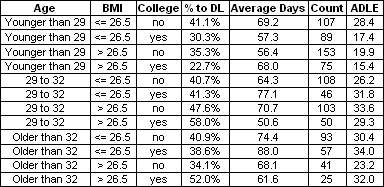
Take a look at the pitchers who attended college. In general, they go on the DL at a below-average clip when they are young, but, as they age, they head to the DL at a faster rate. College pitchers that make it as a starter in the majors have shown that they are able to pitch under a decent workload, but that workload catches up with them when they turn 29.
Using the preceding data, here’s a list of pitchers who fall into our “middle-aged,” high-BMI category. These players as a group are as likely to see significant disabled-list time compared with younger pitchers with the same BMI. Heavier pitchers begin to breakdown when they turn 29. The players’ bodies seem not to be able to handle the additional weight they are carrying. I never expected a player’s weight to matter so much. With the available data, it certainly does.
With the limited amount of data, it is too early to draw too many conclusions for starting pitchers. I will be doing further research on relief pitchers and position players to see what trends exist with those players. With that said, here are the 29- to 32-year olds:

As of right now, at least one of these players will start the 2011 season on the DL: Johan Santana. I’ll be closely watching how this group holds up during the season.
Jeff, one of the authors of the fantasy baseball guide,The Process, writes for RotoGraphs, The Hardball Times, Rotowire, Baseball America, and BaseballHQ. He has been nominated for two SABR Analytics Research Award for Contemporary Analysis and won it in 2013 in tandem with Bill Petti. He has won four FSWA Awards including on for his Mining the News series. He's won Tout Wars three times, LABR twice, and got his first NFBC Main Event win in 2021. Follow him on Twitter @jeffwzimmerman.
Thanks Jeff. Very interesting stuff.
I think the BMI would be more useful with 3 categories, fat, thin, and medium; even though this would make sample sizes smaller. We always need some sort of measure of statistical relevance; standard deviations, error bars etc. Except possibly for age, this looks to me just like random variation.
4 categories: thin, medium, CC. Sabathia, and Kung Fu Panda
Anything can happen and it will be intersting to see if this model is predictive but if Mark Buehrle ever makes less than 30 starts I’m going to start waking up early every day to make sure the sun rises in the east.
Jeff-
Thanks for providing the data; I fired up SAS to take a look at it.
I ran a Logit regression on whether a pitcher went on the DL or not. None of the variables were explanatory.
I next ran a linear regression on DL length of stay for those who were on the DL. That yielded a one-variable model that was not significant at the alpha=.05 level (although did make an alpha=.10 cut). The R-squared is terrible (.006). The variable that was included was BMI; higher BMI values were mildly and weakly associated with lower stays on the DL.
Conclusion: whatever causes variance in propensity to go on the DL or length of stay on the DL isn’t apparent in this data, at least on a first cut model.
Let me add the variables I included:
Height
Weight
BMI
Age1
College (1=college)
Foreign (1=foreign)
Hurrah! Someone actually looking at statistical significance. I applaud Mr. Zimmerman for investigating this and especially for making the data available, even though the apparent conclusion is “we can’t predict who will go on the DL or for how long.”
BMI is a flawed characterization of body size ! Its an old school stat much like we used to use RBIs to measure the productivity of a baseball player. Joe Carter had 12 straight straight years of 100+ RBIs but we all know he shouldn’t be in the HOF and benefited from having some high OBP guys in front of him. I have a BMI of 28.2 but my wife (who is a physiotherapist) says that I am skinny. I am wide but muscular and thin. BMI accounts only for height but not the width of a person — me being in the 95% percentile of width vastly skews my BMI as I have more mass/cm of height but my width/cm height is way higher than most. Aparently %body fat (the sabermetric of body characterization) is a much better indicator of physical fitness/body type and might be a better indicator of strain put on a body. Although its not a readily available stat I would love to see these stats re-calced with %fat as the “counting” stat
Is there anyway you can differentiate pitching and non-pitching related injuries in your analysis?
[…] Starting Pitcher Disabled List Analysis (1 of 3) (Jeff Zimmerman, FanGraphs) — see also Part 2 and Part 3 […]