
The Orioles and a Reminder About Spring-Training Records
There’s a lot to like about spring training. Hey, it’s baseball! Sort of. Games end in ties, Will Ferrell gets to play all the positions. That’s fun. Also, there’s a lot not to be thrilled about during spring training. Games end in ties! And games don’t actually count.
Although, if you’re a fan of the Cubs, Pirates, and especially the Orioles, you’re probably happy about that last point so far this March. Those teams are a combined 3-23 in spring-training play. Fortunately, we’re just finishing the first full week of baseball games, just getting our first real look at starting rotations, and many teams (like Baltimore, with their 0-9 record) have been marching out many unrecognizable and/or split-squad rosters (which would at least partly explain the zero in the wins column). But what does spring training mean for the season ahead? Can we really glean anything from March performance, especially team-wide? It’s good to remind ourselves of what this means.
We’re mainly going to be looking at the very obvious: how do team win-loss records correlate between spring training and the regular season? Is there any sort of relationship between terrible March teams and terrible regular-season teams, or vice versa with good teams? Take a look at a plot of the spring training and regular season records of all teams between 2006-2015 — and feel free to mouse over the chart:
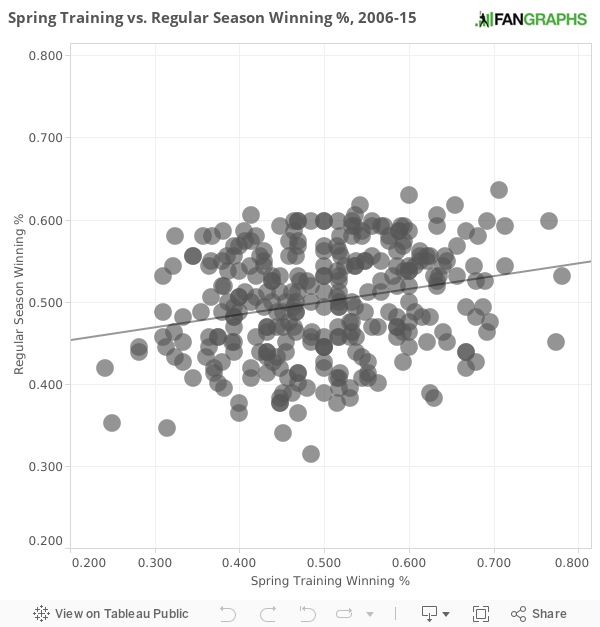
This chart is all over the place: lose more games than you win in spring training? Doesn’t mean you’re going to do so during the regular season. Win more than you lose? Doesn’t mean you’ll be successful. A month of games in March is the same as a month of games at any other point during the season — a relatively small sample, prone to all the pitfalls we see in any other small sample. If we tried to glean something from this 10-year sample, there are examples warning us not to be woefully awful in spring training. If a team covers that — finishing above .300 — our data provides evidence that the team probably won’t be unrecognizably terrible. Then again, we simply don’t see teams lose more than ~110 games very often during a regular season, whereas finishing with a winning percentage that low is doable in one month of baseball.
Likewise, the same might hold true on the opposite end of the spectrum: if a team is very successful during spring training (like winning ~70% or more of their games), there are examples that tell us they might be more likely to be a good team. However, if you don’t finish on one extreme or the other, there is almost no predictive value in this data. Our low p value (.001) and low r squared (.03) tells us we have a relationship here, but it doesn’t explain the variance in the data. That’s not surprising given the fact that it’s only a month of baseball, and it’s a good reminder with some potential playoff teams off to terrible spring training starts.
But that doesn’t mean that all spring stats are totally meaningless. There’s been work on these digital pages which shows that strikeout and walk rate for pitchers during spring could be helpful in projecting possible breakout candidates, mostly due to the fact that we get at least part of the way toward stabilization with a few pitching rate stats by the end of the month. Since we don’t really track advanced statistics during spring, we have to rely on some of the more traditional ones for our analysis, and a lot of those simply don’t hold up to comparison between spring and the regular season.
Overall, most of what we see on the team level is pretty meaningless for predicting the of outcomes of the regular season. Rosters are different, playing time is uneven, and the predictive usefulness of most of the team stats are muddied by the very reasons for having spring training — to shake the rust off, to try out players we won’t get a chance to see during the regular season, and to be able to make mistakes and have it be inconsequential. As we’ve seen, looking at individual spring statistics can be useful, but maybe we should leave most of our conceptions about overall team performance out of it. There’s simply not enough evidence to truly worry about teams that struggle during March, just as there isn’t too much evidence to be overly confident when a team does well.
The Cubs and Pirates will almost certainly be fine, or more than fine. The current outlook for the Orioles is a little murkier, but that’s probably because of the freshness of their recent roster issues; they’ve famously shown a penchant for outperforming their BaseRuns record in many of the past few seasons, and many fans might be expecting more magic because of that, despite some holes. The teams on the extreme ends of the spectrum are the ones we should pay most attention to during the later parts of spring training, so if we reach the end of the month and the Orioles have only won a few games, we might actually have cause to worry. Otherwise, Baltimore’s a good reminder that it doesn’t really matter whether you win or lose — at least in March.
Owen Watson writes for FanGraphs and The Hardball Times. Follow him on Twitter @ohwatson.
What’s the correlation between spring training and April winning percentages? Equally negligible?
More negligible. If there is a relationship between spring and regular season wins, it is because of underlying team talent, and replacing the whole season with just April will only weaken that sample’s relationship to team talent.
“Since we don’t really track advanced statistics during spring, we have to rely on some of the more traditional ones for our analysis, and a lot of those simply don’t hold up to comparison between spring and the regular season.”
Full ST stats:
http://www.baseball-reference.com/leagues/MLB/2016-spring-training-pitching.shtml
http://claydavenport.com/stats/webpages/2016/2016pageCacrealALL.shtml
Very detailed presentation on what matters:
https://www.dropbox.com/s/gb92yc96fme14rr/spring%20forward.pptx?dl=0
(Not affiliated with either site or with the author of the presentation).
Do you mean that the Jays are not going to be 132-15 -15?
Well, that would certainly set the league record for most draws in a season.
I don’t think the chart is right. it is showing the 2006 Nationals with a .599 winning percentage, when in fact they were 71-91 on the season. Now if the rest of the graph is correct then all the teams with a sub .300 winning percentage in spring are well below the projected win line(I know it is a small sample size of 4). And 5 out of the 6 teams with the best winning percentages in spring were at or better then there expected winning percentage(again sss). It is still early in spring but the graph shows that you are more likely to be a sub .500 team with a horrible ST, of the 16 teams that finished under .333, only 3(4 if the 2006 Nationals plot was not the 2006 Nationals) finished the season above .500 in the regular season.
Yeah, I noticed the same thing. That 2006 Nationals team was Alphonso Soriano and a bunch of dreck. They finished 16th in pitching in the NL (no longer possible!) and even with Soriano’s 40/40 season (actually 46/41) and Nick Johnson’s only healthy season (he had a higher OPS than Soriano!) and Zimmerman’s first full season they only managed 10th in scoring.
I didn’t check the rest of the data points, but the chart should be reviewed & revised.
Thanks both — it’s fixed now. A few teams in ’06/’07 got thrown out of order because of the Devil Rays’ switch to the Rays. It’s updated.
I think it might be more predictive if you were able to separate the stats from the beginning of ST till after the first cut, since by that point your seeing more playing time for predicted players. Also in ST players start out tweaking stuff and caring less about results then they do later in the spring when they are trying to play more game ready.
Or would the further reduction in sample size make it even weaker?
Alternatively, you could change the “meaning” (and usefulness?) and perhaps get a better fit by trying to correlate ST winning percentage with that of the Big team along with those at AAA and AA levels.
Both Scott Kazmir’s spring starts have been pretty bad, from a runs-allowed perspective. I made the mistake of looking at the comment section of the the mlb.com game recap. There were multiple people saying that the Dodgers rotation is now questionable after Kershaw and Maeda.
Reading this article is like hugging a teddy bear in bed with a blanket wrapped around me.
Hay Bip, the preseason means diddly. Unless you’re JaMarcus Russell’s belly.
Just neighing.
What’s the (95%?) confidence interval on the slope of that line?
I am 95% confident the slope of that line is very small and mostly meaningless
A few quick back of the envelope calculations say roughly 0.085 to 0.227.
I’m 0.00001% confident that this works just like Pascal’s Wager.
Therefore, there’s a 5% chance that that slope is PERFECTLY ACCURATE. 5% of perfection is perfection. Sorry Cubs fans, another 120 loss season ahead. ouch.