The Park Factors Are in the Pudding
At one point or another, most of us have done the thing where we go to the refrigerator in search of a snack, decide nothing looks appealing, close the door, then come back 15 minutes later to check again and somehow feel annoyed when the contents remain unchanged. It’s a near-universal experience despite the illogical nature of the whole thing. And when we relate this experience to others, it’s always the refrigerator, even though we could just as easily choose to re-check a cabinet or the pantry. But I think this is where we do get some credit for being slightly logical. The contents of a refrigerator are far more transient than the dry and canned goods stored elsewhere in the kitchen. The fridge is where we keep the perishables, the food that by definition isn’t meant to last long. Food in the refrigerator comes and goes, rots and gets tossed, all at a much faster rate than elsewhere in the kitchen.
Park factors work a little like a refrigerator. They present a single value that contains within it the influence of several different components that vary from park to park, much in the way my refrigerator is two-thirds beverages and cheese, while yours probably has fruits and veggies and maybe some leftover ham from Easter that you should definitely throw away. Some of the components captured by park factors are static and easily measured, like surface dimensions and wall height. They’re the condiments that remain consistently stocked in the fridge door.
But sometimes you throw open the door to a park’s refrigerator and get whacked in the face with a stench of unknown origin. And that stench becomes all the more potent as it mingles with a to-go box of leftover Thai and a carton of milk growing more questionable by the day. Likewise, wind speeds, the daily dew point, and the angle of the sun at different points relative to the solstice all fluctuate and interact in a way that a scientist with the right expertise could tease out and quantify, but that remain a bit fuzzy to the casual observer.
It was these squishier components of park factors, the ones that ebb and flow as weather cycles in and out and the seasons change, that sparked my curiosity about how park factors might vary over the course of such a long season. Traditionally, park factors are calculated over multiple full seasons of data (though sometimes single-season park factors are useful for capturing more recent trends), and that’s not just a sample size consideration. A full season of data is needed to ensure a balanced schedule where every opponent faced on the road is also faced at home and vice versa. This ensures that when comparing runs per game at home to runs per game on the road, the team quality is consistent in both subsets.
But what I really wanted to see was what the run environment is like in Minnesota in April compared to say, July. Since a team’s schedule in any given month is decidedly not balanced, I had to go with a slightly different methodology. The fundamental principles are the same — we’re still comparing runs per game at home against runs per game on the road, but there’s an adjustment for team quality. The exact adjustment is tuned through an iterative process used when calculating park factors for college stadiums, where the quality of competition and schedule imbalance are even more extreme than when isolating a single month of the major league season.
Here’s how it works:
- Each team starts with an initial offense rating that’s equal to their runs scored per game, as well as a defense rating that’s equal to their runs allowed per game. Likewise, each stadium is assigned an initial park factor equal to its total runs scored per game (by both teams) divided by the runs per game averaged at every other park.
- Then for each game, the stadium’s park factor is used to adjust the score to what it would have been if it were played at a neutral site. The neutral park scores are then used to re-calculate each team’s rating on offense and defense.
- The new team ratings are used to determine the expected run scoring in each individual matchup. The actual runs scored in a ballpark divided by the matchup-based expected runs becomes the stadium’s updated park factor.
- The last two steps are repeated until the adjustments made during each iteration no longer result in meaningful changes to the park factors, which is to say the algorithm has converged on a reasonable estimate.
To test the method, I initially ran it on five seasons of data and compared the output against the five-year park factors we use here at FanGraphs. There was a percentage point or two of disagreement on a few parks, but for the most part everything aligned nicely, confirming the validity of the method. Next, I applied the method to data from 2019 to 2024 to calculate park factors for each calendar month of the season (excluding the handful of games that leak into March and October). Since I chose not to extend the study into 2025, there’s no insight here on Sutter Health Park or George M. Steinbrenner Field, the homes to the A’s and Rays this season, but Michael Rosen has you covered on both fronts there.
There were two potentially interesting comparison points for a monthly park factor. The first is the typical use case: How a stadium’s run environment in April compares to all the other stadiums’ run environments in April. But I also wanted to know how a stadium’s April run environment compares to that same stadium’s overall run environment. Let’s start by seeing how each ballpark varies from month to month relative to its own standard, since contrasting a stadium against itself is somewhat easier to interpret. We should be safe in assuming that any differences stem from localized shifts in the weather or atmospheric conditions, and for the moment can ignore how those shifts might interact with league-wide trends. Full disclosure, I’m no Mike Trout when it comes to meteorology knowledge, so my analysis of wind, dew point, and barometric pressure will surely lack some nuance, but I was watching Twisters while writing some of this, and I’ve lived through an April in Minneapolis, so I’m not wholly unqualified. And naturally, I read some research done by actual experts and played around with the batted-ball trajectory calculator made by noted baseball physicist, Dr. Alan Nathan.
For the purposes of understanding seasonal fluctuations in run-scoring, it’s enough to know that the primary influences on batted-balls are wind and air density, with the latter being a function of altitude, temperature, humidity, and barometric pressure. Altitude and temperature have the largest impact on air density, and a stadium’s altitude doesn’t change from month to month, so along with wind, we can mostly focus on temperature, with an occasional nod to humidity. Warmer temperatures and increased humidity both correlate to a decrease in air density, which allows the ball to travel farther, while an increase in barometric pressure leads to denser air and impeded ball flight. I’d have liked to include some insight on the position of the sun during game times, but that data is a bit harder to track down in an easily applicable format. Still, it’s worth keeping in mind as a potential factor when examining the results.
In the heat map below, each team’s overall park factor becomes the neutral 100 that each month is centered around, so the values assigned to each month represent the percentage point difference from 100, or rather, the percentage increase or decrease to the typical run scoring:
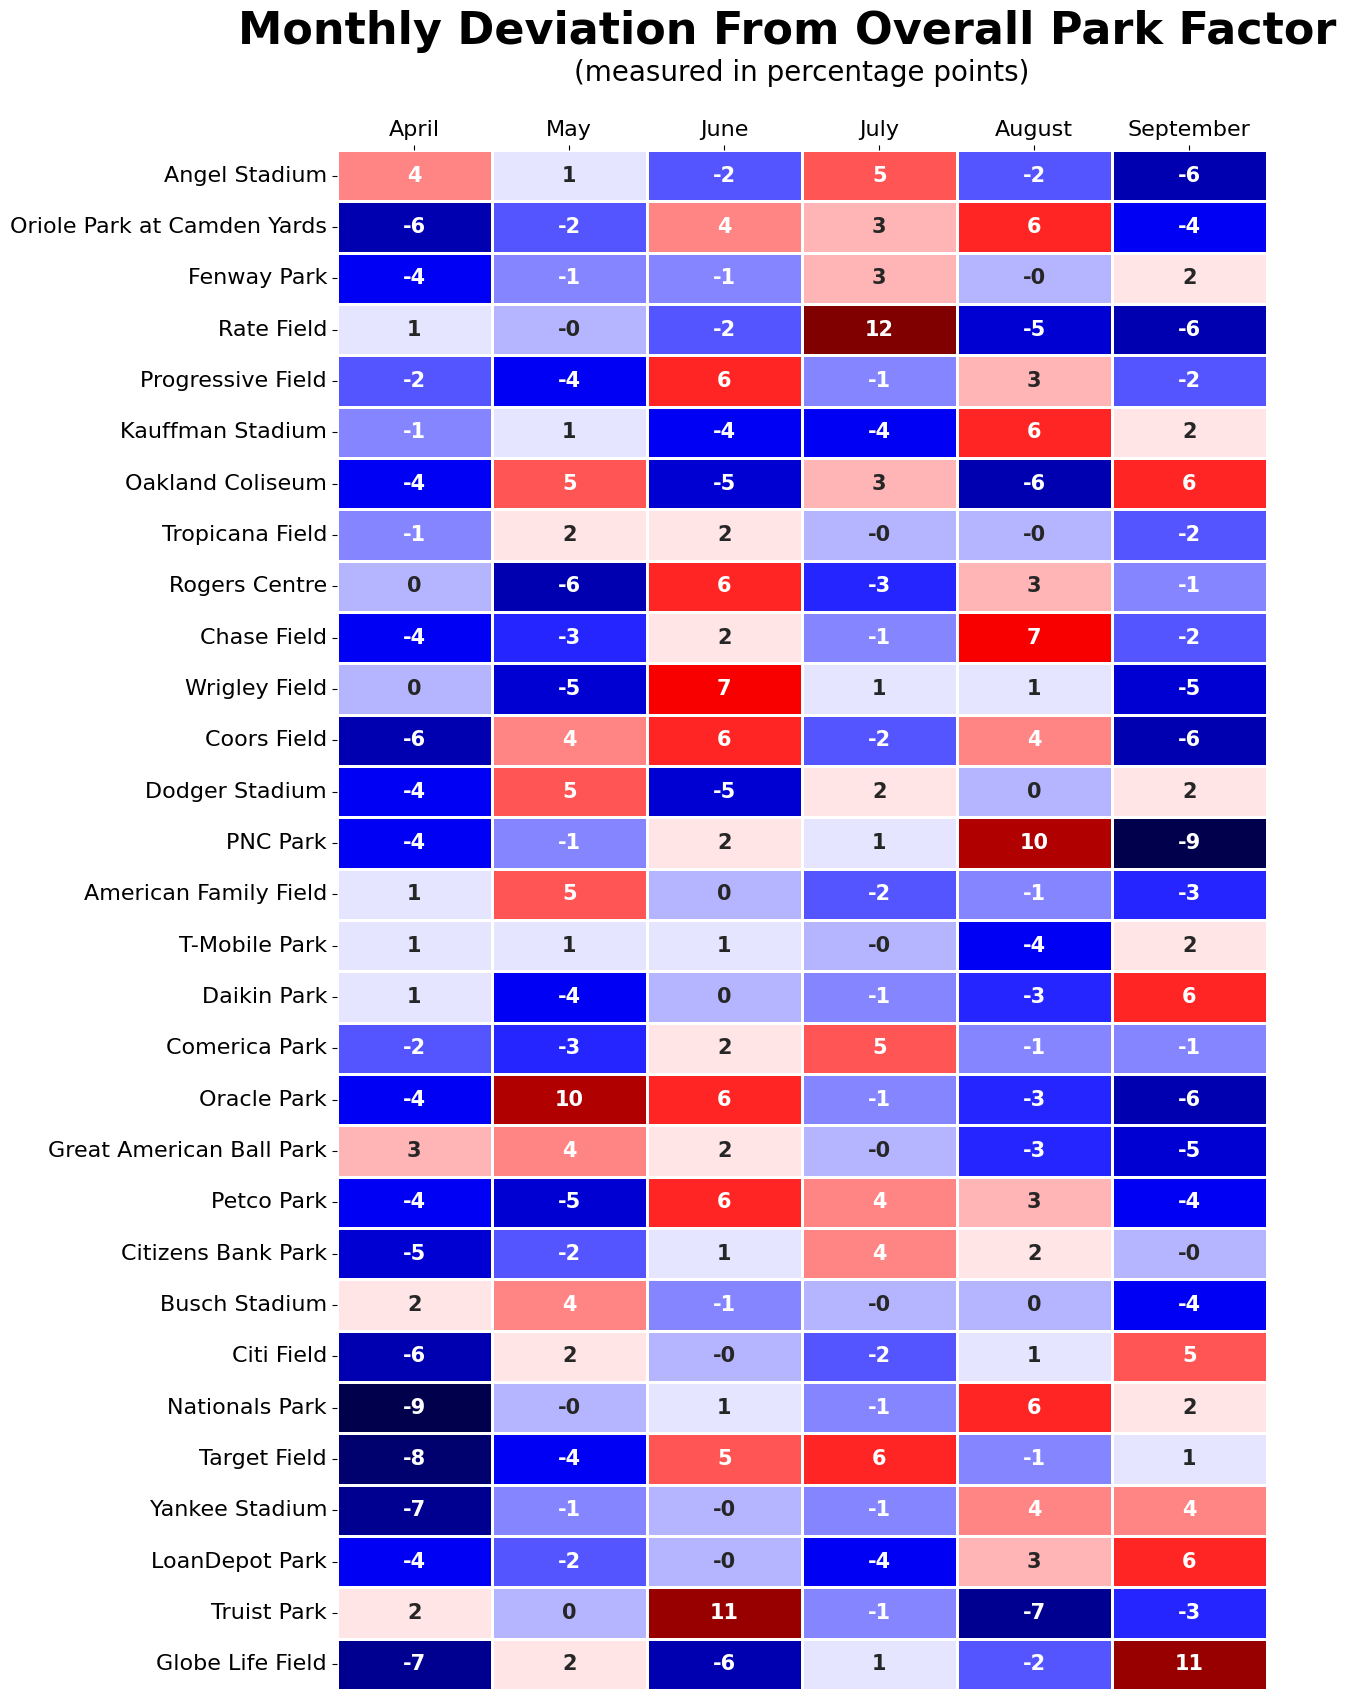
Looking first at the reddest parts of the chart, both teams in the Windy City have one month (June for Wrigley and July for Rate Field) that hits a sweet spot with warmer temps and winds that may not be as strong as earlier in the season, but blow out more frequently. At Oracle Park, May is the month where strong winds blowing out meet some of the higher temperatures one can expect on a Bay Area evening. Meanwhile, Arizona is at its warmest and most humid (relatively speaking) in August, and though Chase Field’s retractable roof remains closed during that part of the season, there’s only so much that air conditioning can do for a building when it’s full of people and isn’t fully insulated.
PNC Park, Truist Field, and Globe Life Field all experience pretty dramatic highs and lows over the course of the season. A fairly dramatic drop in temperature coupled with a change in wind patterns creates a notable downswing in offense in Pittsburgh as the calendar flips from August to September. By June in Atlanta, the weather is sufficiently warm to create a drop in air density, and the common presence of a healthy breeze charts an easier path for fly balls. But by August, the wind dies down considerably and tends to blow in more often, so despite the continued increase in temperature and humidity, the offense lags. Globe Life Field is both blessed and cursed by the months when the roof can actually be opened. The wind never really blows out at Globe Life Field, so the difference between April and September comes down to the difference between 71 degrees with minimal humidity and a much muggier 80 degrees.
The teams that hit extreme lows are the ones that experience very chilly Aprils, with frequent gusts of counterproductive wind that knock fly balls every which way but out. Target Field in Minneapolis is an obvious suspect in this category, but Nationals Park and Yankee Stadium can also be hostile environments for hitters early in the season.
Other stadiums are only hitting havens relative to their peers at certain points in the season. In the series of graphs below, I plotted each team’s overall park factor on the horizontal axis and their monthly park factor on the vertical axis. In this case, both park factors are relative to league average over their respective time spans. Venues where the single month run environment relative to the rest of the league aligns closely with the park’s overall number cluster themselves around the line of equality shown on each graph as a reference. In some cases, the outliers represent the variations in local weather described above, but others capture a deviation caused by bucking broader trends:
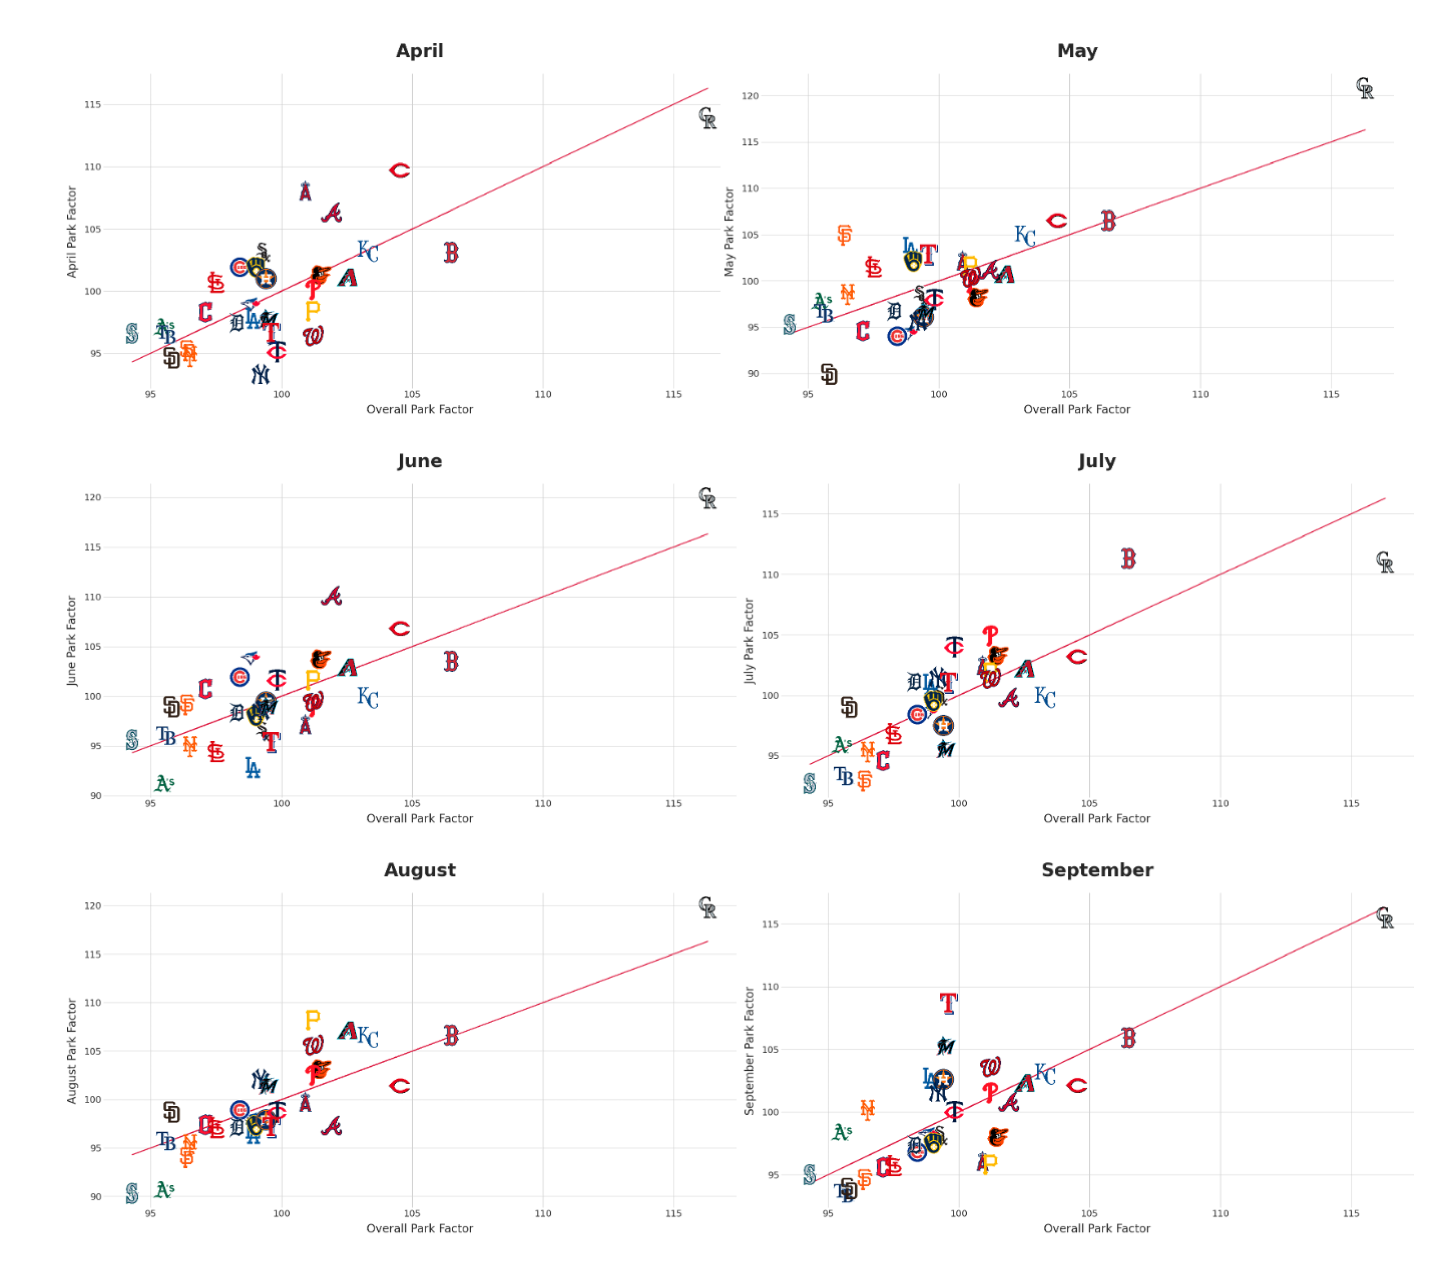
Angel Stadium spends April with average temperatures in the mid-60s, with Cincinnati’s Great American Ballpark just a few degrees off that pace, all while other ballparks struggle to break into the 50s. By May, however, other regions have warmed up, and they lose their advantage. And perhaps some marine layer quirkiness puts Petco Park, Dodger Stadium, and the A’s former ballpark in Oakland on a slightly different weather pattern than the rest of the league, particularly with respect to wind and barometric pressure. When May hits in San Diego, Petco Park is full of crosswinds that kill offense about as well as the gusts that blow in. In June, Dodger Stadium experiences its highest proportion of 10-20 mph winds, with a lower proportion of those winds blowing out relative to other months. The Bay Area winds in Oakland run counter to the cause of most fly balls, except in September, when the winds are more likely to blow out, and here too, the barometric pressure dips. Fenway Park, which sits near a bay of its own in Boston, has the effect of increasing temperatures and humidity, and is further juiced by a decrease in barometric pressure. And come September, as many cities across the country begin their transition to fall, Miami is still in the midst of hurricane season and experiencing peak humidity, with temperatures in the mid-80s alongside a season-low barometric pressure.
As with our hopelessly hopeful trips to the fridge in search of spontaneously generated snack foods, conversing about weather is another universal human experience. In part, that’s because we experience it communally, much in the way we experience baseball. Indeed, all of this ruminating is interesting to us because it pertains to something we all share. And as the world becomes more niche and siloed, we need to hang on to things like the weather and baseball, as fodder for small talk if nothing else.
But what, if anything, should we actually do with this newfound information about how run environments vary across different months of the season? I mean, other than woo the convenience store cashier with our newly discovered knowledge. Should we get more granular when park-adjusting stats like wRC+? Personally, my answer is no. For me, this exercise was a nice reminder of how frequently in baseball analysis we use a single fixed number to represent an array of variables that, by definition, vary. We use a concrete value to represent things that are sometimes very abstract and squishy. We’re not wrong to do this. Those concrete values are typically the best estimates we have to minimize error and provide the most accurate read on the sport. Monthly park factors are unlikely to improve the accuracy of existing metrics for most use cases. But when considering Austin Riley’s 268 wRC+ at Truist Park in June of last year, or Max Kepler’s 8 wRC+ at Target Field in April of 2021, what we can do is remember that even though wRC+ is park adjusted, that season-long park factor doesn’t consider the outlier that is Atlanta in June and Minneapolis in April.
Now if you’ll excuse me, I’m off to go see if some chocolate pudding appeared in my fridge since last I checked.
Kiri lives in the PNW while contributing part-time to FanGraphs and working full-time as a data scientist. She spent 5 years working as an analyst for multiple MLB organizations. You can find her on Bluesky @kirio.bsky.social.
While it is accurate that Wrigley is a pitcher’s park, this is still a concept my old brain balks at. In the 70’s and 80’s, Wrigley was definitely thought of as a hitter’s park. Sure, it was understood that was much more true in the summer than in the spring or fall, but the additional day games generally meant warmer weather at game time and, more importantly, Wrigley was smaller than most parks. Especially in the power alleys, but even down the lines.
Now, all the new parks are smaller and the Cubs don’t play nearly as many day games. Wrigley hasn’t gotten a lot bigger, but the other parks have gotten much smaller.
I’ve been to a couple of night games at Wrigley in June. Once the sun went down, it was frigid.
Wrigley is an example where I think that the message- sponsor boards erected in both right and left field within the last 5 years, effect the wind pattern.
Almost 10 years ago believe it or not. But yes, anecdotally at least the renovations have depressed offense overall, if only slightly.