The Playoffs Have Featured an Unusually High Number of Bunts
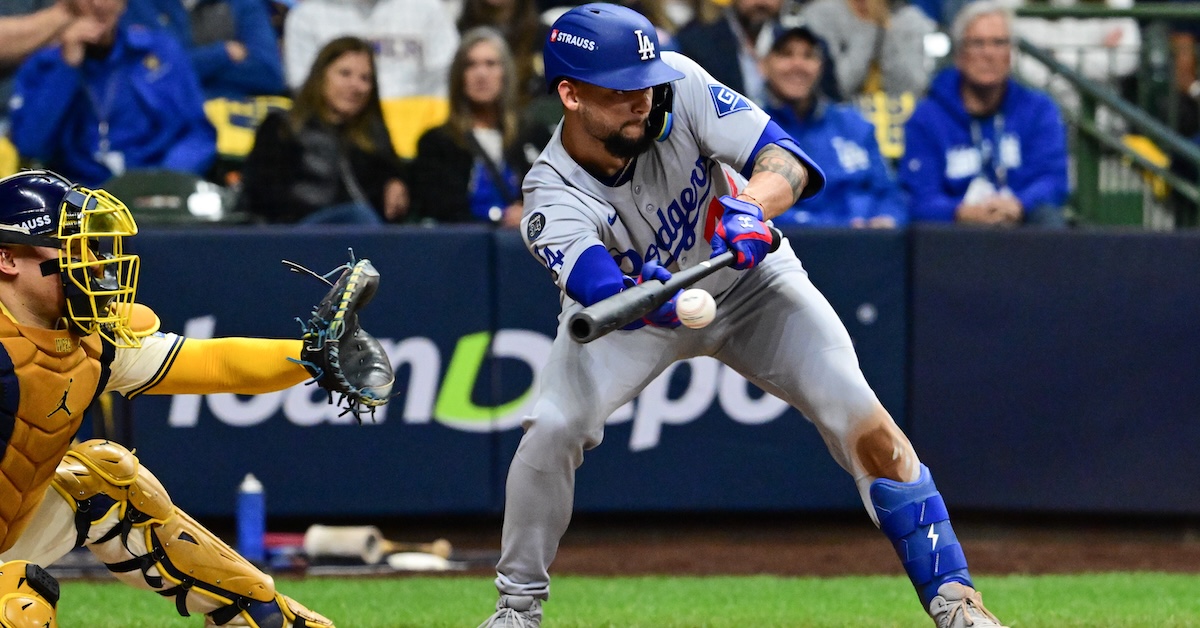
It’s alright. I’ve run the numbers, and you’re not imagining it. People really are bunting more during the playoffs. You really have been screaming “WHY ON EARTH WOULD YOU EVEN THINK ABOUT DROPPING DOWN A BUNT RIGHT NOW?” at your television more often than usual. Your neighbors have noticed. The homeowners association is going to get involved. This is an intervention.
But you’re not wrong. So far, 1.1% of all postseason plate appearances have ended with a bunt. That’s 0.4 percentage points above the regular season mark of 0.7%, an increase of 57%. It’s also the highest postseason bunt rate since 2017. Not only are we seeing more bunts than we did in the regular season, we’re seeing more postseason bunts than we have in years! That 0.4-point gap is the highest we’ve seen since at least 2008.
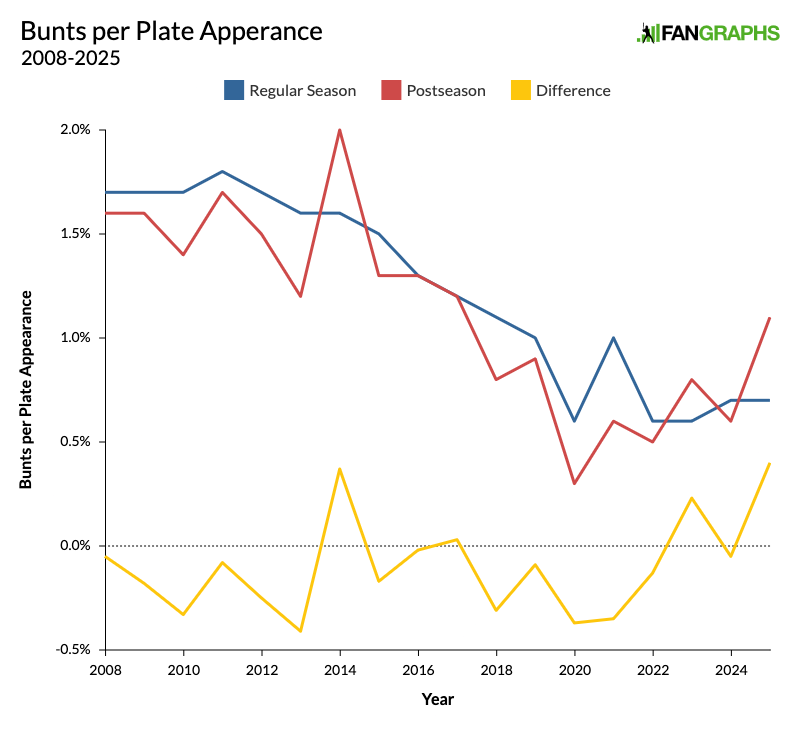
This may not be surprising to you. It always feels like there are more bunts in the postseason than the regular season because teams are trying to scratch out runs in a tougher offensive environment. And we notice them even more acutely because every plate appearance gets put under a microscope in the playoffs. But as you can see from the graph above, that hasn’t necessarily been true for quite a while now. Since the beginning of the pitch tracking era in 2008, the regular season bunt rate has been higher than the postseason rate in 14 of the past 18 years.
This year, the sacrifice bunt rate in particular has gone way up. So far, sac bunts have made up 0.7% of all postseason plate appearances. That’s the highest rate in the last 10 years and it’s double the 2024 rate. It makes it seem like teams are turning to small ball because they’re unusually desperate for runs. But offense hasn’t been all that bad this October. The league has a wRC+ of 93 during the playoffs, and while that’s lower than it was in 2023 and 2024, it’s still higher than usual. Over the past 10 years, the average wRC+ in the playoffs is 88.3, and over the past five years, it’s 92.7. So yes, offense is down in October as usual, but if anything, it’s down by a bit less than usual. The bunts aren’t coming because it’s all of a sudden even harder to hit during the playoffs.
The only playoff teams that have bunted less frequently than they did during the regular season are the Reds, the Guardians, the Brewers, the Mariners, and the Blue Jays. If that sounds to you like three of the four teams that made it to the League Championship Series, you’re not wrong, but I would caution against concluding from this that not bunting is the reason for their success. Even for the teams that made it to the LCS, we’re still talking about a very small sample size. And teams that make it deep into the playoffs often do so because they’re hitting well – giving them less incentive to play small ball.
Still, the overall shape of the numbers makes it clear. We really are seeing way more bunts. It’s not because bunts are all of a sudden working very well. I created a quick bunt success rate metric, dividing the number of bunts hits and sacrifice bunts by the total number of bunts. Over the past 18 seasons, the league has had a success rate of 71% in the postseason, and this year, we’re right on pace at 70%. There’s nothing special about these bunts. They’re doing what they’re intended to do just as often as they always have. But I mentioned earlier that the rate of sacrifice bunts in particular has increased, so what they’re intended to do is much more boring – and harder to justify according to the run expectancy tables – than usual. Sports Info Solutions has been tracking bunt hit percentage (the percentage of bunts that turn into hits) going back to 2002. During the regular season, the league had a bunt hit rate of 26.9%. In the postseason, because of all those sacrifices, we’re at just 9%, the third-lowest mark over that entire period. What I can’t measure without digging into the play-by-play data is whether the successful sacrifice bunts have actually turned into runs. It certainly hasn’t felt like that’s the case, especially if you’re a Mariners fan.
So that’s where we are. Bunts have gone way up this postseason, and while I can demonstrate it on a nice graph, I can’t really give you any broad conclusions about why this might be. To some extent, it has to be the residue of a small sample size. Postseason stats are noisy, especially for uncommon events. We’re talking about just 33 total postseason bunts, so certain individual factors can make an outsized difference. For example, Pete Crow-Armstrong and Andy Pages have combined for five bunts, at least in part because they’ve been mired in dismal slumps, making bunting seem like a viable alternative to swinging the bat. Crow-Armstrong bunted just 14 times during the regular season, and Pages didn’t bunt even once, but together they’ve accounted for 15% of all postseason bunts.
There are plenty of other factors to consider. It’s unlikely but possible that what we’re noticing really is a shift in strategy. It’s definitely too early to call it a trend, but it’s at least worth pointing out that 2023 and 2025 are both among those four years in which the postseason rate has been higher. It could just be the predilections of the managers whose teams made the postseason. It could be a reaction to the way certain games have played out. But it really is true. You have been subjected to more bunts, and vanishingly few of them have been of the exciting, successful bunt hit variety. I’m sorry about that. You deserve better.
Davy Andrews is a Brooklyn-based musician and a writer at FanGraphs. He can be found on Bluesky @davyandrewsdavy.bsky.social.
I mentioned this in the game recap comment section, but in the category of “individual factors”, it felt to me like Crawford’s bunt was a reaction (overreaction?) to the 3 double play balls Seattle hit in the previous game.