The Relationship Between Framing and Blocking
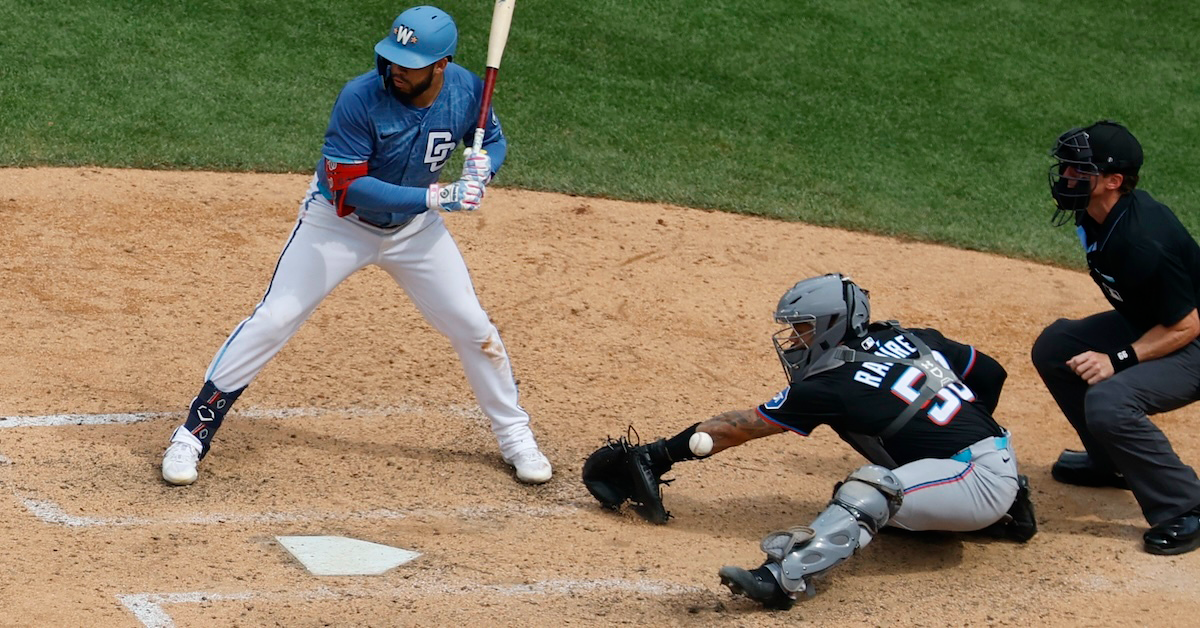
On Monday, Michael Rosen wrote a fun article about catcher blocking. He didn’t just write about it; he created his own blocking metric from scratch in order to grade every catcher in the game and to understand how much value a single block or passed ball can carry. The whole article is excellent, but one piece in particular caught my eye. Michael put together a supercut of Agustín Ramírez’s passed balls, all of which shared a theme. They weren’t the pitches in the dirt that you’d expect to end up as passed balls. They were normal pitches on the edges of the zone, ones that Ramírez tried so hard to frame them that he ended up missing them entirely. Michael drew the obvious inference: His framing focus, I believe, may have led to some of these inexcusable passed balls. At the risk of piling on, here are the pitches in question:
I’m so sorry, Agustín. This is brutal, and it makes Michael’s point very bluntly. It also makes me wonder about the relationship between the framing skill and the blocking skill. Does selling out to be a better framer hurt your blocking? Clearly, it can and at least sometimes does for Ramírez, but it still doesn’t strike me as a particularly likely hypothesis overall. Moreover, even if framing does hurt your blocking, the trade-off would certainly be worth it.
Statcast’s numbers indicate that one block above average is worth roughly a quarter of a run, a much bigger swing than the average called strike. That makes sense because a block or a wild pitch lets a runner move up a base. Blocking opportunities also come around more often than framing opportunities. In 2025, Statcast indicated that we saw 60 takes in the shadow zone (the edge of the strike zone) per game. That’s 30 chances per game for each team’s catcher. Statcast also classified pitches as blocking opportunities, and it identified 39.7 per team game. That’s a lot more chances, nearly 10 more a game for each catcher.
However, although catchers have more blocking opportunities (or as the kids call them, blockportunities), wild pitches and passed balls just don’t happen all that often. We saw only 0.34 per game. The average blockportunity has a higher than 99% chance of getting blocked. Alejandro Kirk was the best blocker in baseball in 2025, and he racked up just 0.19 more blocks per game than the average player. On the other hand, Austin Hedges ran the best shadow zone strike rate in the game at 48.6%. The league average was 42.2%, and if we do a little arithmetic based on his 1,595 shadow zone takes over 479 2/3 innings, we see that he earned 1.9 extra strikes per game. That’s 10 times the number of blocks per game that Kirk saved.
So while you have a lot more opportunities to block the ball, the actual variance between a good framer and a bad framer is a lot higher on a per-pitch basis than the difference between a good and bad blocker. In terms of overall value, Patrick Bailey’s league-best 25 framing runs trounced Kirk’s league-best five blocking runs. If you had to pick one skill to be good at, you’d choose framing every time. Moreover, if there were a correlation, the number of extra passed balls that would come with being a good framer might be so small that we might not notice them unless we ran the numbers.
Luckily, you don’t have to choose one. I ran the numbers, pulling career blocking and framing numbers for every catcher with at least 5,000 pitches caught from 2018 to 2025. That left a sample of 125 catchers, and I broke their numbers down on a per-opportunity basis for blocking and per-pitch basis for framing. The correlation coefficient between framing runs per pitch and blocking runs per opportunity is .44. That’s a positive correlation, which means that good framers aren’t bad blockers. In fact, it’s just the opposite.
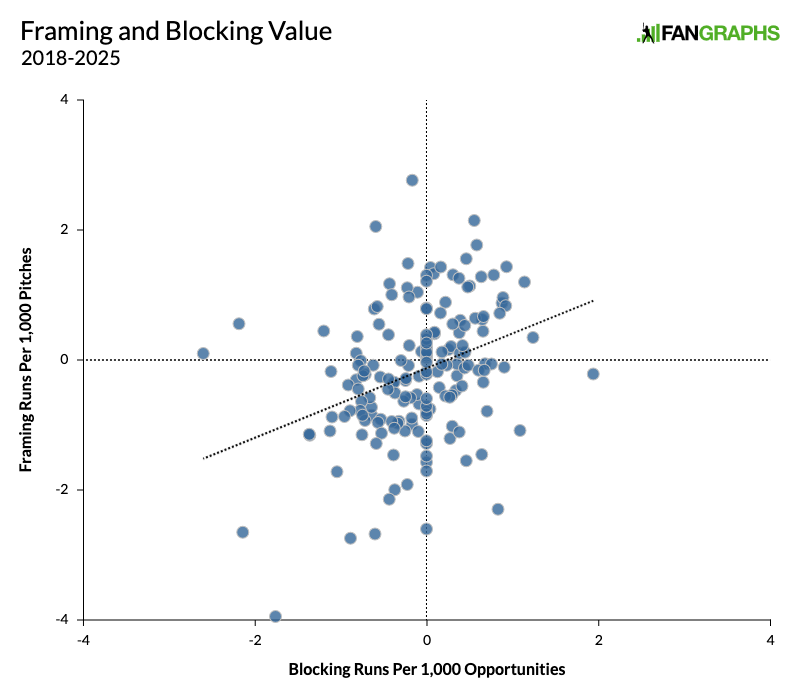
In the scatter plot above, 72% of the dots are in either the upper right or lower left quadrant (or on a borderline). That is to say that most catchers are either good at both framing and blocking or bad at both. It’s not all that common to be great at one and bad at the other. Pitch framing is absolutely a hyper-specialized skill, but not so much so that it’s completely divorced from the rest of a catcher’s job. If you’re good at catching the ball in such a way that you can rack up framing value, you’re probably just good at catching the ball period — or, at the very least, at keeping the ball in front of you.
That said, when breaking down the numbers for different parts of the zone, we can see some differences. While you don’t have to choose between being a good framer and being a good blocker, where you choose to focus your framing abilities matters at least a little. Unsurprisingly, the blocking skill is most strongly correlated with being a good framer at the bottom of the zone and least strongly correlated at the top. There could certainly be some selection bias here. Catchers who receive more balls at the bottom of the zone (maybe because their pitchers tend to throw more breaking or offspeed stuff) will naturally be better prepared for all those low pitches. They’ll be better at both blocking and framing them. It’s intuitive enough, and it’s really hard to be a good receiver in all quadrants of the zone.
| Overal | Top | Bottom | Left | Right | Heart | Chase/Waste |
|---|---|---|---|---|---|---|
| .44 | .19 | .26 | .21 | .22 | .27 | .20 |
Still, the strongest correlation to blocking in the table above actually comes on pitches over the heart of the plate. Once again, players who receive the ball well tend to block well too.
Even so, I did find one spot where the numbers did show a slight negative correlation between framing value and blocking value, and it’s exactly where you’d expect it. If we limit our sample to the players who have caught at least 20,000 pitches, we end up with just 51 players. For these players with the most robust individual samples, the correlation coefficient between blocking and framing at the top of the zone is -.07. It’s extremely weak, but it is a negative correlation, meaning that players who are better at framing at the top of the zone do tend to be worse at blocking.
I’d also note that we see more framing opportunities at the bottom of the zone than the top, and that’s been true in every year since Statcast started compiling framing numbers. Combine that with whatever small blocking bonus comes with being a good framer specifically at the bottom of the zone, and you can understand why one-knee-down catching has completely taken over the sport. Focusing on the low pitches just seems smart. More importantly, the automated ball-strike system is coming in 2026. While it looks unlikely to obliterate the value of framing, we don’t really know how it will affect the game at the big league level. Should framing value take a hit, the value of blocking and preventing stolen bases could start to catch up.
Davy Andrews is a Brooklyn-based musician and a writer at FanGraphs. He can be found on Bluesky @davyandrewsdavy.bsky.social.
This is phenomenal stuff. There’s intuitive sense in the relationship between framing at the bottom of the zone and blocking. I think it makes sense that there’s more room for framing a pitch at the bottom of the zone (where the ball is further from the eye-level of the umpire) versus the top (where it is generally coming right at them).
Something that I think will be worth keeping an eye on as move into the ABS challenge era is which pitchers and which catchers are having the most challenges (and the success rate thereof) called against them. Is it the top class of framers or is it guys who were shaky to begin with? Because the hitter can also potentially get fooled by an astute framing job — I imagine most hitters have some sense, even if not exact, of where the catcher is set up and how much they’re moving around. If you’re “quiet” back there, that might just be the difference between a hitter thinking that the catcher yanked it back or maybe it just was a really good pitch.
I am very curious to see how it plays out from a skill set point of view (who is correct most frequently), a game theoretical point of view (I was still thinking about running some numbers on this), and how it affects strike zone outliers (think Aaron Judge or Jose Altuve).