
2015 Positional Power Rankings: Starting Rotations (#16-30)
What do we have here? For an explanation of this series, please read this introductory post. As noted in that introduction, the data below is a hybrid projection of the ZIPS and Steamer systems, with playing time determined through depth charts created by our team of authors. The rankings are based on aggregate projected WAR for each team at a given position.
Yes, we know WAR is imperfect and there is more to player value than is wrapped up in that single projection, but for the purposes of talking about a team’s strengths and weaknesses, it is a useful tool. Also, the author writing this post did not move your team down ten spots in order to make you angry. We don’t hate your team. I promise.
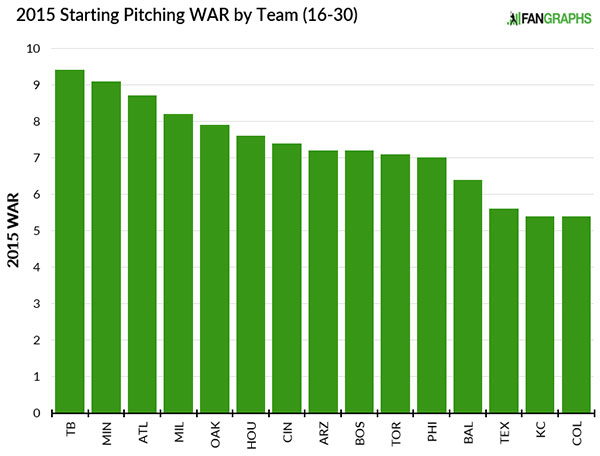
As we get into the back half of the starting rotations, that chart would look a whole lot better for the teams on the right side if you chose to willfully ignore that there’s 15 teams better than them not even shown here. This is where the pitching’s going to get a little dark. I’m tempted to just go with “it doesn’t matter, they’re all going to get hurt anyway and one day we’ll all be dead,” but that seems a little too bleak. Still, it’s sort of how you feel relying on any pitcher these days. Right? No? Just me? Okay, fine. Read the rest of this entry »