2015 Positional Power Rankings: Starting Rotations (#16-30)
What do we have here? For an explanation of this series, please read this introductory post. As noted in that introduction, the data below is a hybrid projection of the ZIPS and Steamer systems, with playing time determined through depth charts created by our team of authors. The rankings are based on aggregate projected WAR for each team at a given position.
Yes, we know WAR is imperfect and there is more to player value than is wrapped up in that single projection, but for the purposes of talking about a team’s strengths and weaknesses, it is a useful tool. Also, the author writing this post did not move your team down ten spots in order to make you angry. We don’t hate your team. I promise.
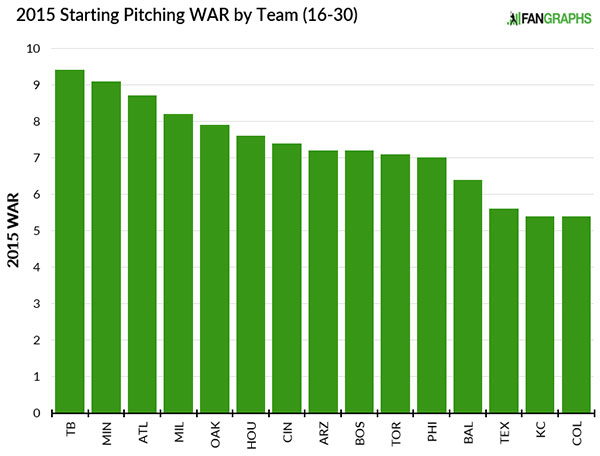
As we get into the back half of the starting rotations, that chart would look a whole lot better for the teams on the right side if you chose to willfully ignore that there’s 15 teams better than them not even shown here. This is where the pitching’s going to get a little dark. I’m tempted to just go with “it doesn’t matter, they’re all going to get hurt anyway and one day we’ll all be dead,” but that seems a little too bleak. Still, it’s sort of how you feel relying on any pitcher these days. Right? No? Just me? Okay, fine.
#16 Rays
| Name | IP | K/9 | BB/9 | HR/9 | BABIP | LOB% | ERA | FIP | WAR |
|---|---|---|---|---|---|---|---|---|---|
| Chris Archer | 183.0 | 7.9 | 3.4 | 0.8 | .300 | 72.6 % | 3.68 | 3.78 | 2.2 |
| Jake Odorizzi | 178.0 | 8.1 | 3.3 | 1.1 | .297 | 72.8 % | 4.05 | 4.19 | 1.3 |
| Alex Cobb |
126.0 | 8.0 | 2.7 | 0.7 | .301 | 73.1 % | 3.35 | 3.41 | 1.9 |
| Drew Smyly |
121.0 | 8.4 | 2.6 | 1.0 | .290 | 75.2 % | 3.38 | 3.63 | 1.9 |
| Matt Moore |
102.0 | 8.2 | 4.2 | 1.0 | .293 | 73.4 % | 3.97 | 4.22 | 0.7 |
| Nate Karns | 85.0 | 8.5 | 3.8 | 1.1 | .298 | 72.8 % | 4.06 | 4.21 | 0.7 |
| Erasmo Ramirez | 66.0 | 6.6 | 2.7 | 1.2 | .300 | 70.1 % | 4.35 | 4.36 | 0.3 |
| Matt Andriese | 47.0 | 6.2 | 2.8 | 1.1 | .299 | 69.8 % | 4.32 | 4.35 | 0.2 |
| Alex Colome |
38.0 | 6.7 | 3.9 | 0.9 | .298 | 71.0 % | 4.23 | 4.34 | 0.2 |
| Total | 946.0 | 7.9 | 3.2 | 1.0 | .297 | 72.7 % | 3.83 | 3.96 | 9.4 |
There’s a lot of talent here, even in the post-David Price era. Unfortunately, there’s also a lot of those green plus marks that indicate injury or illness, so much so that the front of the Rays rotation to begin the season is going to be Chris Archer, Jake Odorizzi, Nate Karns, and … Matt Andriese, probably? Most likely Erasmo Ramirez, now that the Rays have flipped Mike Montgomery for him, and don’t count out Burch Smith or Everett Teaford for a spot start. It’s a complicated situation right now. The good news is that time inexorably marches forward, so that in a month or sooner, Alex Cobb (forearm), Drew Smyly (shoulder), and Alex Colome (illness) should all be available. A few weeks after that, Matt Moore (elbow) could be ready to come back.
A potential rotation of Archer / Odorizzi / Cobb / Moore / Smyly, well, there’s a lot to like there. Jeff Sullivan has written at length about how Smyly’s high fastball approach after coming over from Detroit changed him. Cobb has dropped his FIP three seasons in a row, and has been one of the most under-appreciated above-average starters in the majors. Archer’s first full season was a big success in part because he figured out how to pitch to lefties. Odorizzi struck out 174 in 168 innings.
None older than 27 this year, there’s more talent than I think the general public prefers to accept. But there’s also perhaps no rotation with a higher variance. All healthy, this could be a very good group. Of course, the odds of a rotation already battling multiple injury concerns coming out as “all healthy” are spectacularly low, and depth is being tested. I’m not sure I realized how fascinating this rotation was going to be until I started writing this.
#17 Twins
| Name | IP | K/9 | BB/9 | HR/9 | BABIP | LOB% | ERA | FIP | WAR |
|---|---|---|---|---|---|---|---|---|---|
| Ervin Santana | 201.0 | 7.1 | 2.8 | 1.1 | .311 | 69.5 % | 4.50 | 4.22 | 1.2 |
| Phil Hughes | 204.0 | 7.7 | 1.2 | 0.9 | .319 | 70.7 % | 3.66 | 3.20 | 4.0 |
| Ricky Nolasco | 172.0 | 6.6 | 2.1 | 1.1 | .319 | 68.1 % | 4.57 | 4.11 | 1.2 |
| Kyle Gibson |
146.0 | 5.7 | 2.9 | 0.8 | .308 | 68.3 % | 4.34 | 4.03 | 1.3 |
| Tommy Milone | 93.0 | 6.3 | 2.4 | 1.3 | .314 | 69.5 % | 4.72 | 4.51 | 0.5 |
| Mike Pelfrey | 66.0 | 5.6 | 3.2 | 1.1 | .316 | 67.5 % | 4.99 | 4.63 | 0.2 |
| Alex Meyer | 47.0 | 8.8 | 4.1 | 0.9 | .315 | 71.5 % | 4.16 | 3.97 | 0.4 |
| Tim Stauffer | 28.0 | 7.3 | 3.2 | 0.9 | .319 | 69.8 % | 4.29 | 3.94 | 0.2 |
| Trevor May | 9.0 | 7.7 | 4.1 | 1.1 | .313 | 69.6 % | 4.80 | 4.53 | 0.0 |
| Total | 966.0 | 6.9 | 2.4 | 1.0 | .315 | 69.2 % | 4.34 | 4.00 | 9.1 |
All the way up from last year’s No. 28, and that’s almost entirely because the projections really, really believe that Phil Hughes is going to sustain that breakout. If he doesn’t, well, right back on down to the bottom of the rankings, because there’s not a lot of other upside here — at least not yet.
It’s not that there’s anything wrong with Ervin Santana, of course. He’s a perfectly acceptable addition to the rotation, even if his seemingly-impressive whiff rate increase in 2014 can be almost exclusively attributed to the luxury of striking out NL pitchers. He just doesn’t really do all that much to push the Twins towards being competitive, and won’t likely over the course of his contract — nor will Mike Pelfrey, or Tommy Milone, or Tim Stauffer. You’d think that they’d prefer to dream on Alex Meyer, but he’s headed back to Triple-A Rochester and may end up being a reliever. Pelfrey is already a reliever — and not terribly happy about it — but is still listed here due to the likelihood they’ll need to go back to him.
It’s all good, though. Ricky Nolasco is on a mission. Problem solved.
#18 Braves
| Name | IP | K/9 | BB/9 | HR/9 | BABIP | LOB% | ERA | FIP | WAR |
|---|---|---|---|---|---|---|---|---|---|
| Julio Teheran | 197.0 | 7.9 | 2.2 | 1.0 | .295 | 74.6 % | 3.49 | 3.72 | 2.5 |
| Alex Wood | 174.0 | 8.5 | 2.8 | 0.8 | .304 | 73.8 % | 3.38 | 3.39 | 2.6 |
| Shelby Miller | 169.0 | 8.1 | 3.3 | 1.1 | .293 | 74.3 % | 3.80 | 4.07 | 1.5 |
| Mike Minor |
134.0 | 7.6 | 2.5 | 1.1 | .293 | 73.1 % | 3.85 | 4.01 | 1.0 |
| Wandy Rodriguez | 92.0 | 6.7 | 2.6 | 1.2 | .298 | 70.7 % | 4.32 | 4.39 | 0.3 |
| Eric Stults | 75.0 | 5.9 | 2.3 | 1.1 | .303 | 70.1 % | 4.32 | 4.26 | 0.4 |
| Chien-Ming Wang | 55.0 | 4.1 | 2.9 | 0.9 | .307 | 67.3 % | 4.80 | 4.64 | 0.1 |
| Mike Foltynewicz | 28.0 | 8.1 | 4.2 | 1.0 | .300 | 71.7 % | 4.28 | 4.34 | 0.2 |
| Cody Martin | 19.0 | 8.1 | 3.7 | 1.0 | .305 | 72.0 % | 4.11 | 4.11 | 0.1 |
| Jason Hursh | 19.0 | 5.3 | 3.1 | 1.0 | .303 | 68.8 % | 4.55 | 4.53 | 0.0 |
| Total | 962.0 | 7.5 | 2.7 | 1.0 | .298 | 72.7 % | 3.85 | 3.96 | 8.7 |
When the Braves traded away three of the four best members of last year’s porous offense, they did so in part to infuse some badly-needed young pitching into the rotation, which bid farewell to Ervin Santana, Aaron Harang, Kris Medlen, and Brandon Beachy this winter. (Not that the latter two did much in 2014.) That’s why 24-year-old Shelby Miller (Jason Heyward) is here, and that’s why 23-year-old Mike Foltynewicz (Evan Gattis) is here. Add them to 24-year-old Julio Teheran, who has become one of the NL’s better starters, and 24-year-old Alex Wood, who was an above-average starter in his first crack at the rotation, and 27-year-old Mike Minor, one of the NL’s best in 2o13, and you can see the plan. Not unlike what we just went over with the Rays, there’s talent and youth.
But while that’s the ideal outcome for the Braves, that’s not what’s going to happen in 2015. Foltynewicz is going to start in the minors and still has to prove he’s not a reliever. Minor’s 2014 was destroyed by injuries, and now he’s going to miss at least the first month with shoulder soreness. That might put two of Eric Stults, Wandy Rodriguez, and Chien-Ming Wang in the rotation, at least to start, or Cody Martin, who went unselected in the Rule 5 draft.
It’s a time of transition in Atlanta, so the fact that this rotation has some holes in it isn’t unexpected. The Braves aren’t going to win in 2015, so if they have to struggle along with a past-his-prime vet or an unheralded organizational soldier, so be it. At least they have talent they can nurture towards a successful future. If they can do that, this won’t be a wasted year.
#19 Brewers
| Name | IP | K/9 | BB/9 | HR/9 | BABIP | LOB% | ERA | FIP | WAR |
|---|---|---|---|---|---|---|---|---|---|
| Kyle Lohse | 194.0 | 6.3 | 2.0 | 1.2 | .296 | 71.9 % | 4.09 | 4.27 | 1.3 |
| Matt Garza | 185.0 | 7.6 | 2.7 | 1.1 | .300 | 71.9 % | 3.96 | 3.96 | 2.0 |
| Wily Peralta | 180.0 | 7.2 | 3.4 | 1.0 | .306 | 71.2 % | 4.18 | 4.18 | 1.3 |
| Mike Fiers | 169.0 | 8.7 | 2.4 | 1.2 | .294 | 73.3 % | 3.79 | 3.85 | 2.2 |
| Jimmy Nelson | 158.0 | 7.9 | 3.6 | 0.9 | .306 | 71.1 % | 4.08 | 4.03 | 1.5 |
| Taylor Jungmann | 47.0 | 6.7 | 4.3 | 1.1 | .303 | 69.2 % | 4.92 | 4.91 | 0.0 |
| Johnny Hellweg |
18.0 | 6.0 | 6.5 | 1.0 | .308 | 68.6 % | 5.62 | 5.68 | -0.1 |
| Brent Suter | 9.0 | 6.4 | 3.4 | 1.1 | .304 | 69.7 % | 4.58 | 4.55 | 0.0 |
| Total | 960.0 | 7.4 | 2.9 | 1.1 | .301 | 71.6 % | 4.10 | 4.14 | 8.2 |
Trading Yovani Gallardo to Texas made sense, because he’s entering the last year of his contract and wasn’t a difference-maker anyway. Trading Marco Estrada to Toronto made sense, because he was generally lousy last year and Adam Lind could be a useful platoon bat. Not adding any rotation depth at all to replace them, on a team in arguably baseball’s most competitive division, well, that’s the confusing part.
Because, what you have here is a whole lot of “fine.” Kyle Lohse is fine, and durable. Matt Garza is fine, though endlessly declining strikeout rates are scary. Wily Peralta is fine, and at least he’s young and throws hard. Mike Fiers was impressive in 2012 and 2014, but atrocious in 2013, and has made only 13 big league starts in the last two years. He’s also dealt with shoulder weakness so far this spring, which is concerning because the fifth starter is Jimmy Nelson, who was dominant in Triple-A but also just did this the other day…
Pitching line for #Brewers No. 5 starter Jimmy Nelson in AAA game this morning: 4.1 IP, 11 H, 10 R, 10 ER, 4 BB, 6 K. 86 pitches.
— Tom (@Haudricourt) March 30, 2015
… and behind him is, yikes. Is that it? Really? Taylor Jungmann was a first-round pick, but he hasn’t exactly been impressive in the minors. Johnny Hellweg, coming back from an elbow zipper? Michael Blazek, who couldn’t find the plate as a reliever? Brent Suter, who somehow isn’t a hockey player? This has the potential to get real ugly, real quickly, if any of the first five struggle or get hurt. I might need a minute here.
#20 Athletics
| Name | IP | K/9 | BB/9 | HR/9 | BABIP | LOB% | ERA | FIP | WAR |
|---|---|---|---|---|---|---|---|---|---|
| Sonny Gray | 198.0 | 7.6 | 3.1 | 0.7 | .301 | 72.9 % | 3.53 | 3.60 | 2.5 |
| Scott Kazmir | 177.0 | 7.8 | 2.6 | 0.9 | .299 | 72.5 % | 3.68 | 3.69 | 2.2 |
| Drew Pomeranz | 150.0 | 8.1 | 3.9 | 1.0 | .294 | 72.9 % | 4.00 | 4.22 | 1.0 |
| Jesse Hahn | 140.0 | 6.7 | 3.6 | 0.9 | .297 | 70.6 % | 4.17 | 4.25 | 0.8 |
| Kendall Graveman | 94.0 | 5.1 | 2.6 | 1.0 | .297 | 69.5 % | 4.31 | 4.39 | 0.3 |
| Jesse Chavez | 56.0 | 7.8 | 2.9 | 1.0 | .303 | 72.1 % | 3.91 | 3.95 | 0.5 |
| A.J. Griffin |
47.0 | 7.0 | 2.4 | 1.3 | .289 | 73.4 % | 4.05 | 4.37 | 0.2 |
| Jarrod Parker |
49.0 | 6.5 | 3.0 | 1.0 | .296 | 71.4 % | 4.08 | 4.19 | 0.3 |
| Sean Nolin |
19.0 | 7.2 | 3.4 | 1.0 | .299 | 71.5 % | 4.09 | 4.17 | 0.1 |
| Chris Bassitt | 19.0 | 6.5 | 4.7 | 1.0 | .299 | 70.4 % | 4.75 | 4.94 | 0.0 |
| Total | 950.0 | 7.2 | 3.1 | 0.9 | .298 | 71.9 % | 3.92 | 4.02 | 7.9 |
The A’s ended last year with Jon Lester, Jeff Samardzija, and Jason Hammel, and now they don’t have any of those guys, so yes, this rotation has clearly taken some hits. But they still have Sonny Gray, who gave nearly 220 innings of solid work in his first full season, and they have Scott Kazmir, who proved that his 2013 rebirth with Cleveland wasn’t a fluke by topping it in nearly every way. There’s little reason to expect Gray and Kazmir can’t be successful once again.
Behind that pair, you’ve got the results of Billy Beane’s frenetic offseason moves, to the point that it’s difficult to look at this as “the 2015 Oakland rotation” so much as it is “the rotation, right now, at this point in time, subject to change.” Jesse Hahn and that delicious curveball should have the best opportunity to stick, but so should Drew Pomeranz, and Kendall Graveman — acquired in the Josh Donaldson trade — has been nothing but impressive, to the point that he seems to have a rotation spot all but locked up.
Consider now that I’ve not even yet mentioned Sean Nolin or Jesse Chavez (or, sigh, Barry Zito), and that at some point, the A’s are going to welcome back Jarrod Parker and A.J. Griffin, and you realize that the greatest strength here is depth. It’s not short on talent, though, even if it’s difficult to keep track of who is coming and who is going. And make no mistake, there’s always someone coming and going here, which is what makes projecting this group so difficult.
#21 Astros
| Name | IP | K/9 | BB/9 | HR/9 | BABIP | LOB% | ERA | FIP | WAR |
|---|---|---|---|---|---|---|---|---|---|
| Dallas Keuchel | 215.0 | 6.7 | 2.5 | 0.8 | .310 | 71.0 % | 3.78 | 3.66 | 2.8 |
| Collin McHugh | 192.0 | 8.3 | 2.7 | 1.0 | .303 | 72.1 % | 3.83 | 3.78 | 2.4 |
| Scott Feldman | 176.0 | 5.8 | 2.7 | 1.1 | .307 | 68.6 % | 4.60 | 4.44 | 0.8 |
| Brett Oberholtzer |
162.0 | 6.3 | 2.0 | 1.2 | .313 | 68.6 % | 4.62 | 4.28 | 1.1 |
| Dan Straily | 72.0 | 8.0 | 3.6 | 1.3 | .305 | 71.7 % | 4.59 | 4.64 | 0.3 |
| Roberto Hernandez | 75.0 | 5.8 | 3.2 | 1.2 | .300 | 68.5 % | 4.80 | 4.81 | 0.0 |
| Brad Peacock |
47.0 | 7.9 | 4.1 | 1.4 | .309 | 69.6 % | 5.06 | 4.90 | 0.0 |
| Samuel Deduno | 19.0 | 7.3 | 4.3 | 0.9 | .310 | 69.4 % | 4.56 | 4.45 | 0.1 |
| Asher Wojciechowski | 9.0 | 6.1 | 3.2 | 1.2 | .312 | 68.1 % | 5.03 | 4.78 | 0.0 |
| Alex White | 9.0 | 6.6 | 4.0 | 1.1 | .312 | 68.4 % | 5.00 | 4.76 | 0.0 |
| Total | 977.0 | 6.9 | 2.8 | 1.1 | .308 | 70.0 % | 4.32 | 4.18 | 7.6 |
Last year’s worst projected rotation, and not by a little. A group that looked like it was going to be “Scott Feldman and then a dozen other guys and wait, was Scott Feldman supposed to be the reliable ace?” came up with a pair of surprises, namely groundball machine Dallas Keuchel (and his killer slider) and Collin McHugh’s spintastic curve. Feldman had a typical Feldman-esque year, and what looked like an atrocious rotation ranked as a middle-of-the-pack one. There’s no way to call that anything other than a success.
Somewhat surprisingly, however, the Astros didn’t do a whole lot to add to the rotation this winter, other than adding Dan Straily in the Dexter Fowler trade and becoming the latest team to think that Roberto Hernandez is interesting. So the position they’re in this year is hoping that Keuchel / McHugh / Feldman all approximate their 2014 seasons — hardly a guarantee — while also hoping they can find their next unexpected breakthrough.
Maybe that’s Brett Oberholtzer, who has shown outstanding control. Maybe Straily, and the pitches that seem better than the results. At some point, you might see Mark Appel. Mostly, I’m interested to see if the fascinating Keuchel can keep it up. Just please, don’t torture the poor fans of Houston with Hernandez. They’ve suffered enough.
#22 Reds
| Name | IP | K/9 | BB/9 | HR/9 | BABIP | LOB% | ERA | FIP | WAR |
|---|---|---|---|---|---|---|---|---|---|
| Johnny Cueto | 205.0 | 8.3 | 2.3 | 0.9 | .287 | 75.9 % | 3.09 | 3.48 | 3.4 |
| Mike Leake | 182.0 | 6.4 | 2.1 | 1.0 | .299 | 71.9 % | 3.90 | 4.05 | 1.6 |
| Jason Marquis | 141.0 | 6.2 | 3.4 | 1.4 | .294 | 70.2 % | 4.88 | 5.09 | -0.3 |
| Anthony DeSclafani | 148.0 | 7.1 | 2.6 | 1.3 | .299 | 70.6 % | 4.35 | 4.38 | 0.7 |
| Raisel Iglesias | 94.0 | 7.8 | 5.8 | 1.2 | .293 | 71.9 % | 4.93 | 5.12 | -0.2 |
| David Holmberg | 46.0 | 5.7 | 3.5 | 1.3 | .293 | 69.9 % | 4.86 | 5.13 | -0.1 |
| Homer Bailey |
172.0 | 8.0 | 2.4 | 1.0 | .296 | 73.2 % | 3.60 | 3.74 | 2.3 |
| Total | 988.0 | 7.2 | 2.9 | 1.1 | .294 | 72.3 % | 4.03 | 4.23 | 7.4 |
This is a rotation that figures to look very differently come July. Johnny Cueto is elite, but he and Mike Leake are going to be free agents, and if the Reds struggle as much as we think they will, then they’re going to be holding some pretty interesting cards for pitching-hungry contenders at the deadline.
In the meantime, this is a rotation in transition. Mat Latos is a Marlin, Alfredo Simon is a Tiger, and Tony Cingrani is a reliever. Every single one of those moves had reasoning behind it that made at least some kind of sense. The problem is that for a team that’s certainly acting like it plans to contend, well, there’s entirely too much Jason Marquis on that list. I’m struggling to think of any situation, ever, where you might say “please, more Jason Marquis.” This isn’t it.
Now, you can hope that Raisel Iglesias works out after mostly being a reliever in Cuba, or that David Holmberg can be the No. 4 starter he probably can be, and that there’s some talent in the upper levels with Robert Stephenson and Michael Lorenzen maybe only a year out. This is just a team that doesn’t know whether it’s coming or going, and the rotation reflects that. Not enough depth, and not enough talent, not for a team that still fancies itself a contender.
#23 Diamondbacks
| Name | IP | K/9 | BB/9 | HR/9 | BABIP | LOB% | ERA | FIP | WAR |
|---|---|---|---|---|---|---|---|---|---|
| Josh Collmenter | 174.0 | 6.5 | 2.5 | 1.1 | .295 | 72.0 % | 4.07 | 4.24 | 1.3 |
| Jeremy Hellickson | 159.0 | 7.0 | 2.5 | 1.2 | .303 | 70.9 % | 4.24 | 4.21 | 1.1 |
| Rubby de la Rosa | 119.0 | 7.2 | 3.2 | 1.0 | .308 | 71.1 % | 4.20 | 4.13 | 1.0 |
| Chase Anderson | 109.0 | 8.0 | 2.8 | 1.1 | .304 | 72.7 % | 3.97 | 3.99 | 1.1 |
| Trevor Cahill | 93.0 | 7.5 | 3.9 | 0.9 | .308 | 70.2 % | 4.30 | 4.15 | 0.7 |
| Allen Webster | 73.0 | 6.6 | 3.6 | 1.0 | .301 | 69.7 % | 4.42 | 4.45 | 0.4 |
| Patrick Corbin |
66.0 | 7.4 | 2.4 | 0.9 | .299 | 72.8 % | 3.57 | 3.67 | 0.9 |
| Bronson Arroyo |
49.0 | 5.2 | 1.8 | 1.2 | .298 | 70.2 % | 4.27 | 4.41 | 0.3 |
| Archie Bradley | 37.0 | 7.4 | 4.8 | 0.9 | .304 | 70.3 % | 4.51 | 4.50 | 0.2 |
| Vidal Nuno | 28.0 | 7.4 | 2.4 | 1.2 | .298 | 72.0 % | 4.09 | 4.20 | 0.2 |
| Robbie Ray | 19.0 | 7.4 | 3.7 | 1.1 | .305 | 70.9 % | 4.48 | 4.50 | 0.1 |
| Randall Delgado | 9.0 | 8.3 | 3.3 | 1.1 | .303 | 72.7 % | 4.04 | 4.08 | 0.1 |
| Total | 937.0 | 7.0 | 2.9 | 1.1 | .302 | 71.2 % | 4.16 | 4.18 | 7.2 |
Well, there’s certainly not a lack of options, that’s for sure. Too many, probably. Last year’s D-Backs had 11 different starting pitchers, and this year’s might have that many or more.
In a sense, that’s fine. This team isn’t going to be good in 2015, so they might as well throw the Allen Websters and Rubby de la Rosas and Chase Andersons of the world against the wall and see what sticks. Ahead of them, Josh Collmenter is terribly miscast as the team’s No. 1 starter, but he’s more than serviceable. Behind them, both Patrick Corbin and Bronson Arroyo are coming back from Tommy John surgery and should be ready around midseason. Somewhere floating around them is Trevor Cahill, who was both “not as bad as he looked” and “still not good” in 2014.
So that’s all fine — along with Archie Bradley and Robbie Ray and maybe even Daniel Hudson, there’s an interesting mix of young talent and returning veterans. None of that explains the wisdom in going out and getting Jeremy Hellickson, however, who seemed an odd fit at the time and seems especially so now. That probably won’t matter, though. Teams headed for ~95 losses might as well load up on depth and see what they end up with. It’s hard to think of anything that matters less than what combination of five of the names listed above the Diamondbacks are using at any given time.
#24 Red Sox
| Name | IP | K/9 | BB/9 | HR/9 | BABIP | LOB% | ERA | FIP | WAR |
|---|---|---|---|---|---|---|---|---|---|
| Rick Porcello | 196.0 | 6.3 | 2.1 | 0.8 | .307 | 71.1 % | 3.79 | 3.70 | 2.4 |
| Clay Buchholz | 180.0 | 6.9 | 2.9 | 1.0 | .304 | 70.5 % | 4.13 | 4.08 | 1.5 |
| Wade Miley | 173.0 | 7.2 | 3.0 | 0.9 | .308 | 71.4 % | 4.04 | 3.93 | 1.5 |
| Justin Masterson | 167.0 | 7.3 | 4.0 | 0.8 | .307 | 69.6 % | 4.25 | 4.15 | 1.1 |
| Joe Kelly |
121.0 | 6.1 | 3.5 | 0.9 | .303 | 70.1 % | 4.35 | 4.37 | 0.5 |
| Steven Wright | 56.0 | 5.7 | 3.9 | 1.1 | .304 | 69.0 % | 4.90 | 4.90 | -0.1 |
| Henry Owens | 47.0 | 8.5 | 4.3 | 1.0 | .303 | 72.4 % | 4.19 | 4.29 | 0.3 |
| Eduardo Rodriguez | 19.0 | 6.5 | 3.3 | 1.0 | .307 | 70.2 % | 4.37 | 4.30 | 0.1 |
| Total | 957.0 | 6.8 | 3.2 | 0.9 | .306 | 70.6 % | 4.15 | 4.09 | 7.2 |
Much has been made of how the Red Sox “have no ace,” and “must trade for Cole Hamels,” and on and on. Probably too much has been made of that, because probably the Red Sox are going to be a very good team, and there’s plenty of reason to think that Rick Porcello is going to be successful in Boston, and that Wade Miley will gain respect now that he’s on a team that people actually watch, and that the Sox are perfectly positioned to make a move for an ace in July.
That’s still all true, but the “don’t panic about the lack of an ace right now” line of thinking only works when you can still say you have five above-average — even if none are elite — starters who can help you win every night, and that’s where things are starting to come apart. Joe Kelly has always profiled better as a reliever, and he’s been limited all spring by a biceps issue. Justin Masterson is coming off an awful season and hasn’t impressed anyone this spring. If you know what version of Clay Buchholz is going to show up, then you’re ahead of the rest of us.
It’s not like there’s nothing interesting behind them. Knuckleballer Steven Wright is fascinating, and Henry Owens and Eduardo Rodriguez are well-regarded prospects. But considering how tight the AL East looks, Boston might not be able to wait until July to make the move for Hamels or Johnny Cueto or someone similar that everyone expects. It’s okay to not have an “ace.” It’s not okay to potentially have only half a rotation of reliability — if that.
#25 Blue Jays
| Name | IP | K/9 | BB/9 | HR/9 | BABIP | LOB% | ERA | FIP | WAR |
|---|---|---|---|---|---|---|---|---|---|
| R.A. Dickey | 209.0 | 7.1 | 2.8 | 1.2 | .292 | 72.2 % | 4.08 | 4.34 | 1.6 |
| Mark Buehrle | 204.0 | 5.3 | 2.2 | 1.0 | .309 | 70.8 % | 4.19 | 4.17 | 1.9 |
| Drew Hutchison | 167.0 | 8.5 | 2.9 | 1.2 | .305 | 71.5 % | 4.14 | 4.02 | 1.7 |
| Aaron Sanchez | 150.0 | 7.3 | 4.7 | 0.9 | .298 | 70.7 % | 4.51 | 4.60 | 0.3 |
| Daniel Norris | 139.0 | 9.2 | 4.0 | 1.2 | .304 | 72.8 % | 4.26 | 4.29 | 0.8 |
| Johan Santana |
65.0 | 7.3 | 2.9 | 1.2 | .302 | 71.1 % | 4.31 | 4.28 | 0.5 |
| Marco Estrada |
38.0 | 8.0 | 2.3 | 1.5 | .293 | 73.1 % | 4.17 | 4.31 | 0.3 |
| Total | 971.0 | 7.3 | 3.1 | 1.1 | .301 | 71.6 % | 4.23 | 4.28 | 7.1 |
This was going to be the year, you know. Let Marcus Stroman apply last year’s breakout to a full season, add Drew Hutchison’s fancy new slider, give Daniel Norris his first real opportunity, throw in a huge framing upgrade from Dioner Navarro to Russell Martin, and the Toronto rotation would have finally been known for something other than having the only two pitchers who averaged under 85 mph on their fastball last year.
But no. We can’t have nice things. Stroman’s year is over before it began, and suddenly a whole lot of the promise around the Jays season is gone with it. It’s unfair to say that this is a rotation without interest, however. Less Stroman means more opportunity for Norris and Aaron Sanchez, even if Sanchez seems better cast as a reliever. It means more opportunity for Marco Estrada, which should be interesting for the fans who will get to watch him allow homer after homer. It even opens the door for Johan Santana, should that miracle comeback ever happen.
This is one of those rotations that could be better than this, if the two senior citizens can provide another 400+ innings and if the young trio all show something. Hutchison and Norris both seem like good bets to outdo these projections. It just might not be good enough, not in a tight AL East, where every win lost by not having Stroman could be fatal.
#26 Phillies
| Name | IP | K/9 | BB/9 | HR/9 | BABIP | LOB% | ERA | FIP | WAR |
|---|---|---|---|---|---|---|---|---|---|
| Cole Hamels | 216.0 | 8.7 | 2.3 | 0.9 | .301 | 74.1 % | 3.40 | 3.42 | 3.5 |
| Aaron Harang | 155.0 | 6.7 | 3.2 | 1.1 | .307 | 70.1 % | 4.52 | 4.38 | 0.8 |
| David Buchanan | 140.0 | 5.6 | 2.9 | 1.1 | .304 | 69.0 % | 4.59 | 4.57 | 0.6 |
| Jerome Williams | 131.0 | 6.1 | 2.8 | 1.2 | .306 | 68.4 % | 4.69 | 4.51 | 0.4 |
| Sean O’Sullivan | 84.0 | 5.6 | 3.2 | 1.2 | .305 | 67.7 % | 5.04 | 4.89 | 0.0 |
| Paul Clemens | 65.0 | 6.1 | 3.7 | 1.4 | .303 | 68.1 % | 5.23 | 5.13 | -0.2 |
| Chad Billingsley |
56.0 | 7.3 | 3.0 | 0.9 | .309 | 71.6 % | 4.07 | 3.96 | 0.6 |
| Ben Lively | 37.0 | 8.4 | 3.5 | 1.0 | .304 | 71.4 % | 4.07 | 4.01 | 0.4 |
| Aaron Nola | 37.0 | 7.0 | 2.4 | 1.3 | .306 | 68.8 % | 4.53 | 4.32 | 0.2 |
| Miguel Gonzalez | 9.0 | 7.7 | 3.6 | 1.0 | .300 | 70.8 % | 4.30 | 4.25 | 0.1 |
| Ethan Martin | 9.0 | 8.2 | 4.7 | 1.1 | .301 | 72.1 % | 4.46 | 4.56 | 0.0 |
| Cliff Lee |
31.0 | 8.2 | 1.5 | 1.0 | .310 | 73.0 % | 3.44 | 3.27 | 0.6 |
| Total | 971.0 | 6.9 | 2.9 | 1.1 | .305 | 70.3 % | 4.32 | 4.23 | 7.0 |
So this is bad, and unfortunately, it’s going to get worse, potentially much worse. Right now, we have Cole Hamels and Cliff Lee combining for nearly 250 innings at about 4.5 WAR. Between the overwhelming likelihood that Hamels gets dealt by July 31 or sooner, and the extreme odds that Lee’s arm injury keeps him out all year (or at least diminishes him if and when he’s able to return late in the season), there’s almost no chance that they actually contribute those numbers.
Which means a lot less of them, and a lot more of, well, this. Giving $5 million to the nearly 37-year-old Harang generated some snickers on Twitter, but really, if there was ever a rotation that needed an “innings eater,” it’s this one. Didn’t Jerome Williams get DFA’d by both the Astros and the Rangers last summer? (Yes!) There’s a Paul Clemens now? (He got DFA’d by Houston last year, too!) And when asked about Miguel Gonzalez, manager Ryne Sandberg recently said:
“He’s just struggling with his control, and command and pitches.”
Or, you know, pitching.
The Phillies are openly saying that their fifth starter isn’t even a part of the organization yet. It could be literally anyone. Maybe even you. It’s probably you. Philadelphia might be thrilled if they ended up with the No. 26 rotation, or at least they ought to be. Even that mild goal seems like it might be out of reach, though at least the eventual debuts of Aaron Nola and Ben Lively ought to be interesting. David Buchanan was okay last year. Chad Billingsley was, approximately 20 surgeries ago. This rotation with Hamels is merely bad. When he’s gone, it’s going to be brutal.
#27 Orioles
| Name | IP | K/9 | BB/9 | HR/9 | BABIP | LOB% | ERA | FIP | WAR |
|---|---|---|---|---|---|---|---|---|---|
| Chris Tillman | 197.0 | 7.0 | 3.0 | 1.2 | .290 | 72.9 % | 4.11 | 4.41 | 1.3 |
| Wei-Yin Chen | 175.0 | 6.8 | 2.2 | 1.2 | .297 | 72.4 % | 4.02 | 4.15 | 1.7 |
| Miguel Gonzalez | 162.0 | 6.3 | 2.8 | 1.4 | .289 | 72.6 % | 4.43 | 4.87 | 0.5 |
| Bud Norris | 131.0 | 7.5 | 3.1 | 1.1 | .299 | 72.3 % | 4.14 | 4.29 | 1.0 |
| Kevin Gausman | 121.0 | 7.4 | 3.0 | 1.1 | .301 | 71.8 % | 4.07 | 4.09 | 1.2 |
| Ubaldo Jimenez | 75.0 | 8.4 | 4.3 | 1.1 | .297 | 72.5 % | 4.21 | 4.32 | 0.5 |
| Dylan Bundy | 66.0 | 6.8 | 3.6 | 1.1 | .298 | 71.3 % | 4.43 | 4.60 | 0.3 |
| Tim Berry | 28.0 | 5.7 | 3.4 | 1.3 | .299 | 68.7 % | 5.05 | 5.10 | 0.0 |
| Total | 955.0 | 7.0 | 3.0 | 1.2 | .295 | 72.2 % | 4.21 | 4.41 | 6.4 |
You know how this goes already. The Orioles rotation comes in ranked lower than people would expect, and then they go out and win a bunch of games, and there’s a whole lot of “told you so.”
But really, looking at these individually, what seems low? Chris Tillman just doesn’t miss bats, and what we’re projecting, FIP-wise, is pretty well in line with what he’s established over his career. He has shown an ability to outpitch that FIP by doing other things well, like destroying the running game and having a great defense behind him, and he’s only 27, so with another year of this, maybe we’re talking about him like we do Matt Cain or Jered Weaver. If that one feels a bit low, I won’t argue. Miguel Gonzalez is almost Tillman-light, at least considering the ERA-FIP gap.
Wei-Yin Chen? He’s improved his walk rates, but he also doesn’t strike anyone out — less and less each year — and doesn’t avoid homers. His projection doesn’t seem unfair. Bud Norris is basically the same guy he’s always been, which is to say a slightly below league-average pitcher. Ubaldo Jimenez, well, that’s anyone’s guess at this point after last year’s disaster.
Jimenez aside, this is a rotation of good-but-not-great pitch-to-contact guys in front of a solid defense; throw in what looks like solid health, and you see how the on-field results may look different than the metrics. Where that could change is with Kevin Gausman and Dylan Bundy, who each have the tools to be something special, perhaps as soon as this year.
#28 Rangers
| Name | IP | K/9 | BB/9 | HR/9 | BABIP | LOB% | ERA | FIP | WAR |
|---|---|---|---|---|---|---|---|---|---|
| Derek Holland | 197.0 | 7.8 | 2.6 | 1.1 | .305 | 72.4 % | 3.94 | 3.89 | 2.1 |
| Yovani Gallardo | 194.0 | 6.9 | 2.9 | 1.1 | .308 | 70.7 % | 4.30 | 4.19 | 1.4 |
| Colby Lewis | 159.0 | 6.5 | 2.5 | 1.4 | .310 | 69.5 % | 4.87 | 4.74 | 0.5 |
| Ross Detwiler | 139.0 | 5.6 | 2.9 | 1.0 | .307 | 69.2 % | 4.59 | 4.52 | 0.7 |
| Nick Tepesch | 94.0 | 5.4 | 2.8 | 1.2 | .304 | 69.0 % | 4.71 | 4.70 | 0.3 |
| Nick Martinez | 37.0 | 5.5 | 3.6 | 1.3 | .301 | 69.5 % | 5.06 | 5.14 | 0.0 |
| Anthony Ranaudo | 38.0 | 6.3 | 3.5 | 1.3 | .299 | 71.0 % | 4.74 | 4.92 | 0.1 |
| Martin Perez |
49.0 | 6.1 | 3.0 | 0.9 | .305 | 69.9 % | 4.35 | 4.25 | 0.3 |
| Alex Gonzalez | 28.0 | 5.7 | 3.2 | 1.1 | .306 | 68.2 % | 4.88 | 4.75 | 0.1 |
| Matt Harrison |
18.0 | 6.0 | 3.1 | 1.0 | .304 | 70.6 % | 4.37 | 4.35 | 0.1 |
| Total | 953.0 | 6.5 | 2.8 | 1.2 | .306 | 70.3 % | 4.47 | 4.41 | 5.6 |
This was a rotation that had serious depth concerns before Yu Darvish went down. When they acquired Yovani Gallardo in January, the basic reaction was “well, he’s not really that good any longer, and losing Jonathan Lucroy’s framing won’t help, but man did that rotation need a half-decent arm.” Gallardo as your third-best starter isn’t the worst thing in the world. But then Darvish blew out, and Derek Holland dealt with shoulder soreness, and now Gallardo is starting on Opening Day.
That generally doesn’t mean a whole lot — it’s not like Bartolo Colon is the best Mets starter, right? — but it sure does tell you about how desperately thin this group is. Colby Lewis was eight kinds of awful last year, has been regularly getting crushed so far this spring, and he’s their third starter. Ross Detwiler could never miss bats or stay healthy in Washington, and now he’s trying to resolve that in the AL. You can’t count on anything whatsoever from Matt Harrison at this point.
The 2014 Rangers had 15 starters and 40 different pitchers, the latter mark not only setting a big league record, but blowing away the previous AL record by a full six pitchers. This year might not be much better, and what’s most depressing, there just doesn’t seem to be a whole lot of visible upside even if everything breaks right.
#29 Royals
| Name | IP | K/9 | BB/9 | HR/9 | BABIP | LOB% | ERA | FIP | WAR |
|---|---|---|---|---|---|---|---|---|---|
| Yordano Ventura | 174.0 | 8.0 | 3.3 | 0.8 | .298 | 73.3 % | 3.63 | 3.75 | 2.0 |
| Jeremy Guthrie | 195.0 | 5.0 | 2.4 | 1.2 | .297 | 70.2 % | 4.43 | 4.66 | 0.3 |
| Jason Vargas | 191.0 | 5.9 | 2.2 | 1.2 | .290 | 71.3 % | 4.19 | 4.42 | 0.9 |
| Edinson Volquez | 159.0 | 6.8 | 3.7 | 1.0 | .301 | 69.9 % | 4.52 | 4.53 | 0.4 |
| Danny Duffy | 139.0 | 7.4 | 3.7 | 0.9 | .288 | 74.8 % | 3.71 | 4.19 | 1.3 |
| Chris Young | 66.0 | 6.1 | 3.1 | 1.4 | .284 | 71.9 % | 4.51 | 4.88 | 0.1 |
| Kris Medlen |
38.0 | 6.5 | 2.2 | 1.0 | .304 | 72.3 % | 3.81 | 3.88 | 0.4 |
| Total | 962.0 | 6.5 | 3.0 | 1.1 | .295 | 71.8 % | 4.13 | 4.34 | 5.4 |
Having the defending American League champions ranked as the AL’s worst rotation clearly shows our institutional bias against the Royals. Or, it shows that a rotation that was just okay last year basically brings back the exactly same group except that they swapped out the above-average James Shields for the far-inferior Edinson Volquez. It’s definitely one of those.
The problem isn’t that Volquez exists, really. After putting up a bizarre three-year stretch where his FIP has gone 4.06/4.24/4.15 while his ERA has gone 4.14/5.71/3.04, landing with one of the better defenses in baseball isn’t a bad fit. The problem is that by adding Volquez to Jason Vargas and Jeremy Guthrie, you have three-fifths of the rotation hung up on sub-par veterans without any remaining upside. Reliability is one thing. Stagnation is another.
The hope, of course, is that Yordano Ventura takes that step forward in his age-24 season to jump from “good pitcher” to “very good pitcher.” The hope is that Danny Duffy builds on what was a successful (2.53 ERA) season that in no way matched his peripherals (3.83 FIP / 4.42 xFIP). Either could happen. Both could happen, and with the rehabbing Kris Medlen and veteran “not the outfielder” Chris Young around, there’s depth, plus Brandon Finnegan in the minors. It’s just worrisome that of all the pitchers name here, some of the least-valuable are the ones with the tightest holds on rotation spots. The Shields-less Royals can’t repeat last year’s magic with zero-upside placeholders, and that’s what 60% of the rotation is.
#30 Rockies
| Name | IP | K/9 | BB/9 | HR/9 | BABIP | LOB% | ERA | FIP | WAR |
|---|---|---|---|---|---|---|---|---|---|
| Kyle Kendrick | 165.0 | 5.3 | 2.5 | 1.2 | .310 | 68.2 % | 4.89 | 4.72 | 0.8 |
| Jordan Lyles | 142.0 | 6.2 | 3.0 | 1.0 | .314 | 68.8 % | 4.63 | 4.40 | 1.0 |
| Jorge de la Rosa |
141.0 | 6.9 | 3.3 | 1.1 | .305 | 70.3 % | 4.42 | 4.35 | 1.1 |
| Tyler Matzek | 132.0 | 7.4 | 3.9 | 1.0 | .314 | 70.5 % | 4.52 | 4.34 | 1.0 |
| Jon Gray | 102.0 | 7.3 | 3.1 | 1.1 | .311 | 69.9 % | 4.45 | 4.26 | 1.0 |
| David Hale |
94.0 | 5.2 | 4.0 | 1.1 | .314 | 68.7 % | 5.13 | 5.02 | 0.1 |
| Christian Bergman | 81.0 | 5.2 | 2.2 | 1.6 | .310 | 67.8 % | 5.34 | 5.17 | 0.0 |
| Eddie Butler |
56.0 | 5.5 | 3.5 | 1.2 | .313 | 68.2 % | 5.12 | 4.91 | 0.1 |
| Chad Bettis | 28.0 | 7.2 | 3.3 | 1.1 | .318 | 69.7 % | 4.63 | 4.34 | 0.2 |
| Total | 942.0 | 6.2 | 3.2 | 1.1 | .311 | 69.2 % | 4.75 | 4.58 | 5.4 |
I’m not sure that any existing projection system truly accounts for just how difficult it is to be a pitcher in Coors Field. I’m also not sure it matters in this case.
The one bright spot the Rockies had was that Jorge De La Rosa has been inexplicably excellent at home, to the point that I recently tried to see if they could rework the rotation to get him as many Coors Field starts as possible. But for as productive as De La Rosa has been at home, it doesn’t change the fact that he’s been lousy on the road — or that his strained groin could keep him out for the first few weeks of the season.
So the Rockies are left with way too much Kyle Kendrick, and to hope that Tyler Matzek’s successful three months in the majors carry more weight than years of poor performances in the minors, or that Jordan Lyles turns into a pitcher who doesn’t actually resemble Jordan Lyles. When David Hale returns from his oblique injury, the Rockies will be giving taking a pitcher who struck out 4.53/9 last year as a reliever not in Colorado, and potentially making him a starter, and, you know, in Colorado.
“But there’s young talent coming,” is the hope, and that’s true, because Jon Gray has been impressive. (Eddie Butler’s inability to miss bats, conversely, is terrifying, to say nothing of concerns over his shoulder.) There’s a lot of smart people in the Colorado front office, and maybe they’ll yet crack the mystery that is how to build a successful pitching staff at high altitude. It’s just not going to be in 2015. Another brutally long year in the mountains awaits.
Mike Petriello used to write here, and now he does not. Find him at @mike_petriello or MLB.com.
“Because, what you have here is a whole lot of “fine.”” – “a whole lot of fine” is probably the absolute best summary of the entire Milwaukee Brewers organization since the 2011 NLCS, not just the rotation, that could be written.