A Few Interesting Facts About Sinkers
Sinkers (or two-seamers, as they’re also called), are a mixed bag. Maybe it’s just me, but they seem to produce polarizing results. They’re used by the most mediocre of control artists and the league’s best pitchers alike. They’re responsible for some of the slowest as well as the fastest, well, fastballs – just watch teammates Adam Wainwright and Jordan Hicks. When a pitcher lobs a bad sinker, hard contact seems inevitable. But when a good sinker is dangled as bait and the hitter bites, there’s no escaping that darn infield.
Extremes can work. They’re also risky, which is why the average pitcher relies on a four-seam fastball. We know what makes that pitch tick, and it slots into any arsenal. Sinkers are trickier to tame, which helps explain why pitchers have shied away from them in recent years. But as I explored earlier this year, a decline in usage does not equal a decline in relevance. If anything, the emphasis on seam-shifted wake has piqued the sabermetric community’s interest in sinkers.
When I wrote the article I referenced above, I was left with a few unanswered questions. For example:
“That being said, I’m not sure if higher sinker velocity correlates to better results, whether that be in terms of wOBA or Run Value… [a]t a glance, there’s no significant relationship between sinker velocity and xwOBA allowed (r^2 = 0.04).”
Immediately, there’s a flaw within that finding. I’d measured the relationship using pitchers who threw sinkers, not the sinkers themselves. It’s possible a pitcher possesses the makings of a good sinker but struggles with command. This time, I got down to business. I had pitch data from the 2018-19 seasons from an earlier project, so that became my sample. One caveat, though: I only included sinkers that resulted in batted balls. For the most part, the intended purpose of a sinker is to generate soft contact, and I felt including whiffs, fouls, and other results would produce murkier conclusions.
Do speedier sinkers make pitchers happier? In 2018-19, the 25th percentile in sinker release speed was 90.5 mph. The 75th percentile was 94.1 mph. If my math is correct, sinkers below the 25th percentile returned a .387 wOBA, whereas ones above the 75th percentile returned a .366 wOBA. Hmmm. There’s a difference, but it’s not dramatic. So far, the simplistic conclusion I made months ago seems to hold up.
Our path is blocked for now, so let’s take a detour. What other characteristics are prominent in quality sinkers? Location seems like a logical start. You don’t need me to tell you that sinkers down in the zone perform better than ones left up, but I figured it’s useful to go over anyway. I grouped sinkers by specific vertical plate locations with a minimum of 20 instances, then calculated the average launch angle in each group. The relationship between location and wOBA is much noisier, and in the case of sinkers, launch angle is an excellent proxy for it. Here are the two variables plotted:

So yeah, keep that sinker low! It drastically increases your chances of inducing a groundball. For the most part, this is true regardless of pitch type. What’s also consistent is the relationship between horizontal location and launch angle. Imagine drawing a parabola that peaked at the center of the zone – pitches located down the middle produce the highest angles, while pitches on either side produce the lowest angles.
This, too, makes a whole lot of sense. But when I narrowed in on sinkers, that relationship became significantly weaker. Instead, plotting horizontal movement against average launch angle produced a result that I expected out of location. Complicating things is the fact that horizontal movement doesn’t seem to matter much for other pitches with respect to launch angle. Whatever they do, sinkers are behaving in the opposite manner. I’m not sure why. Maybe it’s because horizontal location and movement are correlated to each other, but the degree is slight.
What is clear, however, is the relationship between vertical movement and launch angle. This is another truism encompassing most, if not all pitches: Downward movement forces a hitter to get on top of the ball and create weak contact. With sinkers, here’s what the plot looks like:
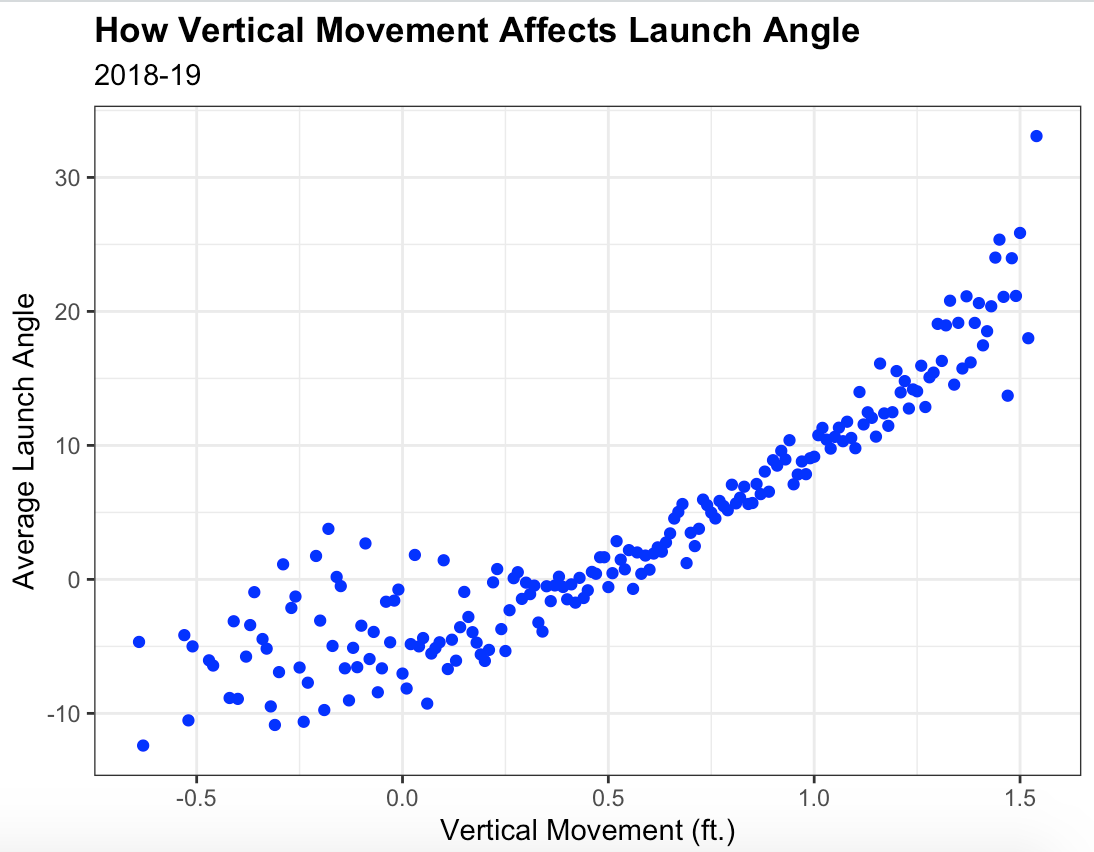
Nothing out of the ordinary here. An ideal location is a start, which is augmented by the existence of movement. Now with everything established, here’s the fun part – we’re going to tie this discussion back to velocity. Consider a sinker that’s located well and comes with fantastic movement. If a batter makes contact against it, what sort of damage should the pitcher expect? Using the 75th percentile threshold from earlier, our broad estimate is a .326 wOBA – pretty good! You could certainly do worse.
Here, what if we add elite velocity in addition to location and movement? In that case, the wOBA value shrinks to .286, a 40-point decrease. To give that a less nerdy spin, it’s roughly the difference between Yandy Díaz and Isiah Kiner-Falefa, offense-wise. Who you would prefer to face is a no-brainer.
But Justin, isn’t this true of other pitches as well? Let’s see. I repeated the above process with the most common pitch types and recorded the results. Extra velocity seems like it would help suppress contact regardless of pitch type, but as we see below, that’s not always the case (note that this is wOBA on contact):
| Pitch Type | Without Velo | With Velo | Diff. |
|---|---|---|---|
| Four-Seamer | .360 | .349 | .011 |
| Sinker | .326 | .286 | .040 |
| Slider | .338 | .404 | -.066 |
| Changeup | .289 | .279 | .010 |
| Curveball | .338 | .341 | -.003 |
I classified sinkers, curveballs, changeups, and sliders as having a good location if they were down, and having good movement if they fell short of a lower bound. Since four-seamers thrive up, however, the inverse applied. With that out of the way, let’s dig in. Four-seam fastballs and changeups do benefit from velocity, but not by much. For curveballs, more velocity hardly makes any difference. Strangest of all are sliders, which apparently do worse with velocity tacked on. Weird, right? This article has already raised half a dozen new questions.
What matters, though, is that among the pitches we examined, none benefited more from elite velocity than sinkers. They’re still useful without it, but that one extra ingredient is what takes them to the next level. This perhaps illuminates why Dallas Keuchel (87.7 mph) and Blake Treinen (97.6 mph) have vastly different results on contact despite both of their sinkers possessing above-average vertical drop, though Treinen also has the benefit of horizontal movement.
Even so, there’s still one question left, one whose intrigue is boosted by the conclusions drawn so far:
“…in this world, there exists both Jonathan Loaisiga (97.8 mph, .210 xwOBA) and Miguel Castro (98.3 mph, .501 xwOBA). The difference between them? That’s perhaps for an article in the near future.”
Months later, not much has changed. Loaisiga’s sinker is still awesome. Castro’s isn’t, even though both offerings are blazing fast, have similar amounts of movement, and are commanded fairly well. What separates the two? It turns out the answer was staring me in the face all along. In my earlier article, I cited a piece from Pitcher List that demonstrated the effect spin axis (or direction) deviation has on a sinker’s launch angle. Loaisiga’s sinker spins out of his hand at a 1:00 direction but shifts to 1:45 as it travels toward home. Meanwhile, Castro’s sinker doesn’t undergo any shift according to Baseball Savant.
That this matters can’t be understated. Here’s my rendition of a graph from the Pitcher List article with 2021 data, which simplifies the relationship between the two variables and displays our pitchers of interest – Loaisiga in red and Castro in yellow:
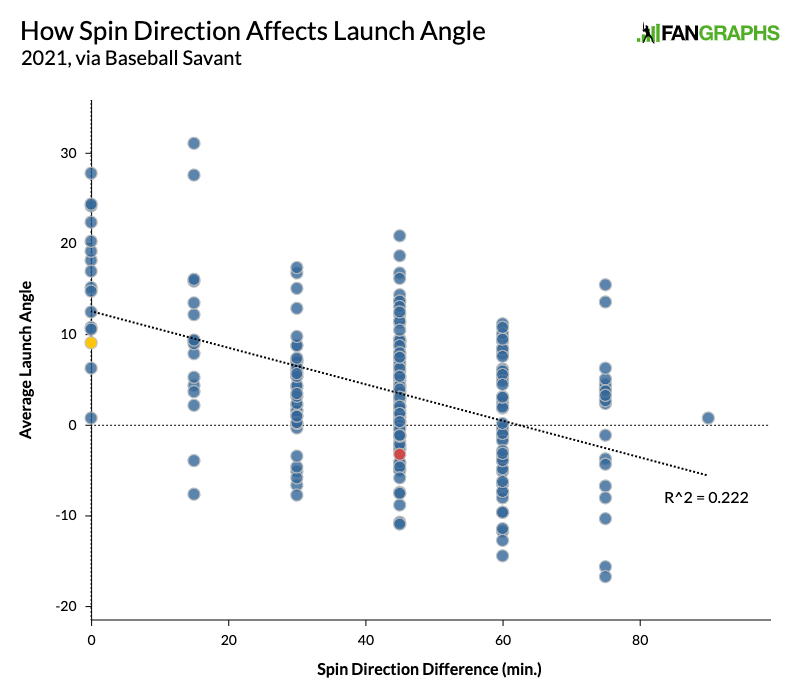
The points are all over the place, but it’s easy to spot the overall trend. Without at least an average amount of deviation, it’s difficult to produce the negative angles that minimize the clutches of BABIP. And if a pitcher wants to live in the extremes, it’s impossible without an outstanding amount of deviation. There’s more to Loaisiga and Castro than this one factor, but there’s evidence that it’s at least relevant. Though we don’t fully understand its intricacies, it’s an element we can visualize and appreciate.
While doing research for this article, I stumbled upon a sort of bonus mystery. I haven’t had time to dissect it, but I did post the gist of it on Twitter:
wOBA on two-seamers/sinkers up in the zone by year
2018: .319
2019: .311
2020: .319
2021: .286?
— Justin Choi ?? (@justinochoi) August 4, 2021
This really is odd. Before 2021, no season in the Statcast era saw high sinkers return a sub-.300 wOBA on contact, let alone sub-.310. That .286 mark (now .293) is, for reasons unclear, an all-time low. One metric that does seem indicative of this sudden dip is average exit velocity allowed:

A drop of 2 mph on such a macro level certainly isn’t a fluke. Might this be related to the new baseball? This season, balls struck at angles between 10 and 20 degrees – a range most high sinkers fall into – are averaging 93.6 mph, up 0.6 mph from 2020. So that explains some of it. On Twitter, a few people suggested this is a residue of hitters attempting to fend off high heat. They’re making contact slightly more often against high four-seamers and sinkers in 2021, so maybe there’s been an intentional trade-off between contact rate and quality.
This wraps up what I wanted to share. I’m sure I’ll unearth further discoveries down the road, though I’m also curious what you think. As it is, sinkers are still an enigma, so any theories are welcome. Plus, I probably, no, I definitely, missed some things. There’s a lot out there!
Justin is an undergraduate student at Washington University in St. Louis studying statistics and writing.
Interesting…..I am a Cubs fan, and have noticed many young Cub pitchers this year throwing sinkers high in zone, which seemed very odd…until I read this article. Cubs have been at the forefront of trying to use pitch lab/tech, is there a connection between that trend and throwing more sinkers high in the zone?
Seems like more are trying that out (Manaea comes to mind), but I don’t think it’s tied to a certain team or philosophy.