A Method for Examining Two-Strike Hitting
Let’s talk about why I love Jamey Carroll. He has had — like most of us would like — his best years after the age of 30; he has played every position except catcher, including an inning of scoreless relief in 2013; he’s short; he spells his name humorously; and he plays a cop in this music video (therabouts of 1:10).
But what impresses me most about him is his rare combination of no power and great plate discipline (as seen here here). There is almost no threat of a homer and only a mild threat of a double when he walks to the plate, but he still induces a walk rate near 10%. Carroll walks more than Robinson Cano and Adrian Gonzalez not because pitchers fear him, but because — as anyone who’s watched Carroll can attest — the 5-foot-11 infielder fights off a half-dozen bad pitches until he finds one he can pop for a single.
Plate discipline is an easier thing to teach than to observe. We tell kids don’t swing at balls and wait for your pitch, but “your pitch” is hard to identify. Hitters themselves have to know which pitches they can handle, which they have to fight off. Statistically, good plate discipline is terribly difficult to sift out. Yes, a good on-base percentage is a great place to start, and a good wRC+ is a good place to finish, but a hitter can still be aggressive, sloppy, and effective (see: Adam Jones, Vladimir Guerrero, and Josh Hamilton).
Today, I wanted to present some tools that will help us visualize differences in plate approach and plate discipline. As with the case of Guerrero (a career .379 OBP), bad plate discipline does not beget a low OBP. But I think one of the best ways for a person to distinguish their bat control and vision is to fight off two-strike pitches and turn a negative situation into a manageable one.
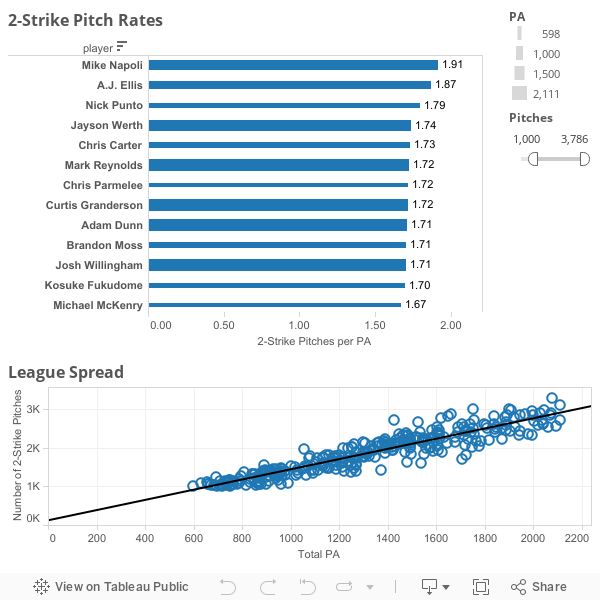
A quick and dirty way of doing this is to find the rate of two-strike pitches per plate appearance:
Now, a player (let’s call him Larry Bamar) who turns every strike into a home run or double and then takes every out-of-zone pitch for ball will be decidedly the best hitter in baseball, but also: this hitter will (a) have great plate discipline and (b) have no two-strike counts to show for it. So yes, looking at two-strike counts is unfair to Larry Bamar and, say, Ichiro Suzuki, who has had great bat control and vision in his career and has displayed that talent earlier in the count, rather than later.
But for most players, getting to two strikes is a more standard event, and staying at two strikes is a distinct challenge.
If you slide the above “Pitches” filter to zero, you will see a tightly-clustered line of data at the bottom left. This represents the intuitively acceptable idea of fewer PA, fewers opportunities to distinguish oneself. I have added a regression line to the bottom scatterplot to help show the middle ground (the average position, as it were), not to suggest some sort of useful predictive relationship between these two stats. Those above the black line have participated in more two-strike counts based on their total PA, those beneath the line, fewer two-strike counts.
With the pitch limits set to 1000, our top two-strike hitter is Mike Napoli (1.91 two-strike pitches per PA) and the bottom hitter is Omar Infante (1.01). Putting these two hitters under the microscope, we can study the anatomy of a good two-strike hitter — or at least the anatomy of a bad two-strike hitter:
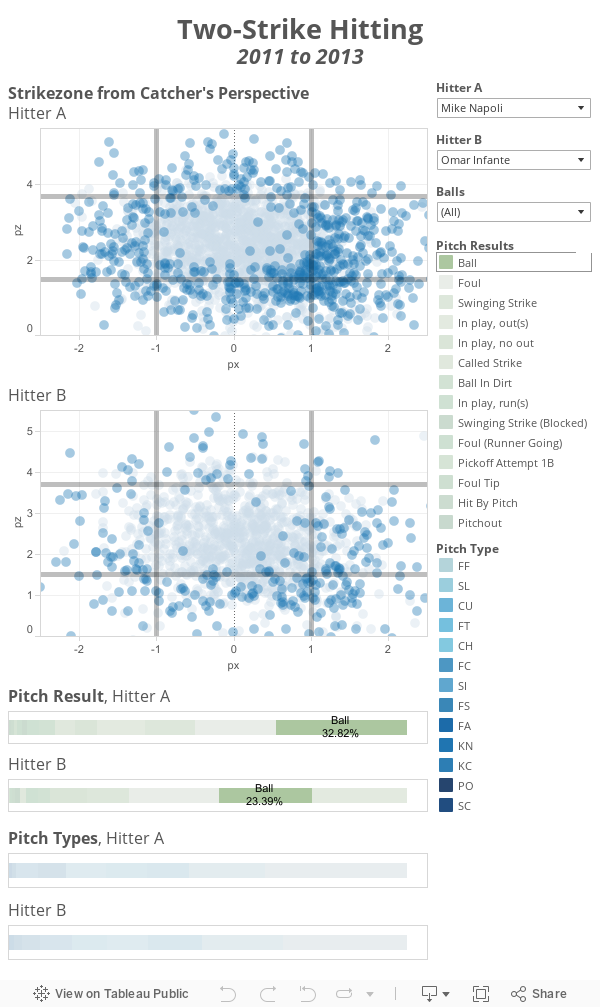
Mike Napoli, hitting with two strikes, takes a called ball more than anything else. Napoli (33% ball-rate) is 1.4 times more likely to take a bally than Infante (23% ball-rate). Infante’s most likely outcome is to put the ball in play for an out (24%), double Napoli’s rate (12%). When the count is 0-2 or 1-2, Napoli and Infante both take balls more than any other result, but Napoli’s rate (41%) far outstripes Infante’s (27%). This could be due to Infante receiving more in-zone pitches, but give he takes far fewer strikes (1.7% compared to 4.4%), I imagine much of it has to do with his high-contact aggressiveness bleeding through.
Click on the green icon for “Swinging Strike.” Here we see the starkest difference. A much greater proportion of Napoli’s whiffs are clustered within the strikezone, while Infante’s aggressiveness with two strikes leads to a large proportion of out-of-zone whiffs. Infante is no doubt a high-contact, high-BABIP, low-walk hitter. But it’s these traits that make him an exceptionally bad two-strike hitter. After reaching an 0-2 count, Infante hits 18 wRC+ while Napoli hits 41 wRC+. A.J. Ellis (No. 2 in the two-strikes rate) hits a 52 wRC+ from 0-2 while Ben Revere (Ellis’s Infante, as it were) sports a 20 wRC+ through 0-2.
My prescription for contact hitters who find themselves 0-2 or 1-2? Pretend you’re a power hitter — especially with runners in double-play positions. Not only does the strikezone shrink 0-2, increasing the likelihood of a called ball, but contact hitters like Infante appear less prone to hit fouls, more prone to hit in-play outs. This seems somewhat similar to Jamey Carroll’s approach (I encourage you to compare him against Infante, as they both possess similar physical talents, but control the zone in very different ways).
Please play around with this tool and add your observations in the comments. If you click on a specific pitch within the strikezone plot, it will single out only all those pitch types, but also those pitch types with similar results (showing a double-split). And you can change the players compared using the drop down menu in the top right or, if you don’t want to wade through a few thousand lines of names, search for the player’s name by clicking that same the drop down menu and then typing into the beige box.
Have fun!
As seen here here?
You know, it’s got a sort of pirate poetry about it. I’m leaving it.