An Early, Nerdy Look At The Challenge System
In the new season’s early going, the challenge system has been all the rage across the majors. If you don’t believe me, you can read ESPN’s coverage of it, or The Athletic’s, or MLB.com’s, or … well, you get the idea. The coverage has been extensive and positive, and I couldn’t agree with its enthusiasm more. I love the new system, and I’m also really excited to think about challenges in general. There are so many fun angles to consider. So here’s the math nerd’s take on what challenges have looked like so far, and what I’m most interested to learn about them moving forward.
How I’m Thinking About Challenges
Every time a strike or ball is called, there’s an opportunity for a challenge, at least so long as the relevant team has one remaining. That makes it easy to measure the prospective value of a challenge on any given pitch: It’s worth however much flipping the result of that particular pitch would change the game situation in the challenging player’s favor. All we have to do is figure out how many runs were likely to score in the inning in each case and compare the two.
That sounds hard, but it actually isn’t so bad. All you have to do is construct an RE288 matrix, which measures how many runs have scored, on average, after the game reaches a given combination of outs, baserunners, balls, and strikes. For example, over the past 10 years of major league play, teams have scored 1.02 runs per inning after a batter reaches a 1-0 count with a runner on third and one out, but using our matrix, we can work out all of the possible run expectancies a batter could reach in that plate appearance:
| Strikes | |||
|---|---|---|---|
| Balls | 0 | 1 | 2 |
| 0 | 0.98 | 0.90 | 0.81 |
| 1 | 1.02 | 0.94 | 0.81 |
| 2 | 1.09 | 0.99 | 0.88 |
| 3 | 1.19 | 1.10 | 0.96 |
Now let’s imagine a catcher weighing whether to challenge a called ball. To determine the value of successful challenge, we can calculate the change in run expectancy of a ball versus a strike. Of course, the situation matters. We’re most interested in those counts where the outcome would result in a walk or a strikeout, as it’s the difference between first and third with one out, or a man on third with two outs. Let’s take a look:
| Strikes | |||
|---|---|---|---|
| Balls | 0 | 1 | 2 |
| 0 | 0.12 | 0.13 | 0.43 |
| 1 | 0.15 | 0.18 | 0.50 |
| 2 | 0.20 | 0.22 | 0.58 |
| 3 | 0.12 | 0.26 | 0.84 |
Those are listed in run values, and they’re are big numbers. Flipping a 3-2 pitch from a walk to a strikeout is worth a whopping 0.84 runs; it’s the difference between a jam and a comfortable inning. Flipping the first pitch of an at-bat is much less impactful. And that’s in an important spot, with a runner on third and fewer than two outs. Next, imagine that our batter hits a sacrifice fly, leaving the bases empty with two outs. The challenge values for each pitch in the next batter’s time at the plate are far lower:
| Strikes | |||
|---|---|---|---|
| Balls | 0 | 1 | 2 |
| 0 | 0.03 | 0.04 | 0.08 |
| 1 | 0.04 | 0.04 | 0.09 |
| 2 | 0.06 | 0.07 | 0.13 |
| 3 | 0.07 | 0.10 | 0.23 |
Flipping a walk to a strikeout still matters, but almost everything else is low value. Even if you don’t do the math, you know this intuitively. If an umpire misses a call deep in the count with a runner on third and one out, it stings. It feels like it could be a key turning point in the game. If a bases-empty, two-out count gets to 1-0 when it could have been 0-1, it hardly matters.
Runs, not flipped calls, are the end goal of the challenge system. You could win 20 challenges in an 0-0 count with two outs and the bases empty and still help your team less than winning a single challenge in a 3-2 count with a runner on third and one out. I’m quite confident that this is the right way to think about it. Tom Tango’s extensive overview of the challenge system uses the same methodology. It’s what I came up with prior to consulting other folks at the site, and it’s also what they came up with before they talked to me. That’s a good sign that runs are the correct currency for challenge value.
Why not use win probability and leverage index? Because you don’t get to take your challenges home with you. If you’re trailing 7-1 in the eighth, leverage index would tell you there’s basically no play that’s really worth challenging. The win probability gains aren’t that high when you’re almost sure to lose anyway. That isn’t right, though. All you can do is use the challenges you have to add as many runs of value per game as possible. A run is a run is a run. That doesn’t change depending on whether you’re behind or ahead, or what inning it is. If you’re trying to measure how much challenges have impacted a team in retrospect, win probability is a reasonable measure. If you’re trying to determine how players should behave, run value is the way to go.
Catchers Are Better At Challenging Than Hitters or Pitchers
With that run value framework in mind, we can take a look at all the challenges that have occurred so far (well, through March 30) and note some broad patterns. Through Monday’s action, teams have issued 227 challenges, 124 of which have been successful, good for a 54% conversion rate. The defense has challenged more frequently, and it’s mostly been catchers; 118 of 124 defensive challenges have come from behind the plate. Hitters have challenged only 103 times.
Defenders have been successful on 57.6% of their challenges, while hitters have been successful on 50.5% of theirs. This tracks with the spring training and 2025 minor league data. It’s just easier for catchers to judge the strike zone. They get to look at the ball directly as it comes in, rather than catching a side-on glance at it, and they’re inches away from the plate instead of 60 feet.
It’s worth noting that 57.6% is not 100%. Catchers have a better idea where the ball crossed the plate, but they clearly don’t have a perfect picture. I think that major leaguers could have already told you this. They’re never totally sure whether or not a pitch was a strike until they go back to the dugout and take a look at their iPad. Why don’t players challenge every bad call? Because they don’t always know whether or not a call is bad in the moment.
Batters Understand Run Leverage
I wanted to understand what makes a player more likely to challenge, so I dug into the data more deeply. I took the population of challengeable pitches in the 2026 season (again, through March 30) and noted each one’s potential challenge value. I split the pitches into three buckets, each with a roughly equal total challengeable gain. For example, the 5,984 lowest-leverage challenge opportunities carried a total challengeable gain of 485 runs, while the next 2,571 challenge opportunities were worth up to 524 runs. The 890 highest-importance challenge opportunities were worth up to 441 runs on their own. (If you’re wondering why the buckets aren’t perfectly equal, it’s because I can’t slice things up infinitely; tons of pitches have the exact same value thanks to the way RE288 works.)
If players are behaving optimally, you’d expect to see a lot more challenges in the highest-value bucket. And great news: That’s exactly what’s going on so far. Batters challenge more frequently, even with a lower accuracy rate, in more important situations. They’re less accurate in those important situations, which is rational. They’re less accurate because they’re challenging more. And they’re challenging more because the value of succeeding is quite high:
| Run Leverage | Challenges | Opportunities | Challenge Rate | Success Rate | Runs Gained Per Challenge | Runs Gained |
|---|---|---|---|---|---|---|
| Low | 49 | 2074 | 2.4% | 55.1% | 0.05 | 2.5 |
| Medium | 32 | 689 | 4.6% | 43.8% | 0.09 | 2.8 |
| High | 22 | 216 | 10.2% | 50.0% | 0.26 | 5.8 |
Now, this data suggests that hitters don’t have a great idea, in the aggregate, of whether a pitch is in the strike zone. In low-leverage situations, you want to be very sure of yourself before challenging. You get unlimited correct challenges, but only two wrong ones. That means that optimal behavior early in the count or with the bases empty is something like “challenge if you know it’s a ball, otherwise save it for a bigger spot later.” And yet hitters have been successful barely more than half the time. Yikes!
That’s not to say that there are no gimme challenges. Elly De La Cruz has only challenged one pitch all year. It came in a 1-0 count with a runner on first and two outs, squarely in the “low run leverage” bucket. That’s the kind of challenge you only make if you’re sure – but De La Cruz was, and he was right.
Of course, there are reasons to challenge even when there aren’t many (or any) runs on the line. The lowest-value challenge by runs added came on a borderline pitch to Spencer Torkelson in an 0-0, bases empty, two out situation. That sounds bad. But it was the ninth inning and Detroit had two challenges remaining. Spend ‘em if you’ve got ‘em in that situation.
Most low-run-leverage challenges are bad, though. That’s how you end up with such a low success rate, and so few runs added per challenge. Denzel Clarke challenged this one. Evan Carter challenged this one, and even made an “I’m not sure” face as he did it. Vladimir Guerrero Jr. burned a challenge with two out and no one on in the first inning. These guys are all undoubtedly being told by their teams to only challenge if they’re sure. They challenged anyway, in a situation where the gain was so small that they had to be certain they were right to have it make sense. It’s just hard to know where the ball crossed the plate!
Catchers Understand Run Leverage, Too
Catchers face a different value proposition than hitters. The population of pitches they technically can challenge includes a lot that they definitely won’t – curveballs in the dirt, fastballs to the backstop, and other miscellaneous non-competitive pitches. Hitters swing at most of the pitches they’re sure are in the strike zone, so the population of pitches they might challenge is disproportionately full of borderline calls relative to catchers. In other words, you can’t compare each side’s challenge rates one to one. But while the denominator is different, catchers behave similarly to hitters, challenging much more frequently in important situations:
| Run Leverage | Challenges | Opportunities | Challenge Rate | Success Rate | Runs Gained Per Challenge | Runs Gained |
|---|---|---|---|---|---|---|
| Low | 59 | 3910 | 1.50% | 62.7% | 0.06 | 3.4 |
| Medium | 43 | 1882 | 2.30% | 58.1% | 0.13 | 5.6 |
| High | 22 | 674 | 3.30% | 45.4% | 0.22 | 4.8 |
We already know that catchers do better than batters overall. They challenge more low-importance pitches than batters and succeed at a higher rate. They also challenge more frequently when winning a challenge is more valuable, despite it coming with a lower success rate. They still aren’t perfect, of course – again, calling balls and strikes is very hard.
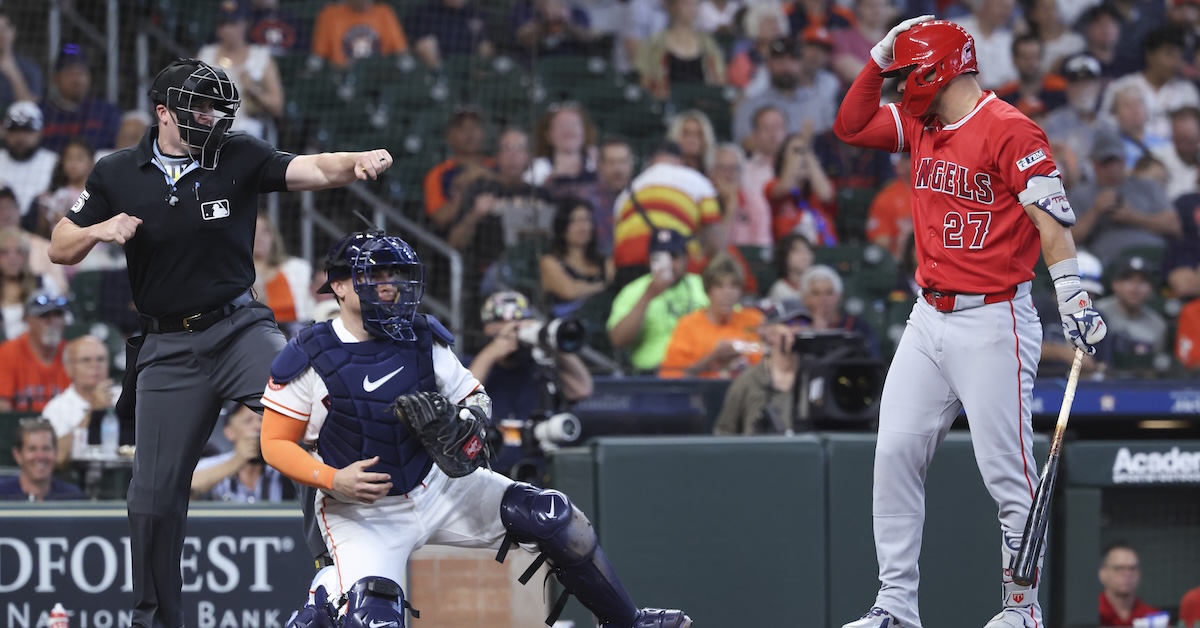
Catchers have challenged in the lowest-importance spot – bases empty, two outs, 0-0 count – five times already. They’ve only been successful 60% of the time. Yainer Diaz missed one in the first inning, and it wasn’t even close. Jonah Heim challenged a pitch that was more than two inches low, perhaps having fooled himself with his own frame job. This shot of him watching the challenge result live is extremely relatable:

So catchers still have some work to do. But it’s clear that they’re generally thinking about this the right way. Challenge rates go up and challenge success rates go down as the rewards for a successful challenge increase. That’s how it should be. In other words, catchers are rational actors, even if they aren’t perfect arbiters of the zone.
Low-Importance Challenges Are Still Happening Too Frequently
The exact math behind a breakeven challenge success rate is tricky, and I’m not confident that I’ve solved it yet. You have to consider your subjective confidence that you know whether the pitch was a ball or a strike, the reward for a successful challenge, and also how many more opportunities to challenge you might have in the game. Given a limited number of incorrect challenges but an infinite number of successful ones, your certainty changes the likelihood of you paying any cost whatsoever for your challenge. I can give you an approximation, though, and I think it has some clear takeaways.
Imagine two hypothetical situations. In one, a catcher has a 50/50 shot at flipping a walk to a strikeout. Since this is hypothetical, let’s say it’s worth 0.7 runs to do so. In the second scenario, the catcher is 80% sure that they can win a low-value challenge, worth 0.1 runs if successful. Here we’ll say that the value of one unspent challenge is 0.1 runs, the average run value gained per challenge issued so far. These numbers are all roughly representative of real-world run values, though the 80% challenge success rate is probably optimistic given what we’ve seen so far.
The math here is pretty easy. Before the challenge in the first scenario, the catcher’s team had 0.1 runs worth of unspent challenges. Fifty percent of the time, they get 0.7 runs and retain a challenge for a total of 0.8 runs of value. The other 50% of the time, they lose and end up with 0 runs of challenge value. The net value, then, is the difference between 0.4, the expected value of challenging, and 0.1, the expected value they held before challenging. That challenge is worth 0.3 runs in expectation, in other words.
Now let’s ask another question: What’s it worth to a catcher to challenge those 80%, low-importance situations over and over until they miss? We can run the math on that too. Twenty percent of the time, they get nothing. Another 16% of the time, they win one challenge and then lose the next. You can keep going down the line like that, adding 0.1 runs for every successful challenge and solving the entire equation. I went as far as calculating the odds of the catcher hitting 25 challenges in a row. Sum up the expected value of the ones they win, and you get that an 80% success rate in low-leverage circumstances, repeated infinitely, is worth 0.39 runs. Given that the initial unspent challenge was worth 0.1 runs, that’s a gain of 0.29 runs of value. In other words, it’s equally profitable to challenge low-importance calls, even with 80% certainty, as it is to challenge a pure coin flip in an important spot.
Of course, I’m probably overestimating the value of that 80% strategy. No one gets 25 chances to challenge in a game. If you limit the catcher to five challenges and assume that they’ll just pocket the unspent challenge for later if they hit all five, that strategy is worth 0.19 runs in expectation. It’s just really hard to be certain enough of a low-importance challenge to offset the value of having one left when you really need it.
You might notice that both strategies have positive expected value. Why not do both, then? That certainly seems reasonable to me. If you have a catcher who can overturn calls with an 80% certainty rate, he should probably do that until he loses a challenge. But the risk of not having a challenge remaining for the high-leverage spots is real. In finance, we used to call this picking up pennies in front of a steamroller. The odds are good – but the rewards aren’t enough to justify the risk.
We Don’t Know Who’s Good Yet
It’s going to take a while to figure out who’s actually good at challenging. There aren’t that many observations, and not every observation has equal value because of the differing run values for different challenges. Winning the most challenges isn’t inherently great. Neither is having the best challenge winning percentage. Teams also seem to be changing their behavior on the fly. It’s going to take a long time to weed out the best from the worst with so much variance. To make matters even more complicated, there’s definitely value in not challenging at times.
That said, we can say who has accrued the most value from challenges so far. It’s Eugenio Suárez. His two challenges – maybe you’ve seen them – were worth a combined 1.73 runs of added expected value. Kyle Schwarber comes in second with 0.71 runs added. On the catching side, Edgar Quero has added the most value, but he’s used a ton of challenges to do so and hasn’t been all that successful on them. Interestingly, pretty much all of the catchers who have accrued the most value have also missed a fairly low-importance challenge already:
| Player | Successful Challenge Value | Chall | Overturn | Runs/Challenge | Best Success | Worst Failure |
|---|---|---|---|---|---|---|
| Edgar Quero | 1.3 | 9 | 4 | 0.14 | 0.46 | 0.08 |
| Salvador Perez | 1.0 | 5 | 4 | 0.21 | 0.50 | 0.11 |
| Samuel Basallo | 0.8 | 3 | 2 | 0.27 | 0.44 | 0.21 |
| Nick Fortes | 0.8 | 5 | 3 | 0.16 | 0.51 | 0.07 |
| Patrick Bailey | 0.8 | 5 | 3 | 0.15 | 0.51 | 0.10 |
It’s Hard To Measure Certainty
As Tango’s research into challenges shows, “just challenge the ones that are obviously wrong” does not describe the reality on the ground. Catchers in spring training challenged just 35% of pitches that were three or more inches inside the zone and were called balls. Those are obvious strikes; they’re a strike by more than a baseball width. These are free! If you challenge them, you get the strike and don’t lose a challenge. And yet catchers, even in a training environment where they were surely encouraged to experiment with the new system, just weren’t sure enough. Heck, they only challenged 70% of pitches two-plus inches into the zone in full counts.
In other words, you can’t just look at where the pitch ends up and say that every single bad call will get cleaned up. No one actually knows where the ball crossed the plate when they’re challenging. No one knows the exact physical location of the strike zone, either. The zone is a theoretical box, not a physical one, and pitches are moving so quickly and so much that batters and catchers are inferring their trajectory rather than perceiving the ball continuously throughout its flight. Sometimes, a catcher is sure the ball is way outside and doesn’t challenge, but in actuality, the ball nicked the zone. Sometimes a hitter is convinced a pitch was in the zone when it was actually four inches low; the opposite happens too. “Sure thing challenges” are sometimes actually pitches that shouldn’t be challenged.
Challenges Work In Two Main Ways
First, they correct some egregious calls early in games. Now, not every egregious call will get corrected; that’s just not how this works. But umpires have called strikes on 31 pitches that crossed the plate 2.5 or more inches away from the zone this year, and batters have successfully challenged nine of them. Similarly, umpires have called a ball on 11 pitches that were in the regulation zone by at least 2.5 inches; defenders have challenged six of them, prevailing each time. The league has cut egregiously wrong calls by somewhere between a third and a half.
Another thing challenges do? Make sure that a lot more of the highest-importance calls are right. So far this year, 624 pitches have been called a ball when the difference between a ball and a strike is worth a third of a run or more. Twenty-six of those calls were wrong, but 10 got challenged and corrected. Batters haven’t done as well, what with not having as good of a sense of the strike zone and all, but 207 pitches have been called a strike when the difference between a strike and a ball is worth a third of a run or more. Thirty-eight of those calls were wrong, and hitters challenged and overturned 11 of those, meaningfully reducing the percentage of important calls that get missed.
That’s great! Egregious misses and high-importance misses are the two times I’m most interested in having a robot ump correct the record. We don’t know a lot about challenge skill on an individual level yet, and I’m not even ready to say anything about which teams are doing the best. Again, this is very noisy data. But challenges are reducing the number of incorrect calls, and they’re doing so in a predictable and desirable way.
I’m excited to continue learning more about this system. My chief takeaways, though, are that it’s doing what I hoped it would, and that fans seem to love it so far. There are tons of fun research questions to consider. When catchers bat, are they better at challenging? How much more should star hitters challenge, and how much more should catchers challenge against star hitters? Does umpire identity change team challenge behavior? What’s an optimal challenge strategy? How does it change based on your roster? Who’s the best at it? Who’s the worst at it?
I don’t know the answers to any of those questions yet. But I hope to find out in the future. And in the meantime, what’s not to like? Calls are more accurate. Both the in-stadium and on-TV experience of a challenged pitch have been rousing successes so far. Players seem to be enjoying themselves. I’m not surprised that the challenge system is a success, because it worked in the minors and copies a system that worked well in tennis. I’m happy that we have it, though, and I think that in short order, everyone will wonder why we didn’t always let players do this.
Ben is a writer at FanGraphs. He can be found on Bluesky @benclemens.
Fabulous article Ben.