Atlanta’s Risky Rotation Imperils the Team’s Comeback Arc
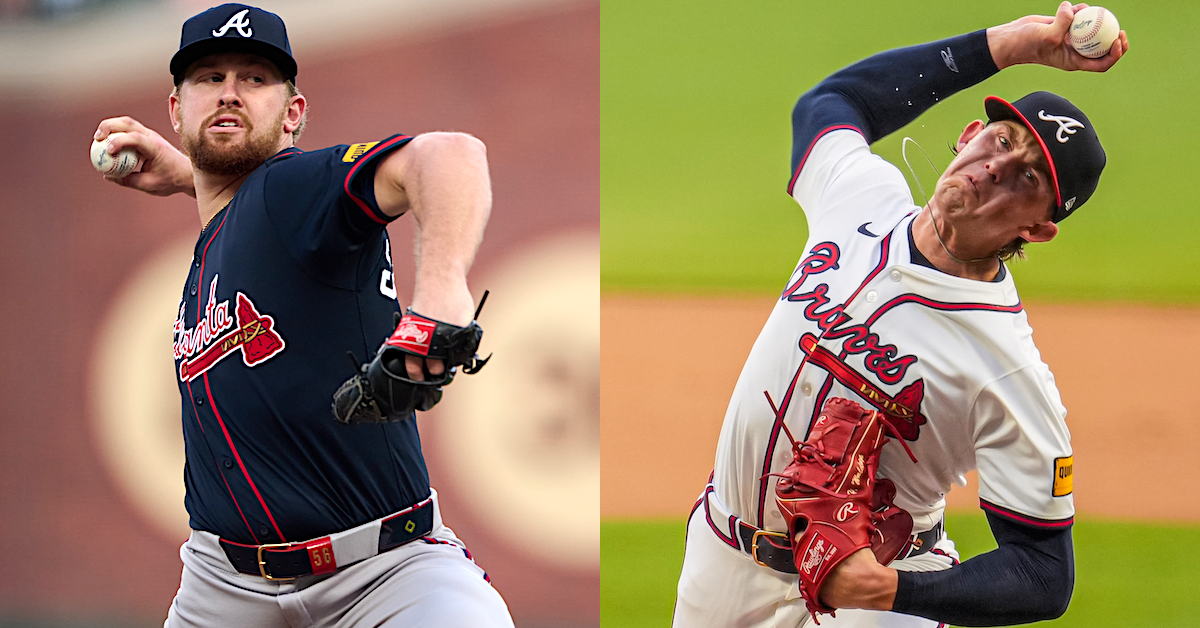
The Atlanta Braves opened spring training with the hopes of getting a healthier season out of their starting rotation this year. While it took a lot of things going wrong to drop the Braves to a 76-86 record in 2025, their worst record since 2017, the myriad injuries suffered by the starting pitching played an outsized role in their misfortune. Unfortunately, the Braves didn’t even get to the first exhibition game before the news broke that two of their starting pitchers, Spencer Schwellenbach and Hurston Waldrep, would have to undergo elbow surgery, with no estimated timeline for their returns.
If there’s a silver lining to manager Walt Weiss’s uncertainty about whether either Schwellenbach or Waldrep would pitch this year, it’s that neither surgery is of the Tommy John flavor, which would pretty much guarantee that both would miss the entire season. Instead, both surgeries are to remove loose bodies from their throwing elbows; Schwellenbach had his procedure on Wednesday, while Waldrep’s is scheduled for Monday. Yes, removing loose bodies sounds like the job description of a bouncer at a hot nightclub, but in this case it refers to the removal of small fragments of bone and cartilage present in the joint.
Regardless, both pitchers are bound to be out for an extended period of time, and their absences will surely be felt in Atlanta. Waldrep was solid for the Braves in 2025, putting up a 3.21 FIP in nine starts, and Schwellenbach looked well on target for a 4-WAR season before an elbow fracture ended his season in late June.
We projected Atlanta to have the third-best rotation heading into last season. But thanks to all six of the top projected starters having a significant injury, the Braves finished 18th in the league in WAR from starting pitching. Surprisingly, after a year that saw Atlanta stare into the abyssal void of injuries, the team apparently decided to see if the void would blink first, and did very little this winter to buttress the rotation. The Braves didn’t sign a single free agent starting pitcher to a major league contract, nor did they add any starters via trade. Their biggest rotation acquisitions were minor league deals for Martín Pérez and Carlos Carrasco.
Despite the injuries to Schwellenbach and Waldrep, the projections aren’t yet panicking about the Atlanta rotation. Our Depth Charts currently project the Braves to rank 10th in baseball in starting pitcher WAR. ZiPS, using our Depth Charts playing time, ranks them about the same, in ninth place. So, everything’s all hunky dory, right? Well, not so much…
For one thing, our projected playing time tends to be on the kind side, generally reflecting what a “mostly healthy” version of a team would look like. Just to illustrate, if you go back to our preseason projected playing time last year, 25 of the 30 teams ended up getting fewer innings from their top five projected starters than our Depth Charts expected. Nearly three quarters (24/33) of the pitchers we projected to throw 170 innings fell short of their expected number of innings, missing their targets by an average of 36 innings. A lot of information about a team is hidden away, not within their mean projections, but in the downside scenarios.
To get an idea of downside in situations like this, I like to stress test the projections. If you’re familiar with finance, or you just enjoy reading very dry articles, you are likely familiar with how this works. In order to test the stability of a system, an analysis is taken of what happens under various hypothetical, but plausible, adverse conditions. For example, what happens if oil prices double? Or the unemployment rate goes up by three percentage points? I have a couple similar stress tests I occasionally use to measure the resilience of a team’s roster.
For starting pitchers, I like to go with a bleak scenario because, well, pitchers are the sports equivalent of a precious vase sitting on the edge of a shelf with a cat nearby. (My cats have broken more dishes than you’ll see shatter in a kitchen scene in a Looney Tunes cartoon.) So I simulate rotation value twice, first with the expected distribution of innings, and one in which the top five pitchers all have their median expectation for innings cut in half. Then ZiPS fills in the remaining pitchers from the depth chart, until the rotation reaches 90% of the previously expected innings. The last bit is to simulate the effect of the bullpen having to carry a slightly heavier load in such an event.
In this stress test, the Atlanta Braves do not fare well.
| Team | Original WAR | Scenario WAR | Difference | % of Original |
|---|---|---|---|---|
| Atlanta Braves | 13.79 | 6.11 | -7.68 | 44% |
| Cincinnati Reds | 14.35 | 6.87 | -7.48 | 48% |
| Seattle Mariners | 13.30 | 6.12 | -7.18 | 46% |
| Kansas City Royals | 13.60 | 6.91 | -6.69 | 51% |
| Philadelphia Phillies | 14.83 | 8.18 | -6.65 | 55% |
| Texas Rangers | 9.63 | 3.00 | -6.63 | 31% |
| Los Angeles Angels | 8.75 | 2.21 | -6.54 | 25% |
| Detroit Tigers | 15.95 | 9.43 | -6.52 | 59% |
| Pittsburgh Pirates | 15.46 | 8.99 | -6.47 | 58% |
| Los Angeles Dodgers | 15.86 | 9.46 | -6.40 | 60% |
| New York Yankees | 11.67 | 5.33 | -6.35 | 46% |
| Toronto Blue Jays | 16.51 | 10.44 | -6.07 | 63% |
| San Diego Padres | 8.58 | 3.09 | -5.50 | 36% |
| Tampa Bay Rays | 10.46 | 5.08 | -5.38 | 49% |
| Miami Marlins | 9.19 | 3.84 | -5.35 | 42% |
| San Francisco Giants | 14.23 | 8.93 | -5.30 | 63% |
| Houston Astros | 12.50 | 7.31 | -5.19 | 58% |
| Cleveland Guardians | 12.60 | 7.88 | -4.72 | 63% |
| Boston Red Sox | 16.70 | 12.04 | -4.66 | 72% |
| Minnesota Twins | 13.22 | 8.66 | -4.56 | 66% |
| Milwaukee Brewers | 13.19 | 8.67 | -4.52 | 66% |
| New York Mets | 13.12 | 8.61 | -4.51 | 66% |
| Baltimore Orioles | 9.66 | 5.27 | -4.39 | 55% |
| Arizona Diamondbacks | 13.35 | 9.29 | -4.05 | 70% |
| Chicago White Sox | 5.34 | 1.31 | -4.03 | 25% |
| St. Louis Cardinals | 9.46 | 5.43 | -4.02 | 57% |
| Chicago Cubs | 9.96 | 6.26 | -3.70 | 63% |
| Athletics | 7.44 | 3.91 | -3.53 | 53% |
| Colorado Rockies | 5.81 | 3.05 | -2.75 | 53% |
| Washington Nationals | 4.31 | 1.58 | -2.73 | 37% |
Now, as you can see, every team takes a hit under this methodology. That’s how it’s supposed to work! All told, in this experiment, the Braves lose more wins than any other team in baseball, dropping nearly eight wins from the typical outlook. This kind of thing ought to especially worry them, simply because their pitchers’ injury histories make this scenario more likely than it is for other teams. Chris Sale has only qualified for the ERA title once in the last eight seasons. Reynaldo López is coming off a missed season due to Tommy John shoulder surgery, and Spencer Strider hasn’t seemed quite the same since returning from his. Grant Holmes missed the final two months of the 2025 season with a torn UCL, though he elected for rest and rehab rather than surgery. Pérez was limited last year due to shoulder and elbow injuries, and AJ Smith-Shawver, who underwent Tommy John surgery last summer, is unlikely to be a reinforcement until late in the season. I probably could have saved some typing by instead just noting that Atlanta’s only fully healthy pitcher last year was Bryce Elder.
Short of making a trade for pitching, Atlanta’s options are limited. Chris Bassitt was a viable innings-eater option, but he is now wearing Oriole orange-and-black. Max Scherzer remains available, but he’s also a 41-year-old pitcher who missed time of his own last year, and didn’t pitch particularly well in any case. Lucas Giolito and Patrick Corbin are out there, but ZiPS doesn’t think that, at this point, they’re better for the rotation than JR Ritchie. Zack Littell had a FIP of nearly five last year, and a pitcher suddenly losing 20% of his strikeout rate is an inauspicious sign.
The Atlanta Braves certainly aren’t doomed, and could very easily get some good news out of the rotation this year for a change. But the two latest injuries reflect their serious downside risk, which is why the ZiPS projections have them several games off the pace of the Phillies and Mets in 2026.
Dan Szymborski is a senior writer for FanGraphs and the developer of the ZiPS projection system. He was a writer for ESPN.com from 2010-2018, a regular guest on a number of radio shows and podcasts, and a voting BBWAA member. He also maintains a terrible Twitter account at @DSzymborski.
I would at least see what Lucas Giolito is asking for if I were them. Depending on whether you look at xERA, FIP, or ERA he was either bad, adequate, or above-average. But that 4.60 ERA / FIP he’s projected for is solidly in 5th starter territory.
That may not be exciting but it’s probably better than Bryce Elder, Grant Holmes, or JR Ritchie I bet it’s better whoever is up after JR Ritchie, who they’re definitely going to need 100+ innings from over the course of the year. I think that’s Joey Wentz? It’s not about replacing Schwellenbach, it’s about preventing a scenario where more starters get hurt and they don’t have anyone competent.
And there maybe is a chance for a bounceback. It was his first year back after missing a whole year due to injury, sometimes it takes another year for the stuff to return (his stuff was down in 2025 vs 2023).