Author Archive

Do Better Players Have More Twitter Followers?

I was reading R.J. Anderson’s recent article on Jason Heyward and Twitter when this question struck me. Obviously better players tend to be more popular, but Twitter offers access to a player’s thoughts, the quality of which might be independent of a player’s ability on the field. So there is at least the possibility that the best players might not have the most popular Twitter accounts.

Here I use FAN projected WAR as a measure of ‘how good’ a player is and compare that to his number of Twitter followers. The number of followers is on a log scale to accommodate the huge range in number of followers (under a thousand to over a million). Players with less than 15 fan projections were left out except for Jason Heyward, whom I just could not leave out. For him I used his current 2.1 WAR plus his CHONE projected rest of the season 1.6 WAR. I got the list of MLB players with Twitter accounts here.

First off the clear outlier is Nick Swisher (@NickSwisher). He has over 1.2 million followers, while his teammate CC Sabathia (@CC_Sabathia) is a distance second with just over 50 thousand followers. Ignoring how Swisher got so many followers, there is a slight trend for better players to have more followers — the linear relationship between projected WAR and log(followers) has a p value of 0.07 and an r-squared of 0.08, and on average each additional win results in 1.25 times more followers. This linear relationship between projected WAR and log(followers) is an exponential relationship between projected WAR and actual number of followers

With Swisher removed there is enough room to plot the remaining players identified by their Twitter account names.

Here it looks more like the lower limit of number of followers is determined by a player’s projected WAR and then there is considerable variation above that limit. For example, David Ortiz (@davidortiz), Carlos Delgado (@carlosdelgado21), and C.J. Wilson (@str8edgeracer) are low projected WAR players with lots of followers. Ortiz and Delgado probably because they both have long histories as very good players and Wilson because he has a particularly active and interesting twitter account.

So there is a weak trend towards better players having more followers with considerable variation based on small market/big market, the player’s history, the quality and quantity of his tweets and any number of other things.


Contreras’s Second Arm Slot Redux

In an injury-depleted Phillies bullpen Jose Contreras’s surprising performance has been a huge help. He has pitched 14 innings and allowed just one run (on a solo home run) while striking out 20 and walking two. That performance has earned him some save opportunities while Brad Lidge and Ryan Madson are on the DL.

Last September I noted that Jose Contreras had stopped using two different arm slots in mid-August of 2009. In light of Contreras’s recent performance I was curious to see whether he was still going with the one arm angle or had gone back to two.

As I did with Brett Anderson, here I plotted small histograms for each of Contreras’s appearances going back to the beginning of 2009. The x-axis is the horizontal release position in feet (0 is the middle of the rubber) and I separate the data by batter handedness.

Here the difference in horizontal release position is not from shifting on the rubber, but from different arm slots. When pitching to lefties he throw with a standard delivery, so he releases the ball closer to the center of the rubber. To RHBs he, sometimes, uses a lower arm angle so he releases the ball closer to 3B (further from the middle of the rubber). In mid-August of 2009 he gave up the lower arm angle and started pitching to both RHBs and LHBs from the standard slot.

But since the start of 2010 he has recovered the lower arm slot. It also looks like his release point is more consistent, but I think this is because he has fewer pitches per appearance now, as a reliever, than he did in early 2009, as a starter. But I could be wrong.

Contreras’s excellent performance cannot be fully attributed to his re-adoption of the lower arm slot — luck has played a huge role. But I would bet that it doesn’t hurt. It is harder for RHBs to pick up pitches coming from that lower arm slot, so if Contreras can effectively pitch from there it should be a help against them compared to the couple months last year when he was pitching just from the one arm slot.


Chris Coghlan’s Glove-Finding Grounders

It is has not been a pretty year for last year’s NL Rookie of the Year Chris Coghlan. In 2009 he had a 130 wRC+ and was worth nearly three wins in just 128 games. But 152 PAs into 2010, his wRC+ sits at a horrid 56, and he has been below replacement level. That’s pretty much the definition of sophomore slump.

Although the problems start with his plate discipline numbers — a big jump in O-Swing% has lead to fewer walks and more strikeouts — I am going to look at what goes wrong when he puts the ball in play. His ground-ball rate has risen from 47% last year to 57% so far this year. As a result, he has just four extra-base hits and an ISO of 0.058. But additionally problematic is that his BABIP on grounders has fallen from 0.280 to 0.183. So not only is he hitting tons of grounders, but very few of them are getting through for hits. This was the part that interested me most: Has he been unlucky with those grounders, hitting them right at fielders? Or are they not hit as sharply? The data we have can not answer the question completely, but can provide a first step.

Here I display Coghlan’s grounders in the way Sal Paradise suggested I do for Jeter back in January. I broke the field into nine slices and show what percentage of Coghlan’s grounders were in each slice (as shown by the size of the slice) and then his BABIP on grounders to each slice (as shown by the color of the slice, with darker having a higher BABIP).

To my eye the profile of where the grounders are going has not changed greatly. If anything he looks to have slightly more grounders up the middle, where you would expect some to get by the pitcher for hits, and slightly fewer straight to the second baseman. The big difference is that almost every 2010 slice has a lower BABIP than the corresponding 2009 slice (lighter in color). So grounders hit at about the same angle in play are going for hits less often in 2010 than 2009. Whether this is luck (good luck on those hits in 2010 and bad in 2009) or because he is not hitting those grounders as sharply, I am not sure. Maybe people who have watched a number of Marlins games this year can weigh in on what it looks like to them.


Pelfrey’s Splitter

Last night, Mike Pelfrey picked up his fifth win of the season, throwing seven and two thirds innings of two-run ball against Atlanta. Although Pelfrey is not as good as his traditional numbers suggest — those five wins and a 3.02 ERA — he has pitched slightly better this year than previously. His xFIP is 4.09 this year compared to a 4.60 career average. That change is largely the result of his increased strikeout rate: 6 K/9 this year, almost a full strikeout per nine more than his career average.

That could just be noise, but Pelfrey is doing things much differently this year. Previously he threw almost 80% fastballs (relying heavily on his sinker) and 13% sliders along with the occasional curve or change. This season he has dropped his fastball percentage down below 70% and has started throwing a splitter, doing so 17% of the time.

This shift is seen dramatically when he gets to two strikes. Before this year he still threw lots of fastballs in these counts, 76% of the time. Fastballs have, on average, the lowest whiff rate, so going with a fastball in a two-strike count is not the best way to get a strikeout. As a result most pitchers throw fewer fastballs in two-strike counts and instead go with breaking or off-speed pitches. Pelfrey’s two-strike fastball rate was quite high compared to average. This year in two-strike counts he has thrown just 62% fastballs, and goes with his new splitter 24% of the time. I think these two-strike splitters, which should lead to more whiffs than his fastballs, play a big role in his increased strikeout rate.

These splitters could also help Pelfrey against LHBs (against whom his career xFIP is an ugly 5.22). Sliders, previously Pelfrey’s main non-fastball pitch, generally have a large platoon split and are ineffective against opposite-handed batters. Splitters, like changeups, have little to no platoon splits, so the pitch could be an important tool for Pelfrey against LHBs.

At this point it is too soon to say that Pelfrey’s splitter will lead to an increased strikeout rate, smaller platoon split or, generally, make him a better pitcher. But the early indications are promising.


Tons of Strikeouts and Walks From Morrow

The Major League leader in strikeouts per nine among starting pitchers, with 11.9, is Brandon Morrow. He is second among starting pitchers in BB/9 with 5.9. If you put that together, and add in his three hit batters, 84 of the 187 batters Morrow has faced have struck out, walked or been hit by a pitch: a hair under 45%. That is tops among qualified starting pitchers, Clayton Kershaw is next with 43%, then Rich Harden with 41%, and those are the only three pitchers above 40%. So Morrow is something of an outlier in terms of keeping the ball out of play on a per plate appearance basis.

Morrow’s strikeouts are a product of his second-lowest 70.9% contact rate (only Tim Lincecum’s is lower). His fastball is electric and the key to that tiny contact rate. Thanks to Harry Pavlidis we know the average fastball generates 16% whiffs (misses/swing not misses/pitch), but Morrow’s has a 23% whiff rate. Since fastballs are thrown about 65% of the time, those extra whiffs add up quickly over the course of a game.

As you would expect for whiff-generating fastball from a fly-ball pitcher, the fastball is generally found up in the zone. Here I plot how much more (red) or less (blue) often you find Morrow’s fastballs in each bin compared to the average RHP’s four-seamer.

You can see they tend to be up in the zone. Against RHBs they are more often inside compared to the average RHP, and against LHBs more often outside. High fastballs tend to be whiffed more often, but also give up more fly balls.

All those extra fastballs up-and-in to RHBs and up-and-away to LHBs are also a big reason for Morrow’s big walk rate. The secondary effect of all those walks is that Morrow has not been able to go deep into games for the Jays, getting to the 7th inning in just one of his eight games. Morrow’s huge strikeout rate makes him an exciting, flashy pitcher, but until he gets his walk rate down that excitement has to be tempered.


Grady Sizemore’s Plate Discipline Problems

Between 2005 and 2008, Grady Sizemore was, by our WAR valuation system, the fourth best position player and one of just four worth over 20 wins. Last year he had an injury-shortened, down year — though was still worth almost two wins — so this year he was looking to reestablish himself as one of the game’s elite players; at this point, that has not happened.

His wOBA sits at a disappointing 0.264. In 119 PAs he has yet to hit a home run. His strikeout rate is at an all-time high, while his walk rate and ISO at all-time lows. The plate discipline issues problems seem particularly troubling. Over his career Sizemore has had great plate discipline numbers, but this year Sizemore is swinging at 32% of the pitches he sees out of the zone. His career average is 19%, and his previous high is just 20%. On the other hand, he is swinging at fewer pitches in the strike zone, just 59% compared to a career average of 65% and a previous low of 63%. So it is not that he is just swinging more at all pitches, rather he is swinging at more pitches he shouldn’t and at fewer pitches he should. That is what leads to his career-high K rate and career-low BB rate, and probably plays a role in his power decline.

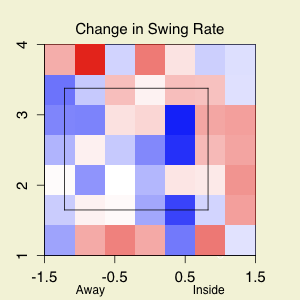
Using the pitchf/x data I looked at his swing rate broken up into bins by pitch location. Then I looked at the change in swing rate for each location between this year compared to 2007-2009 (the years covered by the pitchf/x data). Red locations have a higher swing rate in 2010, while blue a lower swing rate in 2010. The color intensity represents the magnitude of the difference.

Since he has only seen 470 pitches this year the data are a little noisy, but you can see a clear trend. Locations outside the zone have a higher swing rate, particularly on inside pitches, while those in the zone, particularly down-and-away, have a lower swing rate. So the pitchf/x data support the BIS plate discipline numbers, and they are troubling for Sizemore and the Indians.


Gardner Is Swinging at Nothing

Last year I wrote an article about Luis Castillo’s extreme approach at the plate. His no-power swing rarely missed, so he could take a large number of pitches with under two strikes, because, if he got to two strikes, he had little chance of whiffing on strike three. The upshot was that he extended at-bats hoping to accumulate enough balls to get a walk or find a pitch he really liked to hit. It is an intriguing approach for low-power guys who have the contact skills and plate discipline to pull it off.

So far this year the new poster boy for such an approach is Brett Gardner. He has always employed it to some extent but this year taken it to new levels with his league-lowest 30% swing rate and 40% Z-swing rate. Gardner does not have quite the contact skills of Castillo — though has more power — but so far this year he has shown an amazing ability to make contact with pitches in the zone. Here are all the pitches Gardner has seen so far this year, color coded by pitch type. Pitches he took are in a light color and pitches he whiffed are encircled.

At least according to pitchf/x he has whiffed on nothing unequivocally in the zone (the plate discipline section on the player pages is based on BIS data). He has whiffed on some breaking and off-speed stuff below the zone and on a couple of fastballs above the zone, but not much. You can also see the huge number of pitches he has taken in the strike zone.

Gardner is not going to keep up his .419 wOBA — buoyed by a .380 BABIP and 13 steals on 14 attempts — and probably will not have more walks than strikeouts at the end of the year. But even before this year he was an above-average offensive player and these first 94 PAs suggest he will be even better this year.


Santana’s Fastballs the First Time Through the Order

Yesterday I read an interesting piece in the New York Daily News (via Hardball Talk) about Mets’ pitching coach Dan Warthen’s plan for Johan Santana this season. Some worry that the declining velocity on Santana’s fastballs could negatively impact his devastating changeup. So Warthen wanted Santana to throw more fastballs, and particularly inside fastballs, the first time through the lineup so that his changeup is more effective in subsequent passes through the lineup. Setting aside the question of why you would want to announce Santana’s plan to the media I was interested to see whether Santana is pitching this way.

Here is a look at Santana’s pitch breakdown (with percentage of fastballs that are inside indicated) broken up by first time through the order versus subsequent at-bats for before 2010 and in 2010.

 
pre-2010
              FA   (%inside)  CH     SL
first time    61.5 (10.4)     27.4   11.1           
after that    59.0 (13.9)     30.0   11.0

2010
              FA   (%inside)  CH     SL
first time    64.2 (12.1)     26.9    8.9        
after that    56.5 ( 6.4)     28.4   15.1 

It does look like Santana is throwing more fastballs the first time through the lineup compared to before and then fewer in subsequent at-bats. The inside fastball percentage also shows a trend in the direction indicated, although I don’t know how much of that is just noise. But instead of the reduced fastballs giving rise to more changeups in subsequent turns through the lineup it looks to me like it is giving rise to more sliders. At this point in the season I do not think we can attribute this change in usage to how he is performing, but it is interesting to note that the numbers bear out Warthen’s stated plan for Santana.

More generally the question of whether additional fastballs the first time through the order make off-speed pitches more effective the next time through is an interesting one, but — as with all issues of pitch sequencing — it is a pretty daunting question to address.


Colby Lewis’s Sliders

April could not have gone much better for Colby Lewis, or his main promoter, Carson Cistulli. While other FanGrahps authors think his Cy Young chances range from 2% to skim, Carson continues to “pimp his dawg” (or whatever youthful slang Carson would use to describe his support). And for good reason: he sits just behind Brandon Morrow on the AL K/9 leaderboard with 10.47, and, although he has had some HR/FB luck, he still has a solid 3.60 xFIP.

Compared to his previous time in the MLB, he is getting tons more swings outside the zone and swinging strikes — not surprising given his huge strikeout rate. This increase seems due, at least partially, to increased slider use. In his pre-NPB days he threw it 7% of the time, but through five starts this year he is throwing it a hair below 30% (according to the BIS classifications as well as my classifications of the pitchf/x data). By linear weights of the BIS classifications it is his nastiest pitch, already worth 5 runs above average, and I see it getting swinging strikes 20% of the time. The average slider last year got a swinging strike 13% of the time. Overall, Lewis is getting just under 12% swinging strikes compared to a league average of 8%.

Lewis, like most RHPs, throws his slider more often to RHBs, 35% of the time compared to 25% fo the time to LHBs. Here are the locations of his sliders to RHBs, with contacted pitches and whiff pitches marked. Unlabeled pitches were taken.

When Lewis leaves his slider up-and-in it has not been missed, but when they are down-and-away he gets tons of swinging strikes. This is a common pattern with sliders, and Lewis has done a pretty good job of keeping his down-and-away.

Patrick Newman, also a FanGraphs author, has a great pitchf/x-like tool for the NPB and with it we can go back and look at Lewis’s starts there. You can find it here, choose any date and see his pitch type and velocity over the course of a game. A cursory look through this shows a healthy dose of sliders, so it seems to me that this increased use of sliders was something that he started in Japan. So far it has worked wonders for him back in MLB.


Anderson Used to Shift His Position on the Mound

We here at Fangraphs are big Brett Anderson fans: Dave Cameron has a huge crush on him; I fawned over his crazy slider; Marc Hulet saw him as the AL ROY favorite last August and then was devastated when he missed out on him in his fantasy auction; and, RJ Anderson and David Golebiewski see him as one of the game’s top starters. So when a commenter to my post last Thursday on Sheets shifting his position on the mound noted that Brett Anderson used to do this too, I jumped at the opportunity to check it out.

In this image I plot the histogram of his horizontal release points versus RHBs (solid) and LHBs (dash). In April and May he had two clear release points: one to RHBs and another shifted to the extreme arm-side of the mound to LHBs. But starting in June and continuing for the rest of the season — and in his starts so far this season — he uses a single location on the mound, the one he had previously used just to RHBs. On the right side of the graph it shows the number of Ks and BBs he had that game. (There is no pitchf/x data for his April 28th start.)

We all know that correlation does not equal causation — so we cannot say that Anderson started doing better because he stopped using two different positions on the mound — but it is interesting that at the same time he dropped the second position on the mound he also started pitching much better (FIP of 5.88 in April and May versus a FIP of 3.04 from June on).