Ben Clemens FanGraphs Chat – 5/17/21
by Ben Clemens


May 17, 2021
Pierce Johnson wasn’t the highest-profile addition the Padres made before the 2020 season. Johnson, a right-handed pitcher who began his career in the Cubs minor league system as a starter, transitioned to relieving and then transitioned to Hanshin in the NPB, where he delivered a standout 2019 season. Along with fellow offseason acquisitions Drew Pomeranz and Emilio Pagán, he was part of a reworked bullpen for a newly-aggressive contender.
Johnson’s 2020 went fairly well, aside from the whole global-pandemic-changing-the-entire-world part. He started throwing harder during his sojourn to Japan, and held that new velocity upon his return. His blend of roughly 50/50 fastballs and curves played quite well; he put up a 33.8% strikeout rate en route to 20 innings of 2.70 ERA, 3.14 FIP relief.
In truth, Johnson’s fastball was just a palate cleanser for his devastating curve. He used it early in counts and when he got behind, but threw nearly 75% curveballs in key spots — 1-0, 0-1, and 1-1 counts, as well as when he reached two strikes. It’s easy to see why when you look at the curveball’s merits. Among pitchers who threw at least 150 curves last year, it was one of the best in the game:
| Player | Pitches | SwStr% | Whiff/Swing |
|---|---|---|---|
| Shane Bieber | 325 | 25.8% | 51.5% |
| Drew Smyly | 176 | 23.3% | 50.0% |
| Aaron Nola | 306 | 22.5% | 41.8% |
| Pierce Johnson | 168 | 22.0% | 48.1% |
| Germán Márquez | 311 | 21.9% | 43.3% |
| Aaron Civale | 254 | 20.5% | 39.4% |
| Tyler Glasnow | 335 | 20.0% | 52.8% |
| Tyler Duffey | 188 | 19.7% | 41.6% |
| Jesús Luzardo | 214 | 19.6% | 45.7% |
| Framber Valdez | 351 | 19.1% | 41.9% |
That’s excellent company, to state the obvious. It’s not as though the pitch is a wipeout breaker that only excels when he bounces it, either. In obvious strike-throwing counts (2-0, 2-1, 3-0, and 3-1) since returning from Japan, Johnson has hit the strike zone with his curveball 58.6% of the time. That’s higher than his fastball zone rate in the same counts (42.1%) and higher than the overall league zone rate for all pitches in those counts (56.9%).
Read the rest of this entry »
Last week, I investigated something that I’ve long wondered about: are relievers particularly prone to wildness on their first batter of the game? I didn’t find much of an effect, and I also got tons of valuable feedback about further avenues for investigation. Do base/out states matter? Does handedness matter? Do intentional walks skew the data?
Aside from the last one (a definite yes), I haven’t explored all of these avenues yet. I did, however, answer another question I was curious about, one that ties into the general theme of reliever walk rates. I’ll tell you upfront that I found a confusing result, and that I’d love to hear anything I’ve missed or avenues for further investigation.
Here’s the question I’m answering: when a reliever walks the first batter he faces, what does that tell us about the rest of his appearance? All of us have seen this in practice, and we probably all know the existential dread it engenders. Great, he doesn’t have his command today. How many walks are coming up? Is the lead safe? Will the team even stay in the game long enough for a new pitcher comes in?
To explore this possibility, I examined every game thrown by a reliever since the beginning of the 2015 season. I split each reliever’s appearances into two subsets: every appearance where they unintentionally walked the first batter they faced on one hand, and every other appearance (except intentional walks, I threw those out) on the other. This gave me a sample of 1,085 relievers across more than 80,000 appearances. Read the rest of this entry »
When we last checked in on our partially crowd-run Out Of The Park Baseball team, the season wasn’t yet underway. We spent the offseason building pitching depth after a nightmarish injury season left us with a bullpen made of duct tape and late-season callups. In an effort to avoid a recurrence of that problem, we came into this season with pitching depth that could best be described as excessive.
Even after trading Eric Lauer (more on that in a second), the team went seven deep on starters: Brandon Woodruff, Kevin Gausman, Collin McHugh, Freddy Peralta, Adrian Houser, Corbin Burnes, and Brent Suter are all at least candidates for a rotation spot. Surely, I (and you) reasoned, that depth will sustain us even if injuries become a problem again.
Good news: through 42 games, injuries haven’t been a problem. Our top five starters have made all 42 starts, though virtual Adrian Houser is headed for the bullpen unless he turns things around quickly; his 10.64 ERA isn’t reflective of his true talent, but his 9.25 FIP isn’t exactly a great sign. He’s become a two-pitch pitcher in this simulation, so a swap with Suter might suit both.
Read the rest of this entry »
In 2018, Matt Barnes had a promising season for the Red Sox. He struck out 36.2% of the batters he faced en route to a 3.65 ERA and 2.71 FIP. His one weakness? He walked 11.7% of the batters he faced, a dangerous number. That pattern carried through to 2019; he struck out 38.6% of his opponents but walked 13.3% of them. That strikeout rate is wonderful, but the walks gave him little margin for error, as evidenced by 2020, when he struck out 30.4% of his opponents (still great) but walked 13.7% on his way to a below-replacement-level season.
In 2021, you’ll never believe it — Barnes is striking out the world again, with a 48.4% strikeout rate that’s fourth among relievers, behind only Aroldis Chapman, James Karinchak, and Josh Hader. Oh yeah — he’s also walking 4.8% of his opponents and has been quite possibly the most valuable reliever in the game. Let’s get an explanation for that, shall we?
At surface level, it’s easy! Take a look at swinging strike rate, a statistic that becomes reliable quickly:
| Year | SwStr% | K% |
|---|---|---|
| 2015 | 9.5% | 19.6% |
| 2016 | 10.8% | 24.7% |
| 2017 | 12.0% | 28.9% |
| 2018 | 14.5% | 36.2% |
| 2019 | 14.9% | 38.6% |
| 2020 | 11.3% | 30.4% |
| 2021 | 19.1% | 48.4% |
A 19.1% swinging strike rate is excellent; top-of-the-league excellent, really. Also true: Barnes hasn’t changed his pitch mix. He’s a two-pitch reliever, with a riding four-seamer and hammer curve. He throws them both roughly half the time, and they spin more or less exactly opposite out of his hand, which seems to help them both play up:
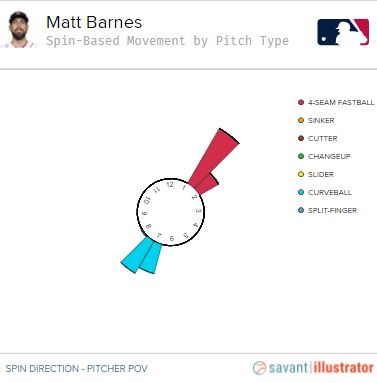
Great, problem solved. Hard curveball, decent fastball, they both play into each other’s deception, sounds like a good reliever to me. One small problem: there are maybe 50 relievers like that in baseball, and Barnes was also like that in the past, when he was far more walk-prone without his current killer strikeout numbers. Read the rest of this entry »
On Wednesday afternoon, Liam Hendriks entered a tough situation. There were two outs in the bottom of the ninth, but his margin for error was nonexistent. The bases were loaded, and the White Sox were locked in a tie game. One hiccup in command, four slightly misplaced pitches, and the game would be over.
Do pitchers have less command when they enter? Is it worth worrying about whether a pitcher might not have it that day? I have no earthly idea, so I decided to investigate. First things first, though: I wasn’t actually sure what I was investigating. Time for some experimental design.
What about the walk rate, but only on the first batter faced by a new reliever? That’s certainly a number I could look up. That checks in at 8.1% from 2015 to present (I used the Statcast era even though there’s no Statcast data involved in this query, just for consistency’s sake). Over the same time frame, the overall reliever walk rate is 9.3%. Case closed, let’s go get brunch.
Only, that’s a bad comparison. We’re not comparing apples to apples. If we’re actually going to look into whether pitchers are particularly likely to come in and not have it, we need to compare like to like. Take the immortal Sugar Ray Marimon, who made 16 appearances for the Braves in 2015. He was a one-hit wonder, though “wonder” might be strong: he compiled a 7.36 ERA in 25.2 innings before decamping to Korea. Read the rest of this entry »
There’s no one way to hit well, but there is one constant in hitting: batters swing too often. The intuition behind that fact isn’t hard to get to: if you swing at a pitch outside the zone, you’re taking a ball and turning it into weak contact (it’s hard to hit pitches outside the zone with authority) or a strike — that’s bad! If you swing at a pitch in the zone, you’re turning a strike into either a strike (if you miss) or contact. Swinging is so bad outside of the zone that it overwhelms the advantages of hacking in it.
I don’t mean to imply that this should extend to logical extremes — you can’t literally never swing — but the numbers are clear. In 2020, batters were worth 3,030 runs below average when swinging. They added the same amount when they didn’t swing. This isn’t a fluke: batters have already added 1,350 runs relative to average by taking pitches this year — you guessed it, they’ve cost themselves as much by swinging. In every full season since the advent of pitch tracking in 2008, swings have cost offenses at least 6,000 runs. It’s just a fact — hitters swing too frequently.
José Iglesias has probably never heard this advice. He’s in the midst of one of the swing-happiest seasons of recent memory, and he’s doing it in exactly the way that worries you — a mountain of chases. There’s just one twist — it hasn’t sunk him just yet, despite everything I said up above, and it’s fascinating seeing him survive.
The top of the chase rate leaderboard is filled with powerful hitters. Salvador Perez leads the way so far, with a 49.1% swing rate on pitches outside the zone. Luis Robert is in second. Javier Báez is in the top 10, as is Nick Castellanos. I don’t mean to say that you can’t be a good hitter when you get fooled that often — all of the batters I named are having good years. They’re producing in a particular way, though: plenty of misses, but loud contact when they do connect. Read the rest of this entry »
Let’s not sugarcoat it: Kris Bryant was bad last year. Sure, it was only 147 plate appearances, but the sheer broadness of his struggles made it feel longer. He set career lows in batting average, OBP, slugging percentage, walk rate, barrel rate — you name it, and there’s a good chance he fell short in it. With the Cubs in salary relief mode this offseason, there was talk of a non-tender, and it certainly wasn’t good for Bryant’s free agency hopes.
That feels like less of a worry now. Through the first month of the season, Bryant has been tremendous. April marks don’t compare well to full-season numbers, but far from continuing his swoon, he’s posting the best numbers of his career nearly across the board. He looks like an MVP candidate again, and it’s a good thing for the Cubs, who need all the offensive help they can get given how many of their regulars are struggling.
What changed? As Tom Verducci detailed, Bryant is swinging differently, and it’s paid dividends so far this year. Let’s dig into the numbers and see how that new swing (in fairness, it’s still pretty similar to the old swing) is working so well.
Take a look at this heatmap of the four-seam fastballs Bryant faced in 2015 and ’16:

That’s right: four-seam fastballs low in the zone. Bryant devoured those pitches en route to 14 WAR over the two years. Next, look at the four-seamers he saw in 2019 and ’20:
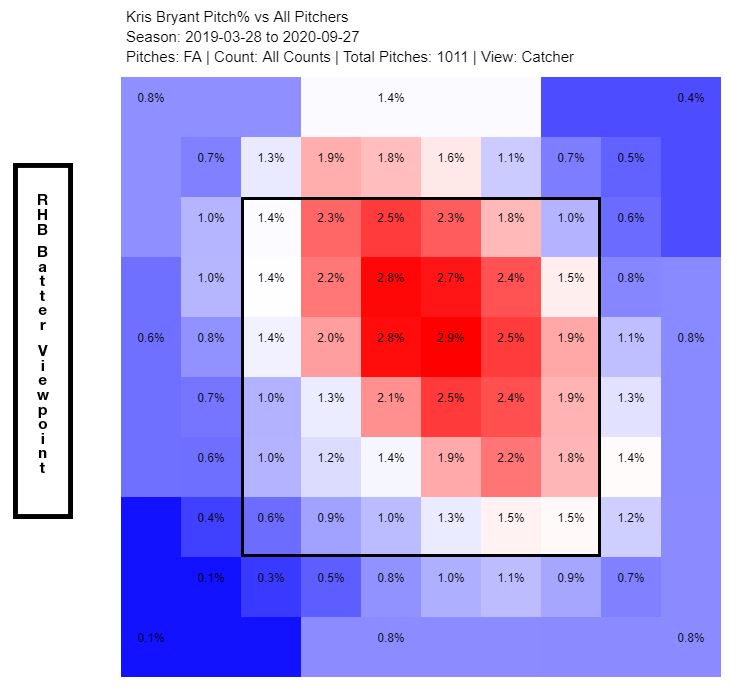
Read the rest of this entry »
Wednesday night, the Marlins defeated the Brewers by a comfortable 6-2 margin. Though the game wasn’t close, it could have been slightly closer: the Marlins saved a run with a clutch sacrifice fly double play in the bottom of the sixth. That’s a standard play; every level from youth tee ball on up has catch-and-throw double plays. That doesn’t mean it wasn’t impressive. In fact, the moment-to-moment action of the play shows how impressive baseball players are even on plays we think of as de rigueur.
Here, watch it in real time:
Let’s start with the pitch: Sandy Alcantara couldn’t have done much better. He dotted the bottom of the zone with a 99 mph sinker, the perfect location to induce an inning-ending ground ball. Seriously, it’s hard to draw it up any better than this:
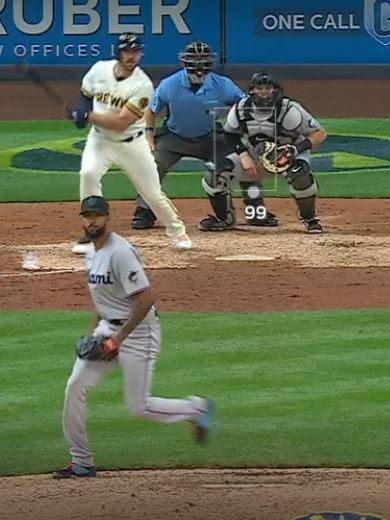
That’s a perfect location for a grounder-inducing pitch. When he’s located that pitch on the bottom edge of the zone, good things have happened: he’s saved roughly four runs relative to average per 100 sinkers he’s located there. That’s roughly in line with the best overall pitches in baseball. When he spots it, in other words, the Marlins are right where they want to be.
Travis Shaw begged to differ. Well-spotted pitch, plus velocity: he hit the smithereens out of it. The ball came off his bat at 101.7 mph, a veritable laser beam. Combined with its flat 12 degree launch angle, that ball is a hit the vast majority of the time; it carried a .910 expected batting average per Statcast, though that ignores the horizontal angle (or spray angle), and Shaw happened to hit it right at a defender. Read the rest of this entry »