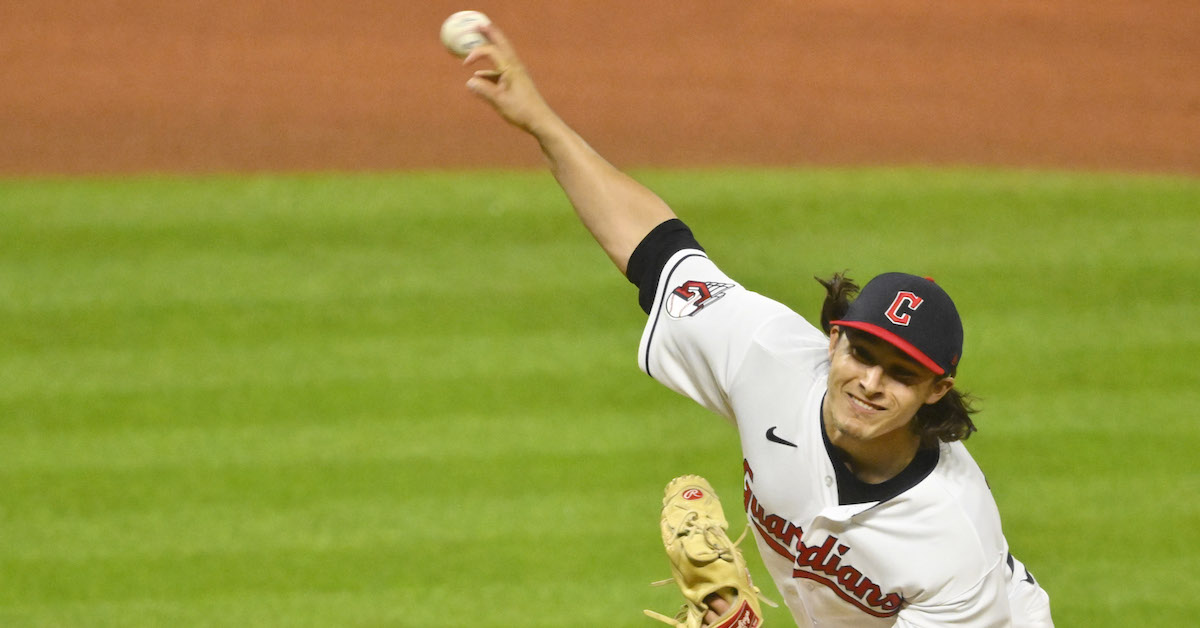
Eli Morgan is one of the best-kept secrets in baseball. He’s not a high-leverage reliever for a marquee team. He’s not even the best or most famous reliever on his own team. Heck, he was a middling five-and-dive starter in the majors just last year. But none of that matters anymore, because now he has a cheat code:
That changeup is absolutely ludicrous. It looks like no other pitch in baseball. It’s slow, much slower than the rest of Morgan’s arsenal. Every other one of his pitches is in the vicinity of league average, while his changeup is the slowest in baseball. That makes for huge separation from his fastball; if the two started on the same trajectory, the changeup would fall 30 more inches than the fastball on its way to home plate. That’s nearly half an Altuve. Read the rest of this entry »
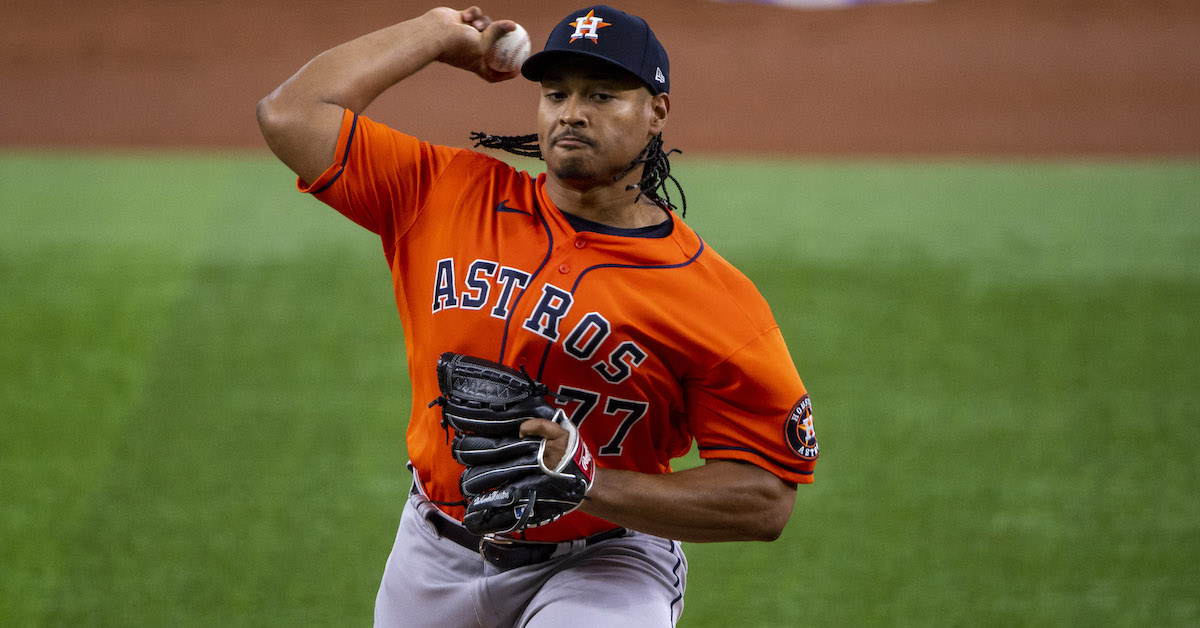
On Wednesday, the Astros easily handled the Rangers. They won, 9–2, with Luis Garcia’s strong start backed by a typically robust offensive performance. The Astros are very good. The Rangers are significantly worse. There are baseball games like this every day, multiple of them even. But this game stands alone, for one singular feat.
Er, well, dual feat. In the second inning, Garcia was simply too much for the Rangers. He faced Nathaniel Lowe, Ezequiel Duran, and Brad Miller, and wasted no time in setting them down:
That was the 107th immaculate inning — nine pitches, three strikeouts — in baseball history. It wasn’t the most recent one for long, however. In the seventh, Phil Maton came on in relief of Garcia and got right down to business. He faced Nathaniel Lowe, Ezequiel Duran, and Brad Miller, and wasted no time in setting them down:
Hey, that was really convenient! I got to use the exact same sentence again, because Maton exactly repeated Garcia’s feat; he tore through the three Rangers in only nine pitches for the 108th immaculate inning in history. It was, as you’d expect, the first time the same team has accomplished the feat twice in one game, as well as the first time it’s happened twice on the same day, to give you an idea of how out of the ordinary this was.
You didn’t need FanGraphs to tell you that was remarkable, though. Everyoneelsealreadyhas. Instead, I thought I’d take a look at perfect strikeouts — three pitches, one strikeout, no beating around the bush — and see whether this game still stands out if we remove the “innings” part of immaculate innings.
Garcia had those three perfect strikeouts in the second inning, but he actually managed another one in the game. It was, in fact, the next batter he faced: Leody Taveras went down on consecutive pitches before Marcus Semien took a first-pitch ball to end Garcia’s streak. Four three-pitch strikeouts in a game sounds quite impressive, but it’s not even the most in a game this year. Zach Eflin reeled off six perfect strikeouts in his start on May 22. Six other players have notched five such strikeouts in a game, including Garcia himself on April 22.
Extending our lens backwards in time to 2007, the earliest year in the pitch-by-pitch database I used, you’ll be unsurprised to learn that Max Scherzer holds the single-game record. On May 11, 2016, he tied a far more visible record with 20 strikeouts in a nine-inning game. He also struck out nine batters on exactly three pitches. Scherzer might just have a knack for this; he also notched two separate games with seven three-pitch strikeouts (May 26, 2017 and September 20, 2018).
There have been 11 games since 2007 where a pitcher recorded seven or more three-pitch strikeouts. No one else has more than one. Scherzer, it turns out, is the master of the efficient strikeout. Other good pitchers have approached those heights, but only rarely. Here are those 11 games:
That’s neat, but focusing on that fact highlights only Garcia, and not particularly well at that. If we’re focusing on team perfect strikeouts, the Astros mustered seven; Garcia’s four and Maton’s three were the only ones of the game. That’s part of a three-way tie for most in a single game this year. The Rays notched seven on April 14, and the Astros did it again on April 24. If you’ll recall from above, that’s the game where Garcia had five perfect strikeouts. He’s the standard-bearer for the feat this year.
Zoom out, and things get Rays-y. On August 17, 2019, they struck out ten batters on three pitches apiece, the only team (!) to eclipse Scherzer’s nine-strikeout effort. Houston pitchers certainly looked dominant yesterday, but they needed an entire extra immaculate inning to match the standard Tampa set.
Are you less interested in the specific game and more interested in Garcia’s three-pitch-strikeout prowess? He has 17 of them on the year, which certainly sounds impressive, but only places him in a tie for seventh among pitchers in 2022. Shane McClanahan is first, with a whopping 23. Nestor Cortes, of all people, has 18. Scherzer has 15, and he hasn’t pitched in a month. Garcia is certainly one of the best pitchers in baseball when it comes to going right after the batter and setting them down, but he’s not the best in the business.
Did I succeed in exhausting everyone’s interest in three-pitch strikeouts? Who knows! I find them quite interesting, but then, I find a lot of things about baseball quite interesting. I found yesterday’s Astros feat amazing, but giving it a little more context just makes Scherzer’s feats stand out even more. The three-pitch strikeout is the ultimate expression of pitcher dominance — no waste, just three straight strikes, next please — and it stands to reason that the marquee strikeout pitcher of our generation is also the marquee three-pitch-strikeout pitcher of our generation.
Dakota Hudson shouldn’t be this good. It’s hard to analyze baseball, and pitchers are good for all sorts of difficult-to-comprehend reasons, but look at his numbers. It shouldn’t work. His career strikeout rate is a lackluster 17.2%. He walks more than 10% of the batters he faces. Either of those numbers would be alarming; both together is a recipe for trouble.
Naturally, Hudson is off to another roaring start. His 3.29 ERA is actually worse than his career mark, and it’s still 17% better than league average in this low-scoring year. He’s outperforming every available peripheral by miles – just like he always has. Three-hundred-and-fifteen innings into his major league career, his stat line will make you question what you know about ERA estimators. His FIP is a so-so 4.56. It’s not some home run rate fluke, either; his xFIP is exactly the same. SIERA clocks him at 4.96. xERA, the Statcast version of an ERA estimator, is right in line with everything else at 4.55. And yeah… his career ERA is 3.17. So let’s investigate what the heck is going on. Read the rest of this entry »
Recently, I was listening to one of my favorite non-baseball podcasts when baseball unexpectedly cropped up. Well, the theory of skin in the game cropped up. The idea, espoused by many people but notably by Nassim Taleb, is that actors perform better when they get rewarded for a good outcome and punished for a bad outcome. Want a better doctor? Fine them if they misdiagnose a patient, but give them a bonus for prescribing the correct treatment. Better money manager? Force them to invest all their own money alongside their client. You get the idea.
Anyway, one example of skin not being in the game is a sports team playing out the string. For most teams at most times, sports is a very skin-in-the-game-intensive field. If you hit well, you get paid more. If you don’t, you might get sent to the minors. If your team wins, they make the playoffs. If the team doesn’t win, no postseason. The incentives are straightforward.
At the end of a long season, however, it might not feel that way. If you’re 50-100 in late September, the rewards of a good game aren’t that high, and the cost of a bad game is quite low. If you’re 15 games out in the race, being 16 games out won’t suddenly bring out the detractors. You can think of these teams as having no skin in the game; the result of one game won’t change anything for them. Read the rest of this entry »
Hunter Greene started the 2022 season off with a bang. An audible one, if you were sitting near home plate: Greene topped out at 102.6 mph in his second start of the year, averaged nearly 101 mph on his fastball, and generally looked like an entirely new type of pitcher, a starter with closer velocity.
A funny thing has happened since, though. That fastball didn’t play out quite how you’d expect. After those initial two starts, Greene lost a bit of zip on the pitch, and hitters stopped missing it. He drew 21 swings and misses in his first two major league outings; it took him another six starts to match that total. After walking just two hitters in those first two starts, he walked eight in his next two. It was time for an adjustment.
Consider that adjustment made. In his last seven starts, Greene looks like a top-flight major league starter again. He’s striking out a third of the batters he faces, walking less than 10%, and pitching to a 3.20 ERA (and 3.47 FIP) beginning with his May 10 start against Milwaukee. He’s going deeper into starts. And after the Brewers tormented him for five home runs on May 5, he’s allowed only five in these last seven starts over nearly 40 innings of work. How has the starter with the fastest fastball in the game done it? Exactly how you’d expect – by de-emphasizing his fastball and leaning on his best pitch, an upper-80s slider. Read the rest of this entry »
I thought this week couldn’t get any better. I got to write about bunts, one of my favorite things to do, and about the Giants picking up tiny edges, another personal favorite. I got to write about Yordan Alvarez and how people underrate him; now I can cross that off my yearly to-do list. But Thursday took the cake. Have you seen this nonsense?
"When was the last time you saw somebody intentionally walked on 1-2?"
I love writing about bad intentional walks. I love writing about bad managerial decisions. But I can’t really wrap my head around this one, hard as I try. Let’s try to do the math, such as it is, while keeping in mind that no amount of math is going to make this make sense.
Let’s start at the top. Trea Turner is an excellent hitter, and Bennett Sousa is a lefty. Turner boasts average platoon splits for his career. Sousa has hardly pitched in the majors, so let’s just consider him an average lefty. With a runner on second and two outs, passing up an excellent righty hitter against your lefty pitcher is standard operating procedure. Read the rest of this entry »
Even if you aren’t a Braves fan, you probably have a general idea of how their season is going so far. Max Fried? He’s still good, and still the ace for the defending world champions. Kyle Wright has taken a step forward and Charlie Morton has taken a step back. The hitters? You pretty much know them all; Dansby Swanson, Austin Riley, Ronald Acuña Jr., and Matt Olson lead the offense this year.
If you’re paying the barest bit of attention, you’d already know all of those names. They either starred in last year’s postseason, made headlines in a big offseason trade, or starred early in this season. When you get to the bullpen, though, you might be lost. Remember that stalwart relief crew from the playoffs? Will Smith has been abysmal, half a win below replacement level. Tyler Matzek has an ERA above 5, a FIP above 5, and an xFIP above 6. Luke Jackson hasn’t even pitched this year; he tore his UCL before the season and will miss the entire year.
Some of that slack has been picked up by new names. Kenley Jansen has been solid. Spencer Strider is electric, though he’s now a starter — nice problem to have. But the fourth member of last year’s bullpen quartet, A.J. Minter, is making up for the rest of his cohort’s absence. He’s off to the best start of his career, and one of the best starts of any reliever in baseball.
In some ways, Minter is like a lot of other relievers you’ve seen. His best pitch is a high-spin, high-velocity fastball. He backs it up with a breaking pitch that’s somewhere between cutter and slider, 90 mph with a touch of horizontal break. To keep righties honest, he also has a hard changeup. There are a lot of relievers who fit that general mold, and until this year, you might have easily lost Minter in the crowd.
Why bring him up, then? Surely, he’s just on a good streak, a few weeks and home runs away from just being another plus reliever instead of an unsolvable hitting riddle with an ERA around 1. Maybe that’s true. Maybe this is as good as Minter will ever be — and to be clear, it’s as good as most pitchers will ever be. But I’m interested in something else:
A.J. Minter, Zone and Walk Rates
Year
Zone%
BB%
2018
43.5%
8.5%
2019
39.6%
15.6%
2020
42.3%
10.6%
2021
44.9%
9.0%
2022
37.2%
4.4%
Yes, Minter is throwing fewer pitches in the strike zone than ever. He’s also walking batters at a career-low rate (excluding a 15-inning cameo in 2017 that I’m leaving off my charts). That makes about as much sense as clicking on a pop-up ad, but let’s see if we can disentangle what’s going on here. Read the rest of this entry »
Coming into 2022, Mike Yastrzemski was something of a cipher. Was he a late bloomer who suddenly learned how to hit? From 2019 through the 2021 All Star break, he was excellent, to the tune of a .266/.350/.514 slash line, a 128 wRC+, and 48 homers in 932 plate appearances. Or was he old news, a flash in the pan that pitchers developed a counter for? In the second half last year, he hit .212/.281/.483, struck out nearly 30% of the time, and generally looked like the career minor leaguer he’d been before 2019.
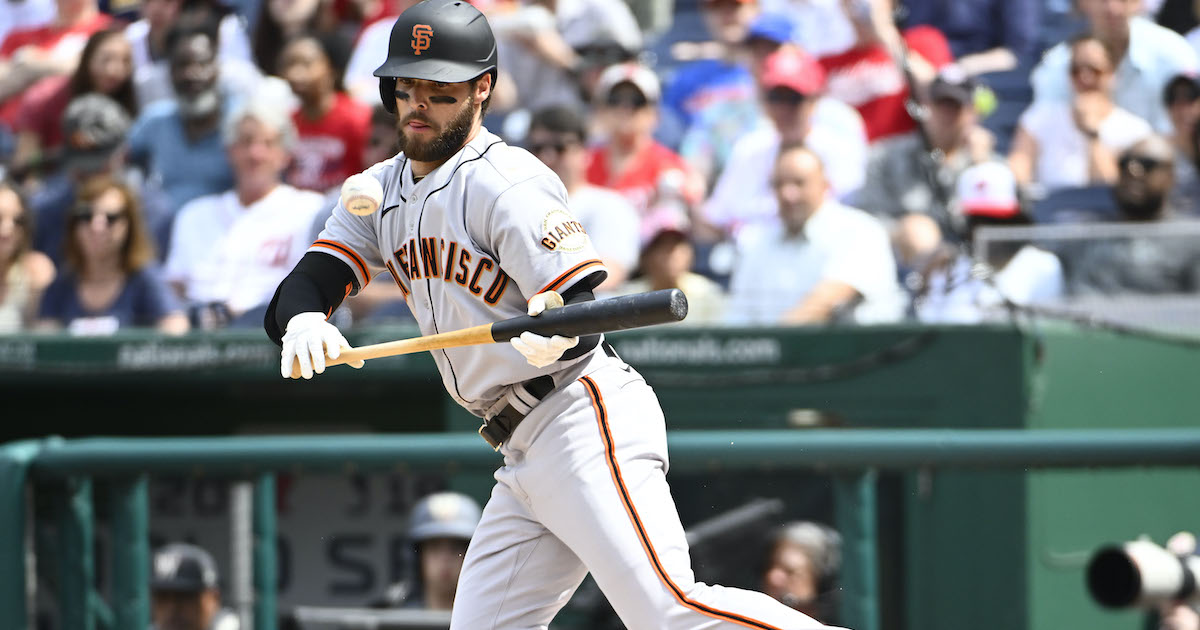
This year, he’s been back on track, and it’s largely been due to a better on-base percentage. Some of that is striking out less; he’s turned in a career-low swinging-strike rate and career low strikeout rate to go along with it. Just as importantly, though, he’s doing better on balls in play, and doing so partially by bunting — something of a San Francisco specialty this year.
In the first 300 games of his career, Yastrzemski bunted ten times. That generally tracks; he’s not particularly fast and hits for power. Why would he do anything other than clock balls over the fence — or, in spacious Oracle Park, into triples alley and off the wall? In fact, you might think that 10 bunts was 10 too many, if it weren’t for the fact that he turned six of them into hits.
This year, he’s put that plan into overdrive, with three bunt hits already after a third of a season. He’s been part of a concerted San Francisco bunting effort so far this year. The team has gone after shifts that don’t respect bunting ability by targeting them early and often, and its captain, Brandon Belt, is something of a bunting enthusiast himself. In fact, the Giants lead baseball in bunt hits, with 11, despite having exactly zero of the 75 fastest runners in baseball this year, per Statcast’s sprint speed leaderboard. Read the rest of this entry »