Author Archive

Split Graphs

I'm pleased to announce that Righty/Lefty and Home/Away split graphs are now available for the 2002-2005 seasons. I've pulled two graphs that I thought illustrated their usefulness. The first graph here is Dontrelle Willis' strikeouts per 9 innings (K/9). Just look at how freakishly dominant he is against left-handed batters!

SK9

Then I pulled up Jeromy Burnitz's isolated power (ISO) home/away splits to take a look at how much better he was playing at Coors Field. Notice how his cumulative ISO with the Cubs was quite similar to his 2004 road stats.

SISO

These were two of the more obvious examples, but I hope you'll find these graphs are much easier to take a quick glance at than traditional split data. The other advantage of these graphs is you can see multiple season split data side-by-side. Enjoy and if you have any suggestions or notice any bugs you can discuss it in the forum or send a feedback form!


Daily Graphing – Corey Patterson

Apparently the Orioles were close to acquiring Corey Patterson from the Cubs for a minor leaguer but now it appears that several teams are in the running. In 2004 Corey Patterson returned from a torn ACL to hit an impressive 24 home runs while stealing 32 bases. Last year he hardly lived up to his 2004 numbers as he only hit 13 home runs with 15 stolen bases. He was even sent down to AAA in mid-July to work on shortening his swing to help him make better (any) contact. He returned to the majors a month later and showed no improvement, finishing off the season with a .175 batting average. Talk about ending the season on a low note. Let's see if there's any hope of a rebound in 2006.

BBP

It really did look like he was learning to take a walk in the first half of the 2004 season but he reverted to his old ways in the second half and was even worse in 2005. Unfortunately, he strikes out a good deal too making his walk to strikeout ratio (BB/K) one of the worst in baseball.

BBK

Furthermore his isolated power (ISO) was down significantly last year. His home runs per fly ball was down from 13.5% to 11.6% which isn't that much of a decrease, but his doubles and triples took much larger hits. Most of this was the result of poor line drive percentage of only 17%.

ISO

It seems highly unlikely that Corey Patterson will magically develop plate discipline next season and become a reliable batter. Apparently the Cubs had been trying to shorten his swing for quite some time and he was unwilling to make the necessary changes. Typically batters that exhibit such poor plate discipline do not show significant improvement later in their career, but it's probably too early to write him off at only 26 years of age. It's really too bad because if he were to just become a little more patient he'd have 30 HR/30 SB potential.


Daily Graphing – Ryan Franklin

The Phillies have signed Ryan Franklin to a one year, 2.6 million dollar deal. Ryan Franklin has been around a little while now (5 seasons) and he's been less than good. He also holds the dubious distinction of being one of the players suspended for steroid use. Last season he was at his worst, going 8-15 with an ERA over 5. Let's see if there's any hope he'll do better next year.

K9

For starters his strikeouts per 9 innings (K/9) are sitting at a pretty bad 4.4. He's only once had his K/9 above 5 and that was in his rookie season when he pitched just under 80 innings. He's gone through various peaks and valleys with his K/9 (never really topping 6 at his best) over the past four years, but I'd say there's nothing here to suggest that he's capable of doing a whole lot better. The only pitchers that can get away with a K/9 this low are the ones that issue very few walks such as Carlos Silva, Jon Garland, and Paul Byrd.

BB9

Ryan Franklin does not fall into this category. In fact his walks per 9 innings (BB/9) have been heading in the wrong direction the past couple of years. Even if he does manage to reverse the trend, it seems unlikely it will decrease enough for him to be an effective pitcher.

LDGBFB

Had enough bad news yet? Here's a little more: He's a fly ball pitcher. Seattle's Safeco Field is one of the better parks at limiting home runs. Only 9% of the fly balls are home runs compared to Citizen's Bank Park's 13%. He's never been great at keeping the ball in the park anyway and he won't be any better playing half his games in Philly.

HR9

I have some additional concerns about his batting average on balls in play (BABIP), but he's historically been below the league average so I'll hold my tongue. Let me just say it would be really scary if he were to ever have an “unlucky” season. If you haven't already guessed, I think you can expect more of the same from Ryan Franklin next season.


Daily Graphing – C.C. Sabathia

It seems like over the past couple season the name C.C. Sabathia and burnout candidate have gone hand in hand and with good reason. Since entering the league in 2001 at only 20 years of age he's thrown nearly 16,000 pitches which definitely gives him one of the heavier workloads in the past 5 years. He's handled it quite well and has actually never been on the disabled list having only suffered a few minor elbow and shoulder injuries. Last year he had one of his best seasons to date going 15-10 with an ERA just over 4. That may not sound that great, but after July he was 9-1 with a 2.24 ERA. How likely is it that C.C. Sabathia will pick up where he left off in 2006?

K9

For starters the decrease in his ERA was fueled by an excellent strikeout per 9 innings (K/9) of 8.7 during the final two months of the season. He's shown late season surges like this before in 2003 and to some extent 2004, but never quite like this one. If we break down his K/9 a little further by right-handed and left-handed batters it becomes quite obvious what happened.

SK9

It looks like he figured out how to strikeout left-handed batters while there wasn't so much improvement against right-handers. The increase is rather severe, but the sample size is also a little small as only 16% of the batters he faced were left-handed. However the consistency of the increase throughout the year makes me want to say that it wasn't entirely a fluke. The other area he showed improvement in was his walks per 9 innings (BB/9) which he managed to get down to a career low 2.8.

BB9

Everything seems to be headed in the right direction for C.C. Sabathia. His strikeouts are up, his walks are down, and it looks like he really did show some good second half growth in 2005. It's also worth mentioning he took his groundball tendencies to new levels (mostly against left-handed batters, 3.0 GB:FB). While I certainly wouldn't expect him to continue pitching at the level he did in August and September, there's no reason he can't improve upon his 2005 season. He's already a solid pitcher and has showed that at times he's definitely capable of being an excellent pitcher. He'll only be 26 years old next season and maybe a little consistency is on its way.


Daily Graphing – Wily Mo Pena

With the departure of Sean Casey from Cincinatti, it looks like Adam Dunn will be moved to first base leaving a full time opening in the outfield for Wily Mo Pena. Wily Mo Pena has been unable to work his way through the minor league system due to contractual issues and was thrown into the Major Leagues in 2002 at only 20 years of age. Since then he has yet to play a full season, but has shown great power potential by hitting 26 home runs in just 364 at bats in 2004, and 19 home runs in 311 at bats last year. Now that he's all but guaranteed a full time outfield spot, is a 40 home run season in the cards for 2006?

ISO

If you look at his isolated power (ISO), he was nearly off the charts to start the 2005 season, but came back to earth after a number of nagging injuries (quadriceps, knee, wrist). While his ISO is definitely within the top 20% of all batters in 2005, his HR/FB is quite spectacular at just over 30%, the 3rd highest in baseball. Unfortunately, there's another stat that Willy Mo Pena ranks very highly in; strikeouts.

KP

I guess “very highly” is a bit of a understatement, he's number 1 (or dead last, depending on how you look at it) in strikeout percentage (K%). He actually got worse when just a year ago he struck out in 32% of his at bats as opposed to his 37% in 2005. His walk percentage (BB%) isn't much to write home about either, as he only walks in just over 6% of his plate appearances. He did however show improvement in his walks towards the end of the season which seems to have carried over into the Dominican Winter League where he had 13 walks and 19 strikeouts in 80 at bats.

BBP

Because of his tremendous power, Willy Mo Pena might be able to come close to 40 home runs next season despite his awful plate discipline, yet I think somewhere in the neighborhood of 30 home runs is probably a bit more realistic. I don't think his sub-par batting average of .254 is likely to improve (and might even be worse) unless he shows some major improvement in his strikeouts. For a 24 year old with little minor league experience he's done pretty well for himself in the majors so far. His numbers aren't so far off from NL Rookie of the Year Ryan Howard, who's about 2 years older.


Daily Graphing – John Patterson

After suffering various setbacks through out his career, John Patterson finally pitched his first full season in 2005 for the Washington Nationals. I guess you could say it was worth the wait, as he led the Nationals pitching staff with a 3.13 ERA in just under 200 innings while striking out a team high 185 batters. In July and August he was one of the top 5 pitchers in baseball by going 5-2 with a 1.87 ERA and 82 strikeouts in 81-plus innings of work. Now that he has one full year under his belt, what should we expect from John Patterson in 2006?

KBB

For starters he has a good strikeout to walk ratio (K/BB) of 2.85 and very good strikeouts per 9 innings (K/9) of 8.4 for a starting pitcher. He relies mostly on his fastball which he usually throws in the low 90's but tops out at 97 mph. Occasionally he'll mix in his slider and curveball, but almost never when behind in the count. He'll really start to throw his curveball when he gets two strikes on a batter and it appears to have become his most reliable strikeout pitch. His slider is also a quite effective strikeout pitch, but he doesn't throw it nearly as often with two strikes.

PTCT

The one thing you have to worry about with him is that he's an extreme fly ball pitcher. Last year he allowed only 7.5% of his fly balls to become home runs (FB/HR). Typically pitchers tend to regress towards the league average of around 11%, but playing in R.F.K. Stadium will certainly help him keep that number lower than average. R.F.K. Stadium has a HR/FB of only 7%, the lowest in baseball.

HR

John Patterson will only be 28 years old next season and has just entered what should be his prime years. Don't read too much into his 9-7 record as he got very little run support with the Nationals. His strikeouts are just where they need to be and there's no reason he still can't continue to limit his walks. As long as he's pitching in R.F.K. Stadium, or other pitcher friendly parks I don't think there's as much cause for alarm as there usually would be in the home run department. His injury history leaves some concern, but if healthy, there's no reason why he can't do just as well as last year if not better. And if the Nationals can manage to pony up some runs for him, more wins will certainly be on the way.


Research – What if everything was equal?

The article I wrote about Juan Padilla being the luckiest pitcher in baseball got me thinking that maybe combining the three statistics of BABIP, HR/FB, and LOB% was not the best way to display a pitcher's overall “luck”. So instead of championing “Luck Factor” as a useful stat, I'm going to make a “luckless” ERA or luck independent ERA (iERA) which will have better practical applications. The formula is actually pretty simple:

iERA = ( ((.3627 * IP) – (.1287 * K) + (.1408 * FB) + (.3 * BB)) * 8.28) / IP

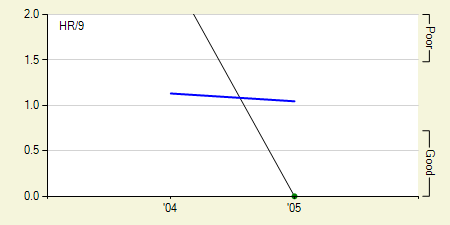
Basically this formula was the result of a bunch of relatively simple algebra on the three “luck” statistics HR/FB, BABIP and LOB%. Instead of solving each formula for each player, I plugged in the major league average for each, and proceeded to find out how many home runs, hits, unearned runs, and finally earned runs a player would have if everything was equal. This formula should normalize ERA for park, league, and in some sense, competition. In other words, it gives a pitcher's ERA as if all pitchers pitched under the same conditions.

ONE

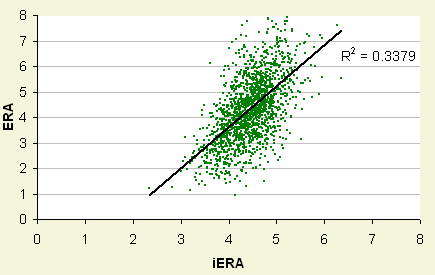
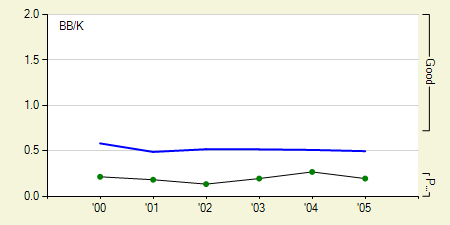
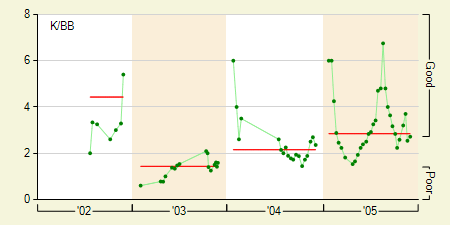
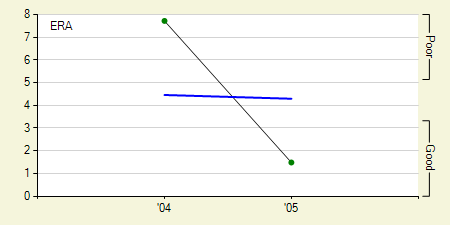
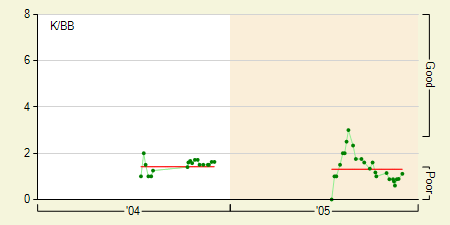
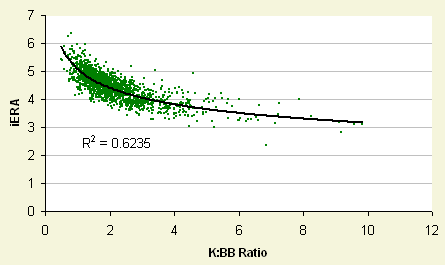
Let's take a look at how iERA compares to regular ERA. Naturally there is some correlation here, but the correlation isn't that great. I just did this to make sure they were actually measuring two different things, and they do. What iERA does have a high correlation with is a pitchers strikeout to walk ratio. Not much of surprise here as strikeouts and walks (and fly balls) are what sets pitchers apart in iERA.

TWO

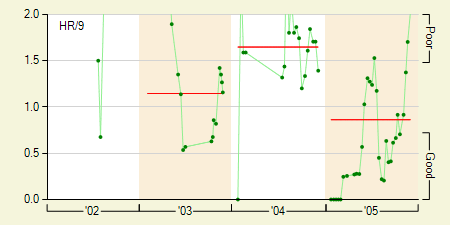
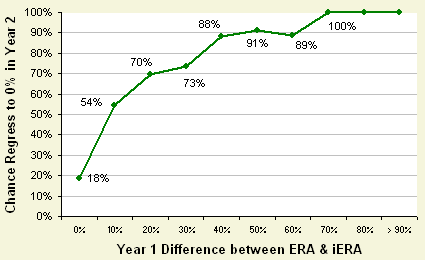
So you're probably asking, why should I care about a pitcher's iERA? It's actually quite good at telling you how lucky a pitcher was in any particular year. As you can see, once a player's ERA and iERA start to differ by more than 20%, there's about a 75% chance that his ERA and iERA will be closer the following year. Once you start to see a difference in ERA and iERA over 70%, it's pretty much a given that his ERA and iERA will be closer the next season.

THREE

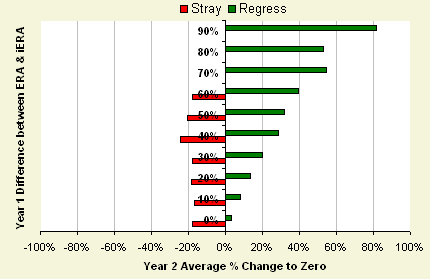
Furthermore, the amount that a player's ERA will revert to iERA is somewhat a function of how far it deviated in the first place. Player's don't tend to stray from a 0% difference in ERA and iERA much further than 20% on average.

FOUR

So just for kicks, let's take a look at some of the bigger discrepancies in iERA and ERA the past four years and see what they've done the following year. Here are 5 starters and 5 relievers that had a much lower ERA than they did iERA in 2004.

		2004			2005		
Name		ERA	iERA	% Dif	ERA	iERA	% Dif
Joe Nathan	1.62	3.80	-81%	2.70	3.65	-30%
Mike Gonzalez	1.25	2.83	-78%	2.70	4.15	-42%
Steve Kline	1.79	4.00	-77%	4.28	4.67	-9%
Luke Hudson	2.42	5.07	-71%	6.38	5.25	19%
Akinori Otsuka	1.75	3.62	-70%	3.59	4.19	-15%

		2004			2005		
Name		ERA	iERA	% Dif	ERA	iERA	% Dif
Jake Peavy	2.27	3.83	-51%	2.88	3.56	-21%
Al Leiter	3.21	5.07	-45%	6.13	5.41	12%
Bruce Chen	3.02	4.66	-43%	3.83	4.51	-16%
Carlos Zambrano	2.75	4.02	-38%	3.26	3.91	-18%
Tomo Ohka	3.40	4.81	-34%	4.04	4.63	-14%

Each of them did see an increase in their ERA and they all saw a drastic reduction in the percent difference between their ERA and iERA. Now let's take a look at the players that had a much higher ERA than iERA.

		2004			2005		
Name		ERA	iERA	% Dif	ERA	iERA	% Dif
Lance Cormier	8.14	5.12	46%	5.11	4.46	14%
Sergio Mitre	6.62	4.22	44%	5.37	4.17	25%
Mike Wood	5.94	4.37	30%	4.46	4.78	-7%
Brian Fuentes	5.64	4.32	26%	2.91	3.84	-28%
Neal Cotts	5.65	4.39	25%	1.94	4.25	-75%

		2004			2005		
Name		ERA	iERA	% Dif	ERA	iERA	% Dif
Casey Fossum	6.65	4.61	36%	4.92	4.50	9%
Derek Lowe	5.42	4.19	26%	3.61	3.69	-2%
Joaquin Benoit	5.68	4.42	25%	3.72	4.74	-24%
Brett Myers	5.52	4.48	21%	3.72	3.75	-1%
Scott Kazmir	5.67	4.62	20%	3.77	4.60	-20%

All of these pitchers saw a decrease in ERA, some more drastic than others. Neal Cotts had a very high ERA and iERA difference in 2005, which will certainly revert in 2006. Brian Fuentes also showed a very big difference in ERA, but notice that it was also reflected in his 2005 iERA. Here's the last list of pitchers which showed a very large difference in ERA and iERA for 2005.

Name		ERA	iERA	Dif
Juan Padilla	1.49	4.74	-105%
Mariano Rivera	1.38	3.38	-84%
Chad Cordero	1.82	4.36	-82%
Huston Street	1.72	4.02	-80%
Cliff Politte	2.00	4.52	-77%

Name		ERA	iERA	Dif
Tim Redding	10.57	5.51	63%
Alan Embree	7.62	4.28	56%
Greg Aquino	7.76	4.39	56%
Ryan Wagner	6.11	3.60	52%
Paul Wilson	7.77	4.91	45%

I'd like to emphasize that just because there is a large discrepancy between a pitcher's ERA and iERA doesn't mean that pitcher still can't be very good or very bad the next season. It just means that there's a high probability that pitcher will have an ERA much closer to his iERA the following season. If you subscribe to the theories of BABIP, HR/FB, and LOB% (and even if you don't), I think you'll find iERA a useful tool as it essentially combines the three of them into one simple stat that you can compare with any player's actual ERA to get an idea of how “lucky” a player was in a single season.

Update: Just a quick addendum, I've been told that iERA is essentially a pre-existing stat called xFIP. I was aware of just FIP, but I wasn't so aware of xFIP. I think xFIP might be a little better (even though the two are VERY close). If you're interested in xFIP, I'll point you over to the article: I'm Batty for Baseball Stats over at the Hardball Times.


Daily Graphing – Juan Padilla

A few days ago, Dave Studeman of the Hardball Times wrote about the statistic LOB% (percent of baserunners left on base). While he stated LOB% isn't necessarily a “luck” statistic, I'm going to use it today as if it were one with some discretion, of course. I was thinking that for pitchers there are currently three statistics that are considered to be in some sense a measure of luck. There is batting average on balls in play (BABIP), percentage of fly balls that are home runs (HR/FB), and the already mentioned LOB%.

I wanted to find the “luckiest” pitcher in 2005, so I decided to combine the three “luck” statistics in a crude attempt to create a “Luck Factor” for pitchers. I used the formula (BABIP + (3 * (HR/FB)) + (1-LOB%)). While I'm sure there are a few problems with this formula that I quickly threw together, it will definitely point you in the direction of some of the biggest luck offenders. I couldn't help but laugh when, at the very top of the list, I saw Juan Padilla. Oh great, another Mets reliever! So without further adieu, let's see what made Juan Padilla so “lucky” in 2005.

ERA

Starting off with ERA, his first trip around the majors was pretty awful. In 2004 he had an insanely high ERA of 7.71, which plummeted to an incredibly low ERA of 1.49 in 2005. With such a steep decline, I'd expect some sort of drastic change in his strikeouts or walks. This was not the case.

KBB

In 2005 his strikeout to walk ratio (K/BB) was slightly worse than it was in 2004. His strikeouts per 9 innings (K/9) was a poor 4.21 and his walks per 9 innings (BB/9) was a pretty average 3.22 bringing his K/BB to a poor 1.31. His minor league numbers definitely deviated from his major league numbers where he managed a pretty healthy K/9 of 8.22 the past two seasons in AAA.

HR9

Moving on to the part which made him the “luckiest” pitcher in all of baseball, he gave up zero home runs last season. I don't care who you are, things like that generally don't happen more than once. To go with his zero home runs, he had an extremely low BABIP of .219 and a pretty high LOB% of 81%. Combine all three of these and he had the best single season “Luck Factor” in the past four years! Pitchers with a K/9 under 7 that have displayed similar luck have seen, on average, a 2 point rise in ERA the following year. Here are those same pitchers that had an ERA under 2 and what their ERA did the following season.

Name		Year1	Year2	Dif
Buddy Groom 	1.60	5.36	3.76
Paul Quantrill 	1.75	4.72	2.97
S. Hasegawa 	1.48	5.16	3.68
Steve Kline 	1.79	4.28	2.49

While I'm not saying Juan Padilla won't improve his strikeouts or walks (mainly strikeouts) in the major leagues and become a quality pitcher at some point, I think there is little to no chance he'll do nearly as well as he did last year. If there's no improvement in his strikeout rate, I'm pretty sure you'll see a pitcher next season that none will be too thrilled with.


Daily Graphing – Jacque Jones

With all talk of the Yankees signing Johnny Damon, it seems like the Cubs signing Jacque Jones to a three year, $16 million contract got lost in the news. Jones is currently a career .280 hitter, and even managed to bat .300 in 2002-2003, but since then has batted just around .250. Despite the recent drop in batting average, he's continued to show good power, hitting 24 and 23 home runs the past two seasons. Let's see what's in store for Jones next season in his new home, Wrigley Field.

BBK

If you take a look at his walk to strikeout ratio (BB/K), you'll see it looks like he reached a career high of .43 in 2005. While this technically true, it's a bit misleading as 12 of his 51 walks were intentional. In reality, there's no upward trend here, and he has not improved his patience at the plate.

BABIP

The main reason for his decrease in batting average has been a drop in his batting average on balls in play (BABIP) the past two seasons. Much of this may be fueled by a correlating decrease in the percentage of line drives he hits. In 2002-2003 he hit around 20% of his balls for line drives (near the league average), but in the past two seasons he's hit less than 15% of his balls for line drives. That's the fifth lowest line drive percentage in all of baseball over the past two seasons.

ISO

Despite the low percentage of line drives, his isolated power (ISO) has remained pretty decent. What's most interesting is that over the past four seasons he's hit between 18% and 23% of his fly balls for home runs (HR/FB). Last season, his HR/FB was 21.7% which puts him in the same category (in HR/FB only) as players such as David Ortiz, Albert Pujols, and Mark Teixeira; players typically thought of as power hitters. One of the main statistical differences between him and these players is that he's a ground ball hitter. An extremely high 58% of the balls he hits are ground balls, the 3rd highest in baseball.

Moving from Metrodome to Wrigley Field probably won't have too much of an impact on Jones, but he should be in a more productive lineup which certainly won't hurt. I think his batting average will recover slightly in 2005, yet considering his walk to strikeout ratio and his line drive percentage, it seems highly unlikely he'll return to his .300 levels. He does appear to have some untapped power, but as long as he continues to hit a high percentage of ground balls, I'd expect him to continue hitting around 20 home runs a season.


Daily Graphing – Chris Young

In what was a surprise move to me, the Rangers sent Chris Young, Adrian Gonzalez, and Terrmel Sledge to the Padres for Adam Eaton, Akinori Otsuka, and a minor leaguer. In Chris Young's first full season in the majors he posted a 12-7 record with a 4.26 ERA and a good strikeout to walk ratio (K/BB) of 3.06. Not too shabby considering he played in one of most hitter friendly parks in baseball. Now that he'll be moving to the pitcher's haven, PETCO Park, what should we expect from Chris Young in his second full year in the majors?

ERA

Looking at his ERA, he was really on quite the roller coaster ride. Early in the year he was looking like an AL Rookie of the Year candidate as he started off going 5-1 with a 2.93 ERA. In June and July things got a little hairy as his ERA rose to an awful 6.19. Then he had a strong final two months of the season, going 4-1 with a 3.62 ERA. Most of the increase in ERA towards the middle of the season can be explained by a brief period of time when he experienced a “tired arm”. This “tired arm” period becomes evident by looking at the major spike in his home runs per 9 innings (HR/9).

HR9

In just over a one month period he allowed 12 of his 19 home runs for the season, bringing his HR/9 to a horrible 2.65. Despite this one month period, his home runs per fly ball (HR/FB) remained extremely low for the year as only 7.7% of his fly balls became home runs. If you take away that one month home run derby, then only 4% of his fly balls became home runs. That's pretty amazing considering on average in Ameriquest Field, righthanded pitchers's fly balls became home runs nearly 14% of the time. He's lucky he kept his HR/9 below the league average since he has the 3rd highest fly ball percentage in baseball.

LDGBFB

Despite Chirs Young's good strikeout to walk ratio, if he were to continue playing at Ameriquest Field, I'd say he'd have a similar 2005 season as it would be hard for him to continue to limit his home runs considering his fly ball tendencies. This however is not the case as he'll now be playing in a park where an extreme fly ball pitcher should thrive. One thing to note is he won't get the same kind of run support playing for the Padres as he did for the Rangers. In 2005 he had the 3rd most run support per inning of any pitcher in baseball. If he can remain healthy, I'd expect Chris Young to definitely improve upon his 2005 ERA, but he may find wins harder to come by.