Author Archive

What Should We Make of Jesse Winker?

Here is an understatement: Jesse Winker had a pretty solid weekend. On Friday, he collected four hits, including three home runs, and a walk. On Saturday, he only went 1-for-4, but added another homer. And on Sunday, he homered again, bringing his weekend total to five and his season total to 13. His wRC+, which entered the weekend at a cool 166, jumped 26 points to 192; by this metric, he’s now the third-best hitter in baseball. His .463 wOBA, meanwhile, ranks first.

To say that Winker has broken out this season would be inaccurate. He has always been a very good hitter, particularly against right-handed pitching. Plus, his numbers have seen a significant uptick over a fairly large sample. In short, it’s not just 2021: Over his last 162 games, dating back to May 22, 2019, he is hitting .306/.401/.563 with 31 homers. In that span, he has been the seventh-best hitter in the majors by wRC+, at 154.

He really put everything together during his 2020 season, with his once-extreme platoon splits (we’ll get to those in a moment) dissipating in the shortened campaign. His 146 wRC+ was a “seasonal” career-high, and his .289 ISO was eye-popping for a hitter who had posted sub-.200 marks for his career to that point. Winker, who had rarely been considered a power hitter — he graded as having 30 game power in his last prospect scouting report back in 2018 — posted the same 2020 ISO as Teoscar Hernández.

Winker’s 2020 season did turn heads, as did his hot start to 2021. But we’re admittedly still dealing with small-ish samples for this new slugging version of him. His ISO, which was only .181 going into 2020, is .320 so far this season. And we’re starting to see the projection systems more fully buy in. Here are the largest rest-of-season ZiPS ISO increases, compared to the pre-season projections:

Largest ZiPS ISO Increases
Name PROJ-ZiPS ISO ROS-ZiPS ISO Difference
Jesse Winker .180 .213 .033
Shohei Ohtani .218 .249 .031
Mike Zunino .198 .229 .031
Buster Posey .101 .131 .030
Yadier Molina .104 .132 .028
Brandon Crawford .133 .160 .027
Adolis García .190 .216 .026
Byron Buxton .240 .265 .025
Akil Baddoo .130 .153 .023
Mitch Haniger .211 .233 .022
Through games played on Saturday, May 22.

Read the rest of this entry »


Unpacking the Impact of Foul Balls on Strikeouts

In eight of the 12 different count-states, fouls and whiffs come with the same penalty: a strike. In a 1–1 count, for example, it really doesn’t matter whether you look silly swinging and missing at a curveball or just miss a home run by being a few inches wide of the foul pole. In either case, hitters have to come back for another swing, with the count now 1–2.

We all know this. Those are just the rules of the game. But it creates a very interesting hierarchy for hitters. When a hitter swings, only one of three things can happen: He can put the ball in play, foul it off, or whiff. And, as mentioned, for two-thirds of those outcomes — the foul and the whiff — no distinction is even made in eight of the 12 count-states. No wonder that the league-average hitter, by run value, is penalized when he swings.

But fouls have a unique property that makes them wholly different than whiffs: the ability to prolong at-bats. In the same way that you can’t lose on a serve in ping pong, you can’t strike out on a foul ball (bunts excluded). While they carry the same penalty as whiffs in all non–two-strike counts, foul balls manage to be the only safety net for hitters when their backs are against the wall, and to me, it makes for a pretty interesting dichotomy when you break it down that way.

Because foul balls provide this special safety net for hitters, it would make sense intuitively that hitters who foul off more pitches probably strike out less. If a hitter fouls off a lot of pitches, especially relative to the number of whiffs he creates, he is almost certainly going to avoid a K and eventually should get a pitch to put in play. Indeed, there is a pretty strong correlation between foul-to-whiff ratio and strikeout rate:

Read the rest of this entry »


Yasmani Grandal Has One of the Wonkiest Slash Lines You’ll Ever See

I love wonky early-season slash lines, the kinds of combinations that make you scratch your head and consider what exactly had to happen to get to this point. It’s pretty easy to put Yasmani Grandal’s start in that category: Through 22 games and 91 plate appearances, Grandal is hitting .113/.378/.242, slugging two homers and posting a… 102 wRC+?!?

Yes, you read that correctly. Through games on Sunday, Grandal has just seven hits and has the worst batting average among players with at least 80 trips to the plate. And yet he’s also managed to be an above-average hitter by wRC+. There’s truly some wild stuff going on here.

Of course, none of this is sustainable. Grandal has faced some pretty horrible BABIP luck, and as Dan Szymborski noted in his article yesterday, he is the fourth-largest underachiever in actual BABIP (.119) versus ZiPS-developed zBABIP (.261). Plug that figure into his balls-in-play total and you’d find that Grandal should have more than 13 hits this season, giving him a more-respectable-though-still-not-great .210 batting average.

But what is most interesting about Grandal’s start isn’t that he’s faced such poor BABIP luck; it’s that he has still managed to be a productive hitter in spite of it. Grandal has walked a whopping 27 times to start the season, a near-30% walk rate and a figure that leads baseball by a rather healthy margin. As of this writing, Max Muncy is the only other player who has amassed more than 50 plate appearances with a walk rate above 20%, and he’s still more than six points behind Grandal. Since 1901, Grandal’s 27 walks in his 22 games are tied for the 16th-most walks in any player’s first 22 to begin a season, but he’s one of just five players to do that while also batting under .150. Read the rest of this entry »


Rafael Devers Still Has Another Gear

So far, the Red Sox have been one of this season’s biggest surprises. Since Opening Day, the Sox have already increased their playoff odds by 23.6 percentage points up to 61.5%, the second-largest percentage point increase in baseball (Athletics, +25.7).

To reach the pinnacle of the AL East this quickly, Boston has been successful on both sides of the ball, but it’s the team’s offense that has found itself alone at the top of most major league leaderboards. Through games on Saturday, the Red Sox are slashing .269/.334/.445, with the batting average and slugging percentage each ranking tops among the 30 teams. Their .338 wOBA is seven points above the next-best team, the Dodgers, and their park-adjusted 115 wRC+ is three points above Los Angeles as well.

The entire lineup is hitting, but it’s their core five of J.D. Martinez (195 wRC+), Xander Bogaerts (176 wRC+), Rafael Devers (150 wRC+), Alex Verdugo (135 wRC+), and Christian Vázquez (100 wRC+) that have more or less led the way. And though this could easily be an article about any of those five players’ starts, I want to highlight Devers, whose .281/.371/.544 slash line through games on Saturday actually represents one of the biggest under-performances in baseball relative to his batted ball quality. Read the rest of this entry »


Where Did the Homers Go?

On Monday, I examined the new baseball’s impact on April home run totals. In sum, home runs were down in April 2021 compared to April 2019, with the home run per batted ball rate dropping by roughly 0.45 percentage points, a figure that would result in about an 8% decrease in home runs from ’19 to ’21, under the assumption that hitters receive roughly equal plate appearances in each season. (Due to seven-inning doubleheaders and the new extra inning rules, though, that won’t happen, but it’s still good to compare apples-to-apples to estimate the impact.)

After sharing the article on Twitter, I received an interesting question that I felt merited further discussion: How many of those now-non-homers turn into hits versus outs? That is a fascinating question because it potentially gets to the heart of why MLB dejuiced the baseballs in the first place. Baseball didn’t want to eliminate offense, per se; they just wanted to alter how it is generated, with more balls put into play rather than what they perceived as a recent over-reliance on the long ball. In short, if all of those newly-created non-homers are now other types of hits, then dejuicing the baseball might’ve actually had the impact MLB wanted. If they are now outs, then it’s just going to make life that much harder for batters.

Given the majors’ historically-low batting average this season — once again, I’ll point you to Brendan Gawlowski’s excellent piece on the matter — you can likely guess what happened: Outs are up. Read the rest of this entry »


Home Runs Were Down in April, but by How Much?

Seemingly in the blink of an eye, a month of baseball is behind us. With nearly 30,000 plate appearances taken and more than 18,000 batted balls put into play, a month of data is plenty to begin examining league-wide trends and to make some predictions for the rest of 2021.

One big question going into this season — and a topic already examined here by both Ben Clemens and Justin Choi — was what the impact of the new baseball would be on the overall offensive environment. As both Ben and Justin found and detailed, the new baseball is bouncier, yielding higher exit velocities than in years past, and also possesses more drag, as it is not traveling as far. I want to focus on that second point. If the ball isn’t traveling as far, we should be seeing fewer home runs hit in 2021 — and we are. But can we pinpoint just how many home runs will be hit this season? That takes a bit more guesswork, but before getting into that, let’s first see how April 2021 stacks up to prior seasons, as well as identify where exactly we lost those home runs.

Home Runs in April
Year HR BBE HR/BBE%
2015 592 17559 3.37%
2016 740 18498 4.00%
2017 863 19301 4.47%
2018 912 21706 4.20%
2019 1144 22111 5.17%
2021 873 18509 4.72%
Includes data from all games played on or before April 30 in each year.

Read the rest of this entry »


Matt Chapman and the Potential Demise of the Up-the-Middle Hit

A’s third baseman Matt Chapman has had a pretty brutal start to his season. In 96 plate appearances through games played on April 27, he’s slashing just .152/.281/.329 and has struck out more than 34% of the time. His wRC+, meanwhile, is 45 points below his career-average into this year.

Chapman also finds himself atop a leaderboard that would, upon first glance, seemingly lead to success at the plate. Year-over-year, no hitter has increased his Center% — or percentage of batted balls hit up the middle — more than he has, with a rate that has gone up by more than 1.75 times.

Largest Increases in Center%
Player 2020 Center% 2021 Center% Increase
Matt Chapman 29.2% 52.1% 22.9%
Randal Grichuk 24.9% 45.8% 20.9%
Tommy La Stella 32.1% 51.9% 19.8%
Gio Urshela 30.0% 47.4% 17.4%
J.P. Crawford 32.3% 47.5% 15.2%
Aaron Hicks 29.0% 44.0% 15.0%
AJ Pollock 28.1% 42.9% 14.8%
Adam Eaton 35.9% 50.0% 14.1%
Austin Slater 35.9% 50.0% 14.1%
Starling Marte 31.4% 44.4% 13.0%
Among hitters with at least 100 PA in 2020 and at least 50 PA in 2021.

Strikeouts aside, you would think that Chapman should at least be getting some decent batted ball results. More than 52% of his batted balls so far this year have gone up the middle, leading all hitters. Amazingly, though, he has hit the most groundballs up the middle this season without a hit, at 12. That’s right: On twelve different occasions this season when Chapman has hit a ball back towards the middle, it’s gone for an out.

Read the rest of this entry »


Are Pitchers Being More Aggressive With the New Ball?

On Friday night, Jacob deGrom pitched brilliantly against the Nationals in what was the best start of his career: nine innings, just two hits allowed, no runs, no walks, and 15 strikeouts. By traditional game score, his outing was the finest pitching performance of the young 2021 season, at a cool 98.

There’s a lot to marvel at with deGrom. He has a 0.31 ERA and 0.85 FIP through four starts and is leading all of baseball in WAR. What’s interesting to me, though, is how he attacks the strike zone. His 4.5-point increase in overall Zone% might look modest on the surface, but that’s not always the best measure of aggression: Pitchers frequently want hitters to go fishing. What’s more interesting is that his four-seam fastball zone rate has jumped by 10 points year-over-year, good for the second-largest increase in baseball. deGrom dares hitters to hit his 100 mph fastball, and, well, they just can’t.

Largest Four-Seam Fastball Zone% Increases
Name 2020 2021 Difference
Rich Hill 56.0% 68.0% 12.0%
Jacob deGrom 52.0% 62.0% 10.0%
Matthew Boyd 50.7% 59.9% 9.2%
Tyler Mahle 48.9% 57.5% 8.6%
Walker Buehler 58.2% 66.8% 8.6%
Aaron Nola 49.3% 57.8% 8.5%
Matt Barnes 50.4% 58.7% 8.3%
Lance Lynn 56.7% 64.6% 7.9%
Robbie Ray 49.3% 57.1% 7.8%
Austin Gomber 53.3% 60.3% 7.0%
Min. 200 four-seam fastballs in 2020 and 100 four-seam fastballs in 2021.

This is not solely an investigation into deGrom; he is just emblematic of what might be a league-wide trend. Through games played on April 24, 55% of four-seam fastballs were in the strike zone — a figure that, if it holds, would mark the highest four-seam Zone% of the pitch tracking era. Though more four-seam fastballs have been thrown in the strike zone in recent years, 2021 represents a statistically significant tick up, with a p-value of practically zero.

Read the rest of this entry »


The Rockies’ Offense Is Off to a Horrid Start

To no one’s surprise, the Rockies are bad: At 5–12, they own the worst record in baseball. Take a look back at the preseason standings and you’ll see that was the expectation all along: Colorado was projected to finish at roughly 65–97, sharing the title of worst team in the majors with Baltimore.

Those paths have diverged, slightly, about 10% of the way through the season. The Orioles, at 8–9, have been playing decently, relative to their bottom-dwelling expectations. You shouldn’t expect that to last, as their .421 projected full-season winning percentage is still the third-worst in the majors. But at least it’s been somewhat of a fun start for Baltimore.

Colorado, meanwhile, has sunk right to the bottom, almost like something you’d see in an elementary school science class when a teacher is attempting to explain density. “Do we think this will float?” they might ask the classroom. The Rockies are the baseball version of a resounding “no;” they did not manage to float, not even for just a few games.

Read the rest of this entry »


Aaron Civale Has Overhauled Everything

If you take a quick glance at Aaron Civale’s 2021 numbers, nothing looks out of the ordinary. Yes, the 2.18 ERA signals a stellar start, but with strikeout and walk rates relatively in line with his career numbers, you wouldn’t suspect that Civale has undergone a host of changes to both his repertoire and his delivery. But look beyond the numbers to the guy on the field, and it’s clear that he’s undergone a rather obvious change in his process and approach, one that merits further analysis.

Coming into the season, Civale was mainly a sinkerballer, though that requires a rather liberal definition of the word “mainly.” Civale threw his sinker, cutter, and curveball to batters of both handedness, and supplemented those main offerings with a side of slider to righties and a side of changeups to lefties. That mix of speeds and movements put him in an interesting class of pitcher:

Five Frequent Offerings
Pitcher FIP WAR
Yu Darvish 2.23 3.0
Hyun-Jin Ryu 3.01 1.8
Max Scherzer 3.46 1.8
Aaron Civale 4.03 1.2
Kyle Freeland 4.65 1.0
Mike Fiers 4.94 0.6
Danny Duffy 4.75 0.6
Johnny Cueto 4.64 0.5
Adrian Houser 4.82 0.4
Jon Lester 5.14 0.2
Tyler Alexander 5.26 -0.1
Alex Young 5.57 -0.2
Tanner Roark 6.86 -0.6
Total 4.41 10.3
Pitchers with five pitches thrown at least 100 times, 2020

As you can see, Civale was one of 13 pitchers to throw five different pitches at least 100 times last season. This isn’t a group of particularly good or bad pitchers. In fact, combined, these 13 had a FIP- of exactly 100. And though Civale had a solid 2020 season, it’s not as if his 4.74 ERA, 4.03 FIP, and 22% strikeout rate scream ace.

What is interesting about Civale is that he has changed so dramatically year-over-year. Though he threw five different pitches fairly frequently, it is Civale’s sixth pitch — his four-seam fastball — that is in the spotlight so far this season. After throwing just 58 total four-seamers out of a total of 2,064 pitches over his first two seasons in the majors, Civale has already thrown 83 in his three starts this April. Still, that’s not the only change he has made (pun fully intended). Civale has ditched his traditional changeup in favor of a split-change and has all but stopped throwing his sinker. His yearly pitch type chart is extraordinary:

That’s not all. Civale also completely revamped his delivery, adopting a shorter arm action. It’s the same mechanical change Lucas Giolito made going into the 2019 season, greatly contributing to his development into a frontline starter. In a similar move, Civale went from being a long-windup, over-the-top pitcher last season to one who is now a side-stepping short-armer.

“That will be my windup for the year,” Civale told reporters, including Mandy Bell of MLB.com, this spring. “I did a lot of my work out of the stretch in the offseason. Changing my arm path, I didn’t want to add any rotation into my delivery that could alter that. Just decided to keep it simple. I didn’t do too much work on that windup, it’s just a little stutter-step. Not really shifting too much weight. A lot of the work I did to transition to the new arm path was out of the stretch. Less movement is less chance for error.”

Here’s 2020:

And now 2021:

Given how much Civale changed, the title of this article may actually be an understatement. One could argue that he is a completely different pitcher now. It’s hard to know exactly what results those changes will bring, and considering how different he has become, it’s interesting that his numbers are almost identical to last year’s thus far.

Still, it’s worth examining the early returns on an individual pitch level — even if the samples are minuscule — and comparing those to previous seasons. First, let’s look at the exchange of the sinker for the four-seam fastball, a rather common move by pitchers over the last few seasons as sinkers across the league continue to get crushed.

2020 Sinker vs. 2021 Four-Seamer
Pitch % of Total MPH wOBA xwOBA Whiff% CSW%
2020 Sinker 28.9% 91.8 .359 .358 11.3% 34.0%
2021 Four-Seam 29.6% 91.3 .293 .361 31.8% 25.3%

Admittedly, the number of both pitches he’s thrown is small. But, at least so far, what is interesting is that the pitches have generated rather similar quality of contact results. While Civale’s four-seamer has performed better from a wOBA standpoint, the two pitches have almost identical xwOBAs. Also striking is that Civale’s CSW% from his 2021 four-seam is lower than on his 2020 sinker, despite generating a whiff almost three times as often. Indeed, Civale already has 14 whiffs on his fastball this season, out of 44 total swings; last year, his sinker generated just 15 whiffs on 133 swings. That is a marketed improvement.

Additionally, while neither Civale’s fastball nor sinker will blow by hitters in the low-90s, the four-seamer’s movement profile is noteworthy. Kevin Goldstein recently wrote about the importance of fastball shape, and indeed, Civale’s pitch looks not-too-dissimilar from the 2016 Marco Estrada example he was highlighted. 2021 Civale is on the left, and 2016 Estrada is on the right:

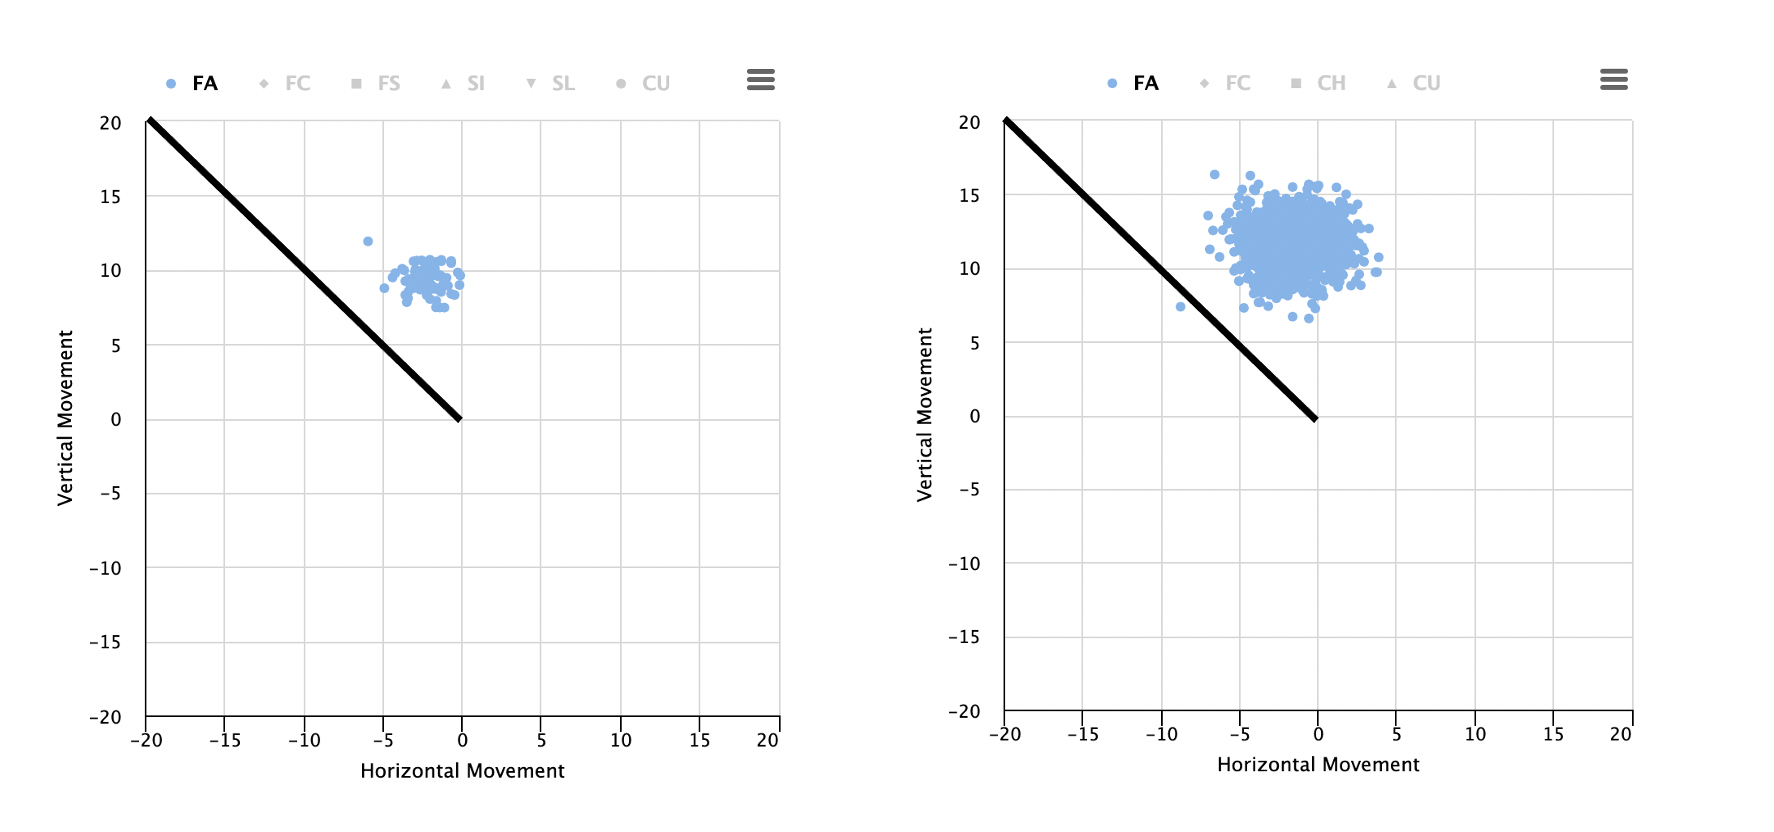
Of course, Civale doesn’t quite match Estada in the vertical movement department. But there’s clearly a similarity between the two in terms of raw, non-velocity-adjusted rise. Even after adjusting for velocity, however, Civale still generates about 5% more rise on his fastball than average, which definitely represents better pure stuff than his sinker, which generated 8% less sink than average. Indeed, as we would expect, there are signs that hitters will be popping him up. Civale is currently in the 75th percentile in average launch angle off of the four-seam fastball and has also been a big proponent of the lazy fly ball, ranking 16th in average exit velocity allowed on all air contact.

Then there’s the changeup, which — as Civale noted himself — is now a split-change. With the adjustment, it might have become his best pitch, or at least gives him a second strong offering in addition to the cutter. By our pitch values, Civale’s 2020 changeup was worth 1.6 runs above-average per 100 pitches. So far in 2021, his “split” has been worth 4.3 runs per 100. While we are again dealing with small sample caveats, here is what the quality of contact numbers look like year-over-year:

Changeup vs. Split-Change
Pitch % of Total MPH wOBA xwOBA Whiff% CSW%
2020 Changeup 9.2% 85.3 .155 .272 34.1% 31.8%
2021 Split-Change 18.2% 84.6 .146 .174 17.9% 19.6%

Again, we can’t yet draw firm conclusions from the wOBA and xwOBA data, though in the early going, it seems as if Civale has made what was a good pitch even better. Similar to the fastball/sinker chart, though, Civale is struggling in the CSW% department, with his former pitch performing much better than his new one so far. It very well could be noise, or it could still be him getting used to the new delivery; it’s worth noting that his overall CSW% is down six points from 2020 to ’21 as well. Nonetheless, to the naked eye, it definitely looks like he is getting more bite on the change; it’s dropping by about four more inches this year on average.

Here’s Civale’s 2020 change:

And here’s his 2021 split-change:

What do we make of all of this? It’s hard to know. There are so many moving parts, and it’s still early in the season, after all. But if you like pitcher reboots, you should definitely be paying attention to what Civale has done. I am not sure I have ever seen a pitcher change so much in just one offseason. I’m curious to see how it works out for him, and, really, I’m fascinated by his willingness to overhaul everything in an attempt to become a more effective player.