The New Ball Is Confusing!
Last week, Justin Choi published an examination of the new ball. The results were — well, you should read it for yourself, but they were muddled, to say the least. Home runs are down! Exit velocity is up! Liners got better, fly balls got worse. It’s enough to make you wonder whether we’ll ever know the answer. It’s also catnip to analysts, and so today I’d like to present some supplemental evidence that only makes me more confused.
There were two key conflicting findings in Justin’s research. First: home runs are down, and fly balls aren’t carrying as far, on average, as they did last year. Second, overall exit velocity is up league-wide, whether you care about broad averages or the hardest-struck balls. The two effects — harder hits, less carry — benefit line drives over fly balls, because line drives both spend less time in the air and depend less on distance for their value.
I wasn’t really sure what to make of the fact that fly balls are carrying less. There are so many confounding factors — weather, new humidors, angle, stadiums, the list goes on and on — that I don’t think I’ll ever be able to disambiguate them all, but I took a crack at it.
First things first: I took all the batted balls that were hit from April 1 to April 30 in 2019. Why 2019 instead of 2020? Temperature and weather are part of the total picture here, and given that there were no April games last year, we’ll have to go further back to make our data tie out.
Next, I separated them based on their launch angle and exit velocity. I took every ball hit between 93 and 97 mph and put them in a 95 mph bucket, every batted ball between 98 and 102 mph in the 100 mph bucket, and so on. I then bucketed those batted balls by launch angle in the same way. The result is this graph of hit distance based on launch angle and exit velocity:
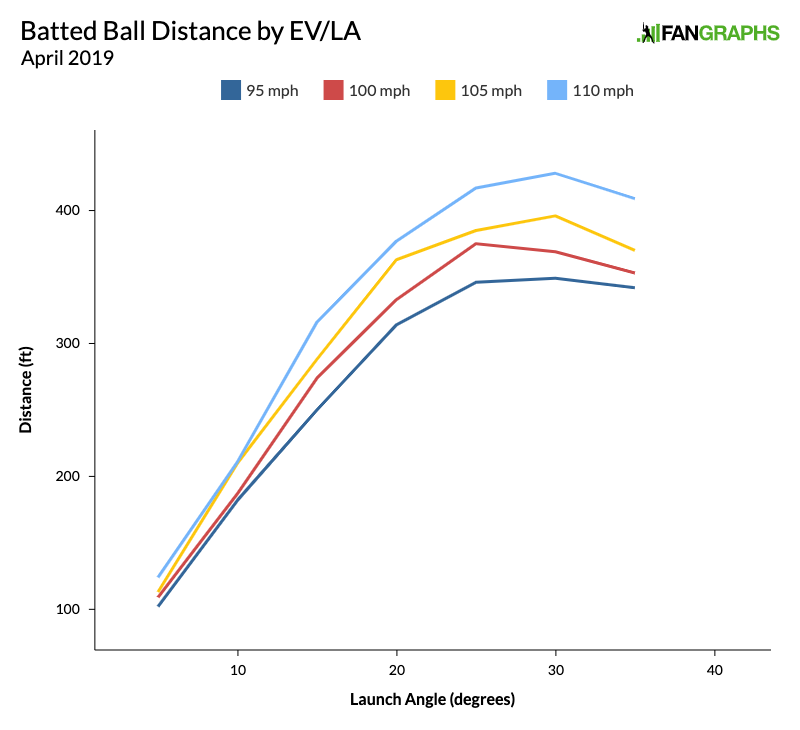
Pretty and informative, at least in my opinion. Or, well, partially informative at least. It’s unsurprising that hitting the ball harder uniformly leads to higher distance, but the decrease in distance when you hit the ball too high makes sense, and I’m happy to see that there.
Great, so we have a 2019 baseline. Plenty has changed since then, both in baseball and in the world at large, but it’s a starting point that can be used for comparison. It’s not foolproof — with only a month of data, the sample isn’t overwhelmingly large — but it can at least give us an idea of whether a massive change has occurred.
Let’s look at the same data through games of April 12 this year:
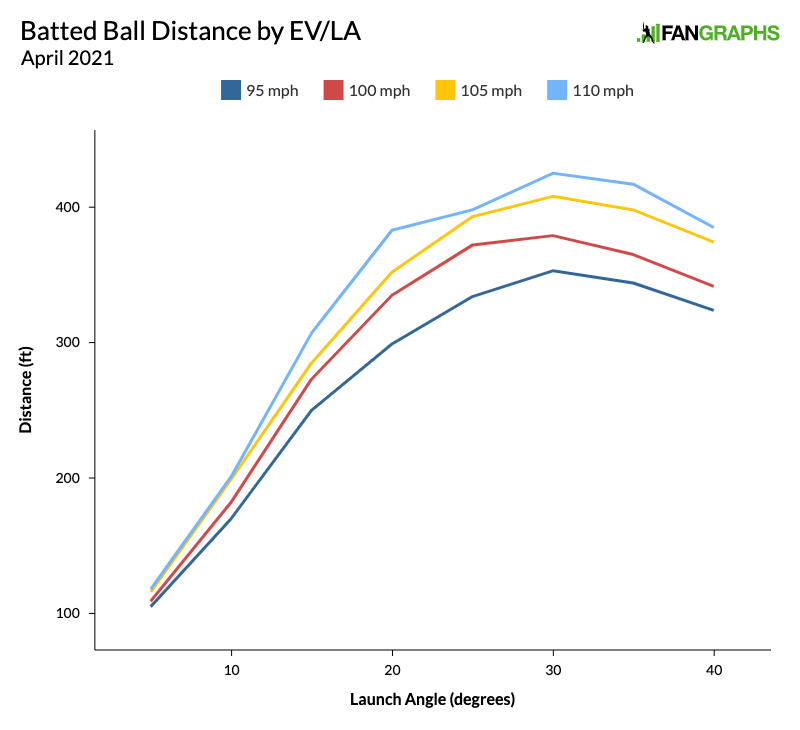
Okay, great, those curved lines look similar to the other curved lines. That’s encouraging, in that we didn’t end up in the Upside Down in the intervening two years, but zoomed-out graphs are no way to discern differences.
Let’s instead look at the changes from one year to the next, using a table instead of a graph. Obviously, now that we’re controlling for launch angle and exit velocity, the increased drag will curtail all distances, higher-angle balls more so… right? Well, drat:
| Speed/Angle | 5 | 10 | 15 | 20 | 25 | 30 | 35 |
|---|---|---|---|---|---|---|---|
| 95 | 3 | -11 | 0 | -15 | -12 | 4 | 3 |
| 100 | 0 | -5 | -1 | 2 | -3 | 10 | 12 |
| 105 | 3 | -10 | -3 | -11 | 8 | 12 | 28 |
| 110 | -5 | -10 | -9 | 6 | -20 | -3 | 8 |
That’s a bunch of gibberish. Balls hit at 20-25 degrees, roughly a high line drive, haven’t gone as far. Balls hit at a loftier angle — the ones we expected to be hurt the most — are carrying farther. And balls hit at 10 degrees, low line drives, are also down in distance. This isn’t what I expected at all.
Now is the time where I inject a healthy dose of qualifications. These batted balls aren’t exactly like-for-like. They weren’t all hit in the same stadiums in identical conditions. I’m not accounting for spin on the ball; a little bit of backspin can increase carry, while topspin (or hook/slice) can decrease it. Some of these buckets, particularly in 2021, are light on observations; a wind-aided ball or two could overwhelm the effects of the new baseball.
All that said, I spent some time trying to find reasons to doubt my sampling method and mostly came up empty. When you select every batted ball within 2 mph of a given signpost, you aren’t guaranteed the same average in each sample. I went back and looked — and nope, not a problem. The average within each exit velocity delineation was within 0.1 mph for each observation, and only the 95 mph bucket displayed higher average exit velocity in 2021. Next!
What about launch angle, in the same way? Maybe the “35” degree balls in the 2019 sample are actually 36 degrees on average, while they’re 34 degrees in 2021. Given that more loft past a certain point decreases distance, we could have a problem there. I had marginally more success poking holes in my own graphs there, albeit in the wrong direction. The 110 mph/35 degree bucket, in particular, had 0.3 degrees more average loft in 2021 — but that should point the other way.
In truth, we can’t say much about the new ball based on the data I’m presenting here. If the new ball is changing the carry of balls in flight — and based on what the league said about the ball before the season, there’s good reason to believe that’s the case — a more granular study will be necessary to measure that change in carry.
That change in exit velocity? It’s real — depending on where you look. In 2019, the hardest 20% of batted balls averaged 103.5 mph off the bat. In 2021, that number stands at 103.3 mph. That’s basically indistinguishable, but the top of the register shows some differences:
| Top | 2019 | 2021 |
|---|---|---|
| 20% | 103.5 | 103.3 |
| 10% | 106.4 | 106.6 |
| 5% | 108.6 | 108.9 |
| 3% | 109.9 | 110.2 |
| 1% | 112.1 | 112.7 |
Additionally, as Justin mentioned, hitters are setting new highs in exit velocity left and right. I’m comfortable saying that, at least in the early going, the ball seems to favor higher exit velocities. I’m just not so sure that we can say anything about its drag properties based on batted ball data.
That leaves one mystery. Why aren’t fly balls carrying as far this year? If you’ll recall from Justin’s article, the average fly ball (25 to 40 degrees) carried 334 feet in 2020. In 2021, that number is at 329 feet (up slightly since his article was published). That’s still five feet short, but there appears to be at least some seasonality. In 2019, April fly balls averaged 329 feet of carry. Fly balls for the year as a whole checked in at 332 feet. In 2018, April fly ball distance checked in three feet short of the year as a whole.
That’s certainly not conclusive. Heck, I’ve been using all-April sample sizes to get more data points, but I can’t use all of April 2021 just yet, what with the tyranny of linear timelines. There are all kinds of problems with finding any definitive takeaways from this analysis.
That lack of conclusion is, in my opinion, interesting in itself. I was half-expecting a bright line change, an obvious difference between baseballs old and new. Instead, the difference is subtle, measured in single-digit feet and fractions of a mile per hour — if indeed there has been one so far.
There’s other ancillary evidence that the ball might be suppressing offense. Home runs per batted ball are down from April 2019, as well as from last year. That’s in spite of the fact that, as we already covered, the hardest-hit balls are being hit harder than ever. It sure feels like something’s going on. For the life of me, though, I can’t figure out what it is.
There will be plenty more time to observe the ball as the season wears on. We’ll get more information with every crack of the bat, with every lazy fly ball and smoked line drive. Granular data on the flight of the ball and atmospheric conditions will help, as well. The mystery won’t remain unsolved forever. For now, though, I feel comfortable saying only this: MLB has announced that they are using a different baseball, but there isn’t yet conclusive evidence of that ball’s effect on the game.
Ben is a writer at FanGraphs. He can be found on Bluesky @benclemens.
Is there any objective difference in average movement and/or spin by pitch type? Any change in seams would likely show up on both sides–fly ball distance as well as pitch movement. Not sure if it’s possible to get a clean average, given all the types/classes of pitches, though…
It definitely wouldn’t hurt to check on this. However, I think with how intentionally pitchers can manipulate their pitches, with and without substance, and the frequency which they alter their repertoires it could also turn out to be noise.
Updating a stat I’ve posted a few places – there are 323 hitters who had at least 50 PA last year and 1 batted ball this year. Eighty of them have already hit a ball harder this year than they did last year. By year:
2021: 80 / 323 (24.76%)
2020: 106 / 367 (28.88%)
2019: 208 / 425 (48.94%)
2018: 226 / 407 (55.52%)
2017: 163 / 401 (40.64%)
2016: 212 / 412 (51.46%)
We haven’t even played 10% of the season and we’re already nearly halfway toward equaling full year totals.
There have been 3 guys who already have hit a ball more than 7 mph harder than last year (Correa,, Andrew Knapp and Ohtani). In the entire Statcast era there have only been 7 such prior seasons and two of those guys were pitchers (deGrom in 2019 and Jimmy Nelson in 2017).
That is an interesting stat – but some of this will be of the pandemic season last year. Yes, it isn’t even 10% of the season yet – but it is over 16% of the season last year, so most batter would have had 200PA to get their highest velocity in, compared to 600PA in a normal year.
Fair point.
Hitters might be as strong and healthy as they will be all year right now. They also all theoretically had more time to get healthy and build strength last year. Hard to pinpoint cause.
Higher spin rates on most pitches will result in LOWER spin rates on batted balls, which in turn will reduce carry. Why do higher spin rates on pitches reduce spin rates after contact? Think of basketball, where a “shooter’s bounce” off the rim deadens the ball because the backspin on the shot absorbs more energy from contact with the rim. Better shooters have more spin on the ball, so their shots die on contact with the rim and more frequently fall through the twine.
Anecdotally, I can say that I’ve heard announcers call a lot of fly balls this year that looked good off the bat and died on the warning track. More than other years? Not sure.
Complete guess at the increase in distance on the highest-hit balls – could there be an increased backspin effect? Increased drag could also mean increased coriolis force, so there might be a benefit to the balls hit with the most backspin. Or it could just be two weeks of unusually strong wind blowing out. Small samples indeed.
I have noticed the same thing, Totally anecdotal, but still seems way too many.
Could also be some announcers watching the on monitors remotely, instead of from the booth above home plate. I know at least the Mariners broadcast teams have stayed in Seattle while the team travels.
I feel as a fan watching on TV that I’ve been horribly wrong a lot this year based on off-the-bat reactions.
I think you meant Magnus effect, not Coriolis force.
Clearly, the answer is that the new balls have also changed the air. Obviously the only explanation.
Eno Sarris has an article on the new ball at The Athletic ($)
https://theathletic.com/2514275/2021/04/14/more-drag-but-more-bounce-the-new-ball-is-having-bewildering-unexpected-impacts-on-the-game/
Conclusion: Seems like a shrug is about the best we can do
Feels like temperature could be the culprit here. Using full season 2019 vs first half of April 2021, I assume the temperatures for the former would be higher. I also assume that temperatures would have a negligible impact on exit velocity, but a significant impact on distance.
Edit: My bad, in re-reading I just noticed this is April 2019 vs April 2021. Might still be year-over-year temperature differences, but less likely to be significant.
Comparing the first two weeks of April to all of April is going to have a significant temperature disparity in most places. In St. Louis, MO, for example, average temperature rises almost ten degrees in April. Ben should check back on May 1 and see how his charts look.
Thanks for this report. I hope you will continue to update as season moves along. Nice Job.
Is it possible that the top-end exit velocities are up because Aaron Judge and Giancarlo Stanton are healthier this year than in 2019? I wonder if the mere availability of elite power guys is skewing the sample?
Is there any chance that part of the issue is calibration of the devices measuring exit velocity? I would imagine the ability to measure distance is better calibrated than velocity. I can see a lot of teams just not being terribly rigorous with these types of calibrations, especially since in this case especially they can still get very useful data by having measurements that are precise rather than accurate. If they’re measuring all their players and their equipment says 95 mph rather than 98 mph, who cares? They would still be able to evaluate their own players perfectly well, as long as that measurement of 95 was consistent.
The more I think about this, the more I think if you take this argument out to an abstract principle, it is the most plausible answer. If something shifts abruptly like this it’s almost always because it’s getting measured differently. And methods of measurement change all the time.
This touches on a point that really needs to be brought up. MLB introduced Hawkeye last year, so we don’t have a lot of data on it vs Trackman. This 2019 vs 2021 data could be subject to some small but real differences in tracking quality between the two systems, and less so differences in contact quality.
I can’t imagine this is not part of the issue, if true. I haven’t been following this whole thing all that closely, but if they’re using a completely new system as compared to the 2019 numbers, then I’d be fairly surprised to learn that calibration issues weren’t a significant source of confusion in the numbers.
100% I think the calibration of Hawkeye definitely is part of the equation. For example, have you noticed how the release extension for virtually every pitcher in baseball increased last year? It’s my understanding they haven’t figured out yet why that is either.
The balls weren’t standardized until now and had a range from 5-5.25 ounces. This could be producing a variety of issues that makes comparing results for the new standardized balls more tricky. Throw in teams using humidors secretly and now openly, but not throughout the league creates lots of tiny issues making the results difficult to pinpoint.
From a very superficial view of the graphs, it appears to me that the launch angles are distributed differently this year. A higher % of pop-ups. So even if the ball is carrying the same distance at the same launch angle – the overall data would show the ball is carrying less because it’s not the same launch angle.
Or did I miss this in the article itself?
Pitchers are throwing harder – this is measured – which means that a ball hit with the same force will naturally have a higher EV, all else equal.
This is not an apples to apples comparison for the entire change to the ball. If the bounciness of the ball changed, the EV for the same force applied by the bat will be different. The speed/angle comparisons are only looking at how the ball affects distance after contact with is primarily affected by drag (and not the bounciness). I’m not sure on why 30, 35 launch angle hits appear to be affected by drag less. Is it possible that the interior changes to the ball cause it to have more drag right after the collision (i.e., a distorted shape would cause more drag) and to regain shape mid-flight such that there is less drag the longer the ball is in the air?
I’d like to see EV reduced for the sake of pitchers’ faces. No one needs to be hit with a 112+ mph projectile in any sport while they are near defenseless. The reaction time is just not there no matter how you come off the mound. It’s a matter of time before a tragedy will drive this change.
I hope the focus of concern is not HRs. The league is not suffering from a lack of HRs. So far this season there are 1.18 HR/game. That is the 4th highest rate of all time behind only 2019, 2020 and 2017 (and it is only mid-April). I’m more concerned about the hitting in general as the current league batting average is only .235 (which is the lowest in history – even lower than 1968 which was .237), there are currently 9.32 K/game (which is by far the highest in history) and there are 3.52 BB/game (which is the highest since 2000). I’m curious how the flyball and popup rates compare to previous seasons. It would also be interesting to compare the rates of different launch angles to previous seasons. Has the new ball, combined with the “flyball revolution,” caused the TTO to be even more pronounced?
I see that you and I see the same situation and the same problem. The Cubs were shutout again today on 4 hits. Through 12 games the team is hitting .163. That has to be the lowest average after 12 games in the modern era. At least The Atlantic League is going to experiment with 61’6″ during the second half of their season after chickening out in 2019. Just as in basketball, football and even golf, the people who play the game have grown too big and too powerful for the dimensions of the field of play and the original rules of the games themselves. Golf added distance to the courses, at a considerable increase in the cost of maintenance, but it hasn’t really helped. Linemen are so big that the running game is disappearing and the rules change constantly to help the offenses. Basketball was forced to add the 3-point shot to open up the middle but baseball hasn’t yet faced the large increase in velocity that bigger, stronger pitchers are doing which has led to the sharp decrease in the amount of contact
I don’t see why we don’t just create the 1919 ball or something close to it. Modern hitters will still get that thing out of the park at at least 1980s rates, in the meantime it would encourage hitters to take more of a contact-first approach. This three true outcomes version of the game is just a less interesting brand of baseball in my view, I don’t want to watch people walk, walk back to the dugout, and walk around the bases, I want to see people running around the bases, firing balls home to nail the advancing runner, close plays on the bases, and sweet double plays.
I don’t think there is much doubt that something needs to be done after Rodon just threw the No-Hitter of the Week tonight. It won’t be long before all scoring stops and the team that strikes out the least wins.
Someone should take a look at Park Factors. With the ball change, they seem pretty strange. Oracle played like Coors in 2020.
I guess my wild guess is that it’s a property of sample sizes that are too small. That will often yield random variations that don’t really make sense and even out over a larger sample size, outsized influence of outliers. For example one batter crushes a ball against a stiff wind at Wrigley field for a medium fly out and suddenly everything looks out of whack.