Author Archive

Dickey Has Mets Fans’ Hearts Aflutter

R.A. Dickey is a 35-year-old, ligament-challenged right-hander who hasn’t cracked 90 MPH on the radar gun since he pitched for the University of Tennessee. His nomadic existence has taken him through five different organizations over the past five years. Up until two months ago, Dickey took his starting assignments in front of several thousand people in places like Scranton/Wilkes-Barre and Pawtucket. But now the knuckleballer is pitching as well as anyone in the Mets’ rotation.

Like the fluttering pitch that has given him new life, Dickey’s career has been an exercise in unpredictability. Once a touted prospect who pitched for the 1996 U.S. Olympic team that won a bronze medal in Atlanta, Dickey was selected by the Texas Rangers with the 18th overall pick in the amateur draft that year. The Rangers offered the Volunteers’ ace $850,000 to sign on the dotted line. But that was before a team doctor glanced at the cover of Baseball America’s Olympic Preview issue and noticed Dickey’s arm hanging in a peculiar position. The doctor soon discovered that Dickey didn’t have a Ulnar Collateral Ligament in his elbow. The club’s bonus offer plummeted to $75,000, with Texas’ expectations for Dickey going from future rotation stabilizer to big league long shot.

Dickey did eventually reach the majors with the Rangers, logging 266 innings over the 2001-2006 seasons. His stuff was dime-a-dozen, though: a high-80’s fastball, an occasional fringy breaking ball, and a forkball he dubbed “The Thing.” He started toying with a knuckleball in 2005, and Texas gave him the chance to try it out as a starter at the beginning of the 2006 campaign. Six home runs later, Dickey had tossed his last major league frame with the team.

Since then, Dickey has drifted. In 2007 he signed with the Milwaukee Brewers and posted a nondescript 4.36 FIP at Triple-A Nashville. That winter, he latched on with the Minnesota Twins. But, as a guy not on the 40-man roster with the requisite time in pro ball, Dickey was eligible for the Rule V Draft and was snagged by the Seattle Mariners. The M’s eventually worked out a trade to keep his rights while being able to send him to the minors. Dickey ended up tossing 112 frames as a swing man for Seattle, with a 5.20 xFIP that was exactly replacement-level. He signed with the Twins again last season, posting a 4.90 xFIP and -0.1 WAR in 64.1 innings. Save for one start, all of that work came in relief.

When the Mets signed Dickey to a minor league deal this past December, he wasn’t counted on to do anything but help the Buffalo Bisons compete for International League glory. But with the flutter ball flummoxing Triple-A hitters (60.2 IP, 5.5 K/9, 1.2 BB/9, and a 3.16 FIP) and Oliver Perez spontaneously combusting, Dickey got the call in mid-May. And, in 79 innings pitched, Robert Alan Dickey has a 3.78 xFIP that bests the likes of Johan Santana and Mike Pelfrey. Who knew?

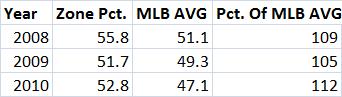
Dickey has struck out 6.15 batters per nine innings and walked 2.51 per nine, displaying strong ground ball tendencies to boot (54.3 GB%). According to Pitch F/X data from TexasLeaguers.com, Dickey’s throwing the knuckler for a strike about 65% of the time, while getting a whiff nearly 11 percent of the time that he throws the pitch, which helps explain how he has managed an 8.6% swinging strike rate- slightly higher than the 8.4% MLB average.

R.A.’s knuckleball is odd in a couple of ways. For one, he’s burning worms with the pitch. Per Pitch F/X data on Joe Lefkowitz’s site, Dickey’s ground ball rate with the knuckler is 53.5%. There obviously aren’t many other pitchers to whom we can compare that number, but Harry Pavlidis showed that the average ground ball rate with the pitch is about 37 percent. Dickey’s knuckleball is also strange because of its speed — Dickey has thrown the pitch anywhere from 63 MPH to 83 MPH:

For comparison, Tim Wakefield has a 16 MPH range in his knuckleball velocity (58 to 74 MPH). The vast majority of his knucklers sit in the mid-60’s.

Dickey’s mid-80’s fastball, which would be a BP pitch without the knuckleball, hasn’t been hit hard. Nobody’s whiffing at the offering (just 2.4%, while the MLB average is 5-6%), and opposing batters are slugging .469 when making contact with the pitch (.567 MLB average).

In just two months, Dickey has racked up 1.6 Wins Above Replacement for the Amazin’s. Not bad for a guy who shouldn’t be able to turn a door knob without pain, much less fool major league hitters.


Ryan Braun’s Power

As a 26-year-old slugger signed through the 2015 season for a total of $40 million, Milwaukee Brewers left fielder Ryan Braun is one of the most valuable assets in the game. The former Miami Hurricane recently placed twelfth on Dave Cameron’s Top 50 Trade Value list. But, while noting Braun’s bargain contract and history of crushing the ball, Cameron pointed out a downward trend in Braun’s power output:

Braun was a monster in his rookie 2007 season, but he has never been able to repeat those kinds of power numbers. In fact, his isolated slugging has declined in each of the four years he has been in the big leagues, moving in tandem with his strikeout rate, which has also fallen each year. Braun has apparently made the opposite choice that [Colby] Rasmus made, and unfortunately, it hasn’t helped Braun. The skills are still there for him to be a star, but Braun is going the wrong way.

While Braun’s pop remains well above the major league average, his Isolated Power has declined considerably since his rookie year:

The fifth overall pick in the 2005 draft has seen his ISO dip from .310 in 2007 to .268 in 2008, .231 in 2009 and .186 this season. Prior to 2010, both CHONE and ZiPS projected a .259 ISO from Braun.

As Cameron noted, Braun’s making more contact, perhaps at the expense of hitting with as much authority. His overall contact rate has increased each season — 76.3% in ’07, 79.2% in ’08, 80.8% in ’09 and 81.9% in 2010 (81% MLB average). Braun’s K rate has gone from 24.8% in ’07 to 21.1% in ’08, 19.1% in ’09 and 17.3% this year.

Braun’s also hitting more ground balls and fewer fly balls:

He hit a ground ball 38.8% of the time as a rookie and 38.7% as a sophomore. But in 2009, that ground ball rate rose to 46.5%, and this season, it sits at 48.2%. Braun’s fly ball rate was 44.9% in 2007 and 44.1% in 2008. In 2009, his FB% fell to 34.1%, and it’s 36.7% in 2010.

So, Braun has been putting the ball in play more, but that extra contact hasn’t been forceful. Has anything changed in terms of where he’s hitting the ball? Not really. Braun’s spray numbers are right in line with his previous seasons:

His performance on those balls put in play, however, has certainly changed. In particular, he’s not pulling the ball with near the same might as in years past:

Braun displayed jaw-dropping power to the pull side in 2007 and 2008, and remained well above-average last season despite a sharp increase in ground balls hit. This season, Braun has actually been worse than the average righty batter on pitches hit to left field.

On pitches hit to the middle field, Braun is still a beast:

When punching pitches to the opposite field, Braun has typically displayed excellent pop. In 2010, he’s not faring near as well:

Though he’s bashing fewer homers this year, Braun is hitting tape-measure shots when he does go yard. Hit Tracker Online shows the average “Standard Distance” on home runs hit. Stand Distance homers are defined as:

The estimated distance in feet the home run would have traveled if it flew uninterrupted all the way down to field level, and if the home run had been hit with no wind, in 70 degree air at sea level. Standard distance factors out the influence of wind, temperature and altitude, and is thus the best way of comparing home runs hit under a variety of different conditions.

Here are Braun’s average standard Distance numbers over the years, as well as the 2010 MLB average:

Whether it’s a conscious decision or not, Ryan Braun is putting the bat on the ball more often while splitting the gaps and clearing the fence less frequently, a combination that has led to a career-worst .362 wOBA — still a quality mark, but well below his pre-season projections of .393 from ZiPS and .404 from CHONE. Braun seems plenty capable of once again hitting for prodigious power, with both ZiPS (.243 rest-of-season ISO) and CHONE (.238) predicting more slides for Bernie Brewer from here on out. To recapture his previous form, Braun might want to let ‘er rip at the plate more often — the extra thump would be well worth a few additional whiffs.


Kevin Slowey’s Groundball Rate

At 49-43, the Minnesota Twins are engaged in a three-team battle for the A.L. Central crown. The Twins are 1.5 games back of the resurgent Chicago White Sox following yesterday’s victory over the Pale Hose (the Detroit Tigers also sit a game and a half back of the division lead). There is essentially no chance that the Wild Card comes out of anywhere but the AL East, so it’s division title or bust for the Twins. The club’s odds of playing postseason baseball — currently 36 percent according to Cool Standings — are heavily influenced by Justin Morneau’s return to health. But the Twins could also use a return to 2008 form from Kevin Slowey.

A second-round pick out of Winthrop in the 2005 draft, Slowey has always boasted off-the-charts control. He issued just 1.3 walks per nine innings in the minors, punching out 8.8 per nine, and surrendering 0.5 HR/9 despite a low ground ball rate. According to Minor League Splits, Slowey induced grounders 41.1 percent of the time on the farm, but many of the fly balls hit against him were weak — his infield fly rate was 19.5 percent.

Slowey made his big league debut in 2007, tossing 66.2 innings with 6.35 K/9, 1.49 BB/9, and a 4.78 xFIP. He owned one of the five lowest ground ball rates among pitchers with 60+ IP, at 28.9 percent. Converesely, the low number of grounders led to lots of round trippers — Slowey gave up 2.16 HR/9. The prospect often compared to Brad Radke had a higher-than usual home run per fly ball rate (13.3 percent), but with so few grounders and ample fly balls hit, homers figured to be a big problem for Slowey if hitters continued to loft the ball so often.

The next year, Slowey’s ground ball rate increased (relatively speaking), and he posted a 4.02 xFIP in 160.1 innings after coming back from an early-season biceps strain. Since then, Slowey’s xFIP has gone in the wrong direction: in 2009, he had a 4.23 mark in 90.2 IP before right wrist surgery ended his season in July, and he currently holds a 4.68 xFIP in 100 innings this season. Slowey’s control remains superb, though he’s walking slightly more hitters (1.35 BB/9 in ’08, 1.49 BB/9 in ’09, and 1.71 BB/9 this year). His K rate, 6.9 per nine in 2008 and 7.44 per nine in 2009, is also a little worse than usual at 6.3 K/9. Another disconcerting sign for Slowey is his ground ball rate.

I used Pitch F/X data from Joe Lefkowitz’s site to find Slowey’s batted ball distribution over the 2008 to 2010 seasons. I also included the MLB averages for pitchers, provided by Harry Pavlidis at The Hardball Times. These numbers differ from the BIS data on Slowey’s player page, but you’ll note a clear change in his batted ball profile:

(Note: Pitch F/X is showing more of Slowey’s fastballs as “sinkers” this season. It seems like this could be a classification change by Pitch F/X instead of a change on Slowey’s part, so I decided to lump all his fastballs together. For the purposes of this article, the MLB averages for the fastball are for four-seamers.)

Slowey’s ground ball rate, already low, has declined sharply. Some of those grounders have been replaced by pop ups, particularly in 2009. But this season, Slowey’s giving up lots of balls classified as flies and liners, which is not a happy development, given that fly balls typically have a slugging percentage between .550 and .600 (Slowey’s career SLG% on fly balls is .639) and liners fall for hits about 72 to 73 percent of the time (about 75 percent for Slowey).

Is Slowey doing anything different in terms of pitch selection this season? He is using his fastball less often, in favor of mid-80’s sliders and mid-70’s curveballs:

Using Lefkowitz’s Pitch F/X tool, I broke down Slowey’s batted ball distribution by pitch type:

Read the rest of this entry »


CarGo’s Plate Discipline

Colorado Rockies outfielder Carlos Gonzalez has been a popular subject around these parts lately. First, Gonzalez just missed making Dave Cameron’s list of the 50 players with the highest trade value in the game. As a plus defender with power who won’t reach arbitration until after the 2011 season, Gonzalez has considerable appeal. Here’s what Cameron said about him:

There aren’t many guys who can play a legit center field and hit the baseball a long way, but Gonzalez brings both skills to the table. Unfortunately, the rest of the game isn’t quite as refined, and his approach at the plate is a problem. His aggressiveness can and will be used against him, and when pitchers adjust, he’ll need to as well.

Jack Moore used his “Four Factors” to break down Gonzalez’s offensive game. While noting CarGo’s ability to drive the ball and praising his wide array of skills, Moore also voiced concern about the 24-year-old’s plate approach:

Two thousand and ten showed more of the same on the power front, certainly an encouraging sign for Rockies fans. But Gonzalez’s BB% has dipped back to where it was in Oakland, which is obviously disappointing after the 2009 season, as his minor league track record – no extended stints with double digit walk rates – doesn’t particularly suggest an ability to walk at a high rate, and this start to 2010 is dashing some of the hopes that Gonzalez’s on-base skills would approach average.

Today, I want to take a closer look at Gonzalez’s offense over the 2009 and 2010 seasons. Last year, Gonzalez began the season by annihilating pitchers at Triple-A Colorado Springs — in 223 plate appearances in the PCL, he batted .339/.418/.630. Gonzalez walked 9.9 percent of the time and boasted a .292 ISO. Despite taking his cuts in a favorable hitting environment, his major league equivalent line was .281/.343/.474, according to Minor League Splits.

Once Gonzalez reached Colorado, he authored a .284/.353/.525 triple-slash in 317 PA, with a 125 wRC+. In addition to posting a .241 Isolated Power, CarGo walked in 8.8 percent of his trips to the plate (his unintentional walk rate was 7.9 percent). This season, it looks as though Gonzalez picked up where he left off — his wRC+ is 126 in 347 PA. But, as his .314/.346/.532 line suggests, the distribution of that production has shifted. He’s still lashing lots of extra-base hits (.218 ISO), but his walk rate has dipped to 4.6 percent (3.5 percent unintentional walk rate).

Compared to last season, Gonzalez is chasing more pitches thrown off the plate and going after more in-zone offerings as well. His first pitch strike percentage was around average (58-59 percent) in 2009, but it has climbed in 2010:

Courtesy of Dave Allen, here are Gonzalez’s swing contours over the 2009 and 2010 seasons. The dotted line indicates CarGo’s 50% swing contour — in other words, inside the contour his swing rate is greater than 50% and outside it is less. Same deal with the solid line, which is his 75% swing contour — he swings more than 75% of the time a pitch is thrown within that area, and swings outside of it less. The black lines represent Gonzalez in ’09, and the purple lines are Gonzalez this season.

Both his 50% and 75% swing contours have expanded considerably in 2010, particularly on low pitches. When an opponent throws him something below the knees, Gonzalez goes golfing.

So far, Gonzalez’s hacking hasn’t hurt him — the drop in walks has been offset by a spike in BABIP (.333 in ’09, .360 this year). While he has a history of high BABIP marks in the minors (.344 since 2005, per Minor League Splits), .360 probably isn’t sustainable. Gonzalez’s expected BABIP, which is based on his number of home runs, strikeouts, stolen bases, line drives, fly balls, pop ups and ground balls, is .340.

Every team in the majors would love to have a fly catcher with Gonzalez’s present talent and even higher ceiling. But if he’s going to keep up this sort of pace offensively, he might want to leave the nine iron in his bag and show a little more restraint at the plate.


Doumit’s Rough Defensive Season

Since the Pittsburgh Pirates selected him out of a Washington prep school in the second round of the 1999 draft, Ryan Doumit’s calling card has been his bat. The switch-hitter compiled a .293/.366/.454 line in the minors, managing to stay on the prospect periphery despite numerous injuries and a defensive reputation that produced an unfortunate nickname: “Ryan No-Mitt.”

Pittsburgh’s previous front office regime, led by Dave Littlefield, appeared ready to pull the plug on Doumit’s catching career. The club had Doumit log considerable time at first base and right field over the 2006-2007 seasons, while the injuries (including a torn hamstring and a sprained wrist and ankle) continued to pile up. Neal Huntington and company had a different philosophy, however. While Doumit wasn’t considered a defensive standout, they reasoned that his positional value was still greatest behind the dish. At first base or a corner outfield spot, Doumit’s bat didn’t stand out near as much.

The Pirates were rewarded handsomely for that decision in 2008, as Doumit posted a .367 wOBA in 465 plate appearances. According to Sean Smith’s Total Zone defensive system, which grades a catcher by stolen bases, caught stealing, errors, pick offs, passed balls and wild pitches, splitting the data by handedness and comparing a catcher to the league average, Doumit cost the Bucs five runs defensively. Catcher defense remains a hazy area for sabermetrics, but the trade-off appeared to be well worth it — even with -5 D, Doumit rated as a three-and-a-half win player. After the season, the Pirates inked Doumit to a three-year, $11.5 million contract that locked him up through his arbitration years. The deal also included a club option for the 2012-2013 seasons (at a total cost of $15.5 million) that must be exercised or rejected after the 2011 campaign.

Since then, things haven’t gone near as well for Doumit. He suffered a wrist injury that required surgery in 2009, putting up a .306 wOBA in 304 PA and rating as a -1 defender in limited playing time. This season, his bat has bounced back (.331 wOBA in 296 PA), as he’s not hacking as much as last year and his BABIP has climbed more toward his career average. Normally, a backstop hitting better than the league average would be a very valuable commodity. But, from the metrics we have on catcher D, it appears that Doumit is sadly earning that prospect nickname this season.

In 2010, 74 runners have taken off with Doumit behind the plate. Sixty-six of them (89 percent) have come up safe. Among qualified big league catchers, Doumit’s 11 percent CS rate is by far the lowest. He also leads the NL in passed balls, with six. According to Total Zone, Doumit has already been nine runs worse than the average MLB catcher. Matt Klaassen has developed his own defensive rankings for catchers (methodology here), grading backstops by linear weights above or below average on fielding errors, throwing errors, passed balls, wild pitches and caught stealing. His most recent update in late June had Doumit dead last among all catchers. Even though Doumit is having a good offensive year and has remained healthy aside from a few games missed with a concussion, he has yet to crack the one WAR plateau.

Chances are, Doumit’s not this bad defensively — Total Zone has the 29-year-old as a -8 run catcher per 135 games during his career, while he’s currently at -17 runs per 135 games in 2010. But the re-emergence of “No Mitt” has been an unwelcome development during yet another trying season in Pittsburgh.


Nick Blackburn Loses Margin for Error

This past March, the Minnesota Twins locked up Nick Blackburn with a four-year, $14 million contract. The deal covers the right-hander’s final pre-arbitration season in 2010, his three arbitration years and includes an $8 million option for 2014, Blackburn’s first season of free agent eligibility. Minnesota’s 29th round pick in the ’01 draft established himself as a solid rotation cog over the 2008 and 2009 seasons, using surgical command (1.81 BB/9) to compensate for a paltry punch out rate (4.4 K/9). His FIP over that period was 4.38, and his xFIP was 4.52. Blackburn managed 2.5 WAR in ’08, and improved to 3 WAR in ’09.

In 2010, CHONE (4.29 K/9, 1.86 BB/9, 4.42 FIP) and ZiPS (4.21 K/9, 2.06 BB/9, 4.65) expected more of the same from Blackburn. Instead, the 28-year-old has been battered for a 6.40 ERA in 97 innings. That’s the second-highest mark among qualified starters. Granted, Blackburn’s ERA does overstate the depth of his struggles — his BABIP is .324 (.314 career average), his rate of stranding base runners is 66.2% (69.9%) and his home run per fly ball rate is 14.8% (10.7%). But even so, his xFIP has ballooned to 5.14.

Blackburn’s already-low K rate has nosedived into Kirk Rueter-esque territory. He’s striking out just 3.15 batters per nine frames, by far the lowest among qualified starters (Aaron Cook is second, at 3.97 K/9). Nick’s swinging strike rate, 6.5% in 2008 and 5.4% in 2009, sits at an MLB-low 2.9% (Rodrigo Lopez is next, at four percent; the MLB average is 8-9%). His overall contact rate has spiked, from 86.7% in ’08 and 88.1% in ’09 to an MLB-high 93.7% this season (81% MLB average). In addition to missing even fewer bats, Blackburn has issued more walks — his BB/9 total is 2.51.

The scuffling Twins starter is still putting plenty of pitches within the strike zone:

When Blackburn does throw one off the plate, however, batters aren’t chasing near as much:

What has changed for Blackburn? Let’s take a look at his Pitch F/X data from TexasLeaguers.com over the past three seasons. First, here’s his pitch selection and performance in 2008 and 2009:

And now, 2010. I included a “difference” column for strike, swing, and whiff rate, comparing Blackburn’s performance in 2010 to 2008 and 2009. Blue indicates an increase compared to 2008-2009, while red indicates a decline:

Blackburn’s using his fastball and changeup more often, at the expense of cutters and curveballs. He throws a ton of strikes with the fastball, but the whiff rate is abysmal. Blackburn’s inducing fewer whiffs on all his pitches, and keep in mind those ’08-’09 rates were already extremely low. When he does go to his cutter, curve or change, Blackburn’s getting fewer strikes.

In 2008 and 2009, Blackburn was an average starter because of his fantastic walk rate. But, with more free passes and even fewer K’s, he has been a replacement-level arm in 2010. A guy like Blackburn has little margin for error — he’s a ground ball pitcher (48 GB% this season), but not a Tim Hudson-like worm burner, so any decline in his K/BB ratio is going to do serious harm. If Blackburn’s going to be a two to three win pitcher moving forward, he’s going to have to return his strikeout and walk rates to those 2008-2009 levels.


The HR Derby Contestants

I have a strange affinity for the Home Run Derby. It spawns from watching re-runs of the old school Home Run Derby TV series, originally aired in 1960. The rules were different back then — two hitters went head-to-head, squaring off in a nine-inning “game” in which each batter got three outs per inning. If a player didn’t swing at a pitch in the zone, it counted as an out. Between turns, a batter would kick back and chat with host Mark Scott. The winner got a check for two grand and the chance to defend his title the next week against a new opponent. The list of those who competed — Hank Aaron, Willie Mays and Mickey Mantle among them — is a who’s who of all-time greats.

It’s true, the current form of the Home Run Derby doesn’t compare to its progenitor. The field of contestants doesn’t always include a cavalcade of stars. Sometimes, it seems like hitters take 20 pitches right down the middle before letting ‘er rip. And, the broadcast of the event really should come with a public service announcement imploring viewers to turn down the volume, lest they be haunted in their sleep by shrieks of “backbackbackback.”

Yet, despite its flaws, I watch intently. There’s something enthralling about those majestic moon shots. This year, the list of derby contestants includes Miguel Cabrera, David Ortiz, Nick Swisher and Vernon Wells from the American League, and Corey Hart, Matt Holliday, Hanley Ramirez and Chris Young from the National League. While I don’t claim this will have any predictive value — having a BP coach lobbing mid-60’s fastballs down the pike is quite another thing from game conditions — I thought it would be fun to take a closer look at tonight’s contestants. Where do they hit their homers, how hard are they hit, and how far do those taters travel?

Here’s a chart showing where the HR derby competitors have gone yard this season. I listed switch-hitter Swisher’s numbers from both sides of the plate:

Not surprisingly, most of the contestants’ home run power comes to the pull side of the field. Cabrera is crushing the ball both to the pull side and the opposite field — his home run per fly ball percentage to the pull side is 65 (27.2% MLB average for RHB), and it’s 14% to the opposite side (2.8% MLB average for RHB). Hart and Ramirez have also gone to the opposite field more than most, while Ortiz and Swisher have hit a decent number of homers to center.

Courtesy of Greg Rybarczyk’s Hit Tracker Online, here’s how the HR Derby contestants rank in terms of speed off the bat on those homers. The MLB average, for comparison’s sake, is 103.4 MPH:

Wells (106.8 MPH) leads the pack, followed by Holliday (106.1), Cabrera (105.2), Ortiz (104.2), Ramirez (104.1), Young (102.7), Swisher (102.3) and Hart (101.9).

Who’s hitting the longest homers? Hit Tracker measures the “Standard Distance” for home runs hit. From the site, here’s the definition:

The estimated distance in feet the home run would have traveled if it flew uninterrupted all the way down to field level, and if the home run had been hit with no wind, in 70 degree air at sea level. Standard distance factors out the influence of wind, temperature and altitude, and is thus the best way of comparing home runs hit under a variety of different conditions.

Here’s how the derby hopefuls rank in terms of Standard Distance homers. The MLB average is 393.8 feet:

Wells (406.5 Feet) and Holliday (406.1) again rank first and second. Ramirez (400.2), Ortiz (398.8), Cabrera (396.8), Swisher (396.4) and Young (394.5) all best the big league average, while Hart (392.5) comes in below that mark. Hart is tied for the major league lead in “Just Enough” homers, with 10. Just Enough’s, per Hit Tracker, clear “the fence by less than 10 vertical feet,” or land “less than one fence height past the fence.”

And finally, to pre-empt against any cries of “the derby screwed up his swing!,” here are the contestants’ current wOBA totals, as well as their projected rest-of-season wOBA figures from ZiPS. In other words, here’s what they have done so far, and here’s what we can reasonably expect in the second half:

Six out of eight project to hit worse in the second half. Some of these guys have greatly exceeded their previously established level of performance. Even accounting for the spike in production (ZiPS incorporates data from the current season), they figure to regress somewhat when games resume Thursday. If Hart doesn’t continue hitting bombs at a prodigious rate, it’s not because of some HR derby hex — it’s the product of regression to the mean.


Chris B. Young Limiting the Pop Ups

Last season, Chris Young’s big league career reached its nadir. A former White Sox prospect swapped to Arizona as part of the December 2005 Javier Vazquez deal, Young was an acclaimed prospect who displayed an intriguing blend of patience, pop, and speed. The man once rated by Baseball America as the 12th-best talent in the minors didn’t distinguish himself at the plate in 2007 (94 wRC+) or 2008 (95 wRC+), but Young’s offensive game devolved to the extent that the D-Backs banished him to Triple-A Reno in August of 2009. Even after a big September, Young finished the season with an 85 wRC+. His bat was worth nearly ten runs below average.

An optimist might have pointed out that Young established a career-high walk rate (11.8 BB%) and continued to drive the ball frequently, with a .187 Isolated Power. And look — his BABIP was just .268! Young was just unlucky, right?

Well, not exactly. Over the years, Young had developed a disturbing tendency to hit the ball up the elevator shaft. His infield fly ball percentage (IFFB%) was 12.7 percent in 2007, and it climbed to 16.8 percent in 2008. Last season, Young popped the ball up a staggering 22.4 percent of the time that he hit a fly ball. For comparison, the major league average sits between seven and eight percent. Infield flies are the closest thing to a gimme out on a ball put in play, and Young hit more of them than just about anybody — over the period of 2007 to 2009, only Mark Ellis popped up more frequently among qualified batters.

As such, Young basically earned that low BABIP. His expected BABIP (xBABIP) in 2009 was just eight points higher than his actual mark, at .276. When Young was booted to Reno last August, Dave Allen offered a possible explanation for the center fielder’s pop up woes. “Part of the problem,” Allen said, “is that Young cannot lay off the high-heat.” At the time of his demotion, Young was swinging at far more high fastballs than the average MLB hitter. Here’s more from Allen:

These fastballs up in zone and above the zone are most likely to be whiffs and pop ups, and Young swings at them about 7.5% more often than average…Young is swinging at too many pitches up in the zone and, probably, there is something wrong with the path of his swing leading to the increase in pop ups and drop in HRs.

So far in 2010, Young is doing a better job of laying off the high heat. Allen was kind enough to provide a couple of updated graphs showing Young’s decreased tendency to jump at letter-high fastballs. First, here’s Young’s swing rate by pitch height from 2010, compared to 2007-2009:

And here is Young’s infield fly ball percentage by pitch height:

So, Young’s not swinging at as many high fastballs, and when he does offer at those pitches, he’s not popping up as much as in years past. That helps explain why his IFFB% is down to a much more reasonable 9.7 this season. The decrease in high fastballs swung at may also contribute to his increase in contact rate (81.6% in 2009, 86.2% in 2010) and lowered strikeout rate (30.7 K% in ’09, 24.1% this season).

Young’s BABIP is .305 this season, and his xBABIP is actually slightly higher at .311. With a wRC+ of 118, his lumber has been worth +7.6 runs to this point. It remains to be seen whether Young can keep these gains made during the first half, but Arizona’s All-Star representative is finally starting to live up to the prospect billing.


Curtis Granderson’s BABIP

New York Yankees center fielder Curtis Granderson is in the midst of his fifth full season in the major leagues. After performing at roughly a league-average clip at the plate in 2006 (.333 wOBA), Granderson went on to crush the ball in 2007 and 2008. The former third-round pick in the 2002 draft posted a .395 wOBA in ’07 and a .374 wOBA in ’08. Granderson’s bat, worth +1.2 runs above average during his first full season, jumped to +35.7 in 2007 and +23 in 2008.

Since then, however, Granderson’s lumber has been merely decent. He turned in a .340 wOBA last season (+6 runs above average), and he has a mild .318 wOBA (-1 run) during his first year in the Bronx. Granderson still possesses an above-average walk rate and good pop…

..but his BABIP has taken a big tumble. The lefty batter had a .333 BABIP in 2006, a .360 BABIP in 2007, and a .316 BABIP in 2008. His BABIP dipped to .275 last year, and it sits at .265 in 2010. Here are Granderson’s batted ball percentages over the years:

He’s hitting fewer grounders, and more balls classified as fly balls and liners. Fly balls have a lower BABIP than ground balls, but line drives fall for hits 72 to 73 percent of the time on average.

What are Granderson’s expected BABIP totals over the years? To help answer that, we can use this expected BABIP tool from The Hardball Times, based off the research of Peter Bendix and Chris Dutton. Dutton and Bendix found that hitter’s eye (BB rate/SO rate), line drive rate, Speed Score, pitches per PA and power all have a positive relationship with BABIP. The simple xBABIP tool uses a batter’s rate of home runs, stolen bases, line drives, fly balls, ground balls and pop ups to estimate BABIP. Here are Granderson’s actual BABIP and xBABIP totals since ’06:

While Granderson’s actual BABIP has been all over the place, his xBABIP has been fairly consistent. The exception is 2009, when his xBABIP was low due to a high rate of pop ups hit (13%, compared to a 7.6% career average and the 7-8% MLB average). His xBABIP is .310 this season, yet his BABIP is just .265. What gives? To shed further light on Granderson’s BABIP decline, here are his numbers by batted ball type over the years:

I highlighted the two biggest changes — Granderson’s BABIP on fly balls has gone from way, way above average to well below average. Further, his BABIP on liners is low this season. Here’s a graph that shows Granderson’s BABIP by batted ball type since 2006, compared to the AL average. The FB line falls off a cliff:

Granderson should show improvement in the second half of the season — his rest-of-season ZiPS calls for a .346 wOBA, with his BABIP climbing to .286. But I’m curious what you readers think, particularly Tigers and Yankees fans. Is Granderson doing something noticeably different at the plate over the past two years? Could it be related to his percentage of lefties faced, which is quite high this season (37 percent, compared to 28 percent in ’09, 25.3 in ’08, 19.7 in ’07, and 24.2 in ’06)? Do you buy the rest-of-season ZiPS BABIP, or do you expect something different?


Cincy Bats Fuel Playoff Push

The Cincinnati Reds pummeled the Chicago Cubs at Wrigley yesterday afternoon, bopping seven home runs while taking the game fourteen to three. Aside from Brandon Phillips and Jonny Gomes, the Reds’ hitters going deep weren’t the usual suspects. Drew Stubbs trotted around the bases three times. Paul Janish knocked one out, having been thrown into the game following Joey Votto’s first inning ejection. Backup backstop Corky Miller, called into action after Ramon Hernandez came out with a sore knee, used the power of the Fu Manchu to crank one out of the park.

The victory brings Cincinnati’s record to 47-36, 1.5 games ahead of the St. Louis Cardinals in the National League Central. CoolStandings.com gives Cincy nearly a two-thirds chance of making the playoffs. How have the Reds managed to stave off the Red Birds to this point? The club’s defense has been decent, ranking sixth in the NL in Ultimate Zone Rating. Cincy’s starting pitchers place ahead of only the Diamondbacks and Pirates in terms of xFIP, while the bullpen places seventh in xFIP and 12th in Win Probability Added. The Reds’ success isn’t fueled by pitching and defense. Rather, it’s the bats that are keeping the team in the playoff hunt.

Collectively, the Reds have an NL-best .347 wOBA. Granted, Great American Ballpark is a strong hitter’s venue. But even accounting for that, Cincinnati trails just the Milwaukee Brewers in Park Adjusted Batting Runs — Reds batters have been +43.2 runs above average, compared to +46.3 for the Brew Crew.

While Orlando Cabrera (71 wRC+) is making oodles of outs near the top of the lineup, the Reds feature league average or better offensive production at every other position on the field. Ramon Hernandez has a 109 wRC+. Joey Votto is raking to the tune of a 163 wRC+, and Brandon Phillips has a 127 wRC+. Scott Rolen (146 wRC+) has cast aside shoulder problems and is showing power not seen in over half a decade. In the outfield, Drew Stubbs rates as exactly average (100 wRC+), while Jonny Gomes (115 wRC+) and Jay Bruce (118 wRC+) come in well above that mark.

The question now becomes, can the Reds keep crushing the ball? Here are the current wOBA totals for Cincy’s hitters, as well as their rest-of-season ZiPS projections:

Those rest-of-season forecasts suggest it’s going to be hard to the Reds to keep putting crooked numbers on the scoreboard so frequently — seven out of the eight current starters are predicted to show decline at the dish. CHONE’s R.O.S. projections also show a downturn for most Cincinnati hitters, though the system is more bullish on Bruce’s bat:

Perhaps the rotation will get a shot in the arm with the return of Edinson Volquez and the ‘pen will get the power fastball of Aroldis Chapman, but it’s likely that the lineup won’t be as prolific in the second half.