On August 20, Paige Bueckers, rookie for the WNBA’s Dallas Wings, dropped 44 points against the Los Angeles Sparks, the most ever scored by a rookie in a single game. When Bueckers passed the previous single-game rookie scoring record (40 points, set by Candace Parker, who won MVP that year), one of the broadcasters remarked that her performance in the game effectively guaranteed her Rookie of the Year honors. Heading into the season, Bueckers was favored to win the award, but strong play from Washington Mystics rookie Sonia Citron forced WNBA analysts to reconsider what once had felt like a foregone conclusion. Bueckers needed the 44-point game to reclaim her place as the sport’s top rookie.
In the WNBA’s 40-game season, one game can legitimately swing an awards race, especially in the context of a sport where a star player can dominate a game and a point guard like Bueckers touches the ball on every possession. To find an analog in a 162-game baseball season, one might have to look for a hot streak spanning several games or a particularly close race that features a game with enough narrative heft to sway the sensibilities of the writers voting on the award. Looking back at recent rookie seasons reveals a few possible examples. Read the rest of this entry »
Though many predicted heading into the 2025 season that the Orioles’ weak starting rotation and general inactivity over the offseason would come back to haunt them, even Baltimore’s biggest skeptics weren’t prognosticating that the team would sit well under .500 and 7.5 games out of playoff position at the end of July. Such as it is, the Orioles spent this year’s trade deadline turning over roughly a third of their roster. Over the last week or so, the O’s have traded relievers Gregory Soto, Seranthony Domínguez, and Andrew Kittredge, along with infielders Ryan O’Hearn and Ramón Urías. Then on Thursday afternoon, Anthony DiComo reported that Cedric Mullins was on his way to the Mets; a few hours later, Jeff Passan broke the news that Charlie Morton would be joining the Tigers. The only healthy pending free agent who wasn’t traded out of Baltimore is Tomoyuki Sugano, and with Zach Eflin hitting the IL mere hours before the deadline, Sugano is now a load-bearing member of the rotation. Read the rest of this entry »
The Cubs sit just one game back of the Brewers in the NL Central, but the two division rivals exist as almost perfect inverses of one another when it comes to on-field performance. Chicago ranks second in wRC+ at 117 and 15th in ERA- at 98, while Milwaukee ranks 13th in wRC+ at 102 and fifth in ERA- at 89. Their common ground is on defense, where both teams are top three in defensive value.
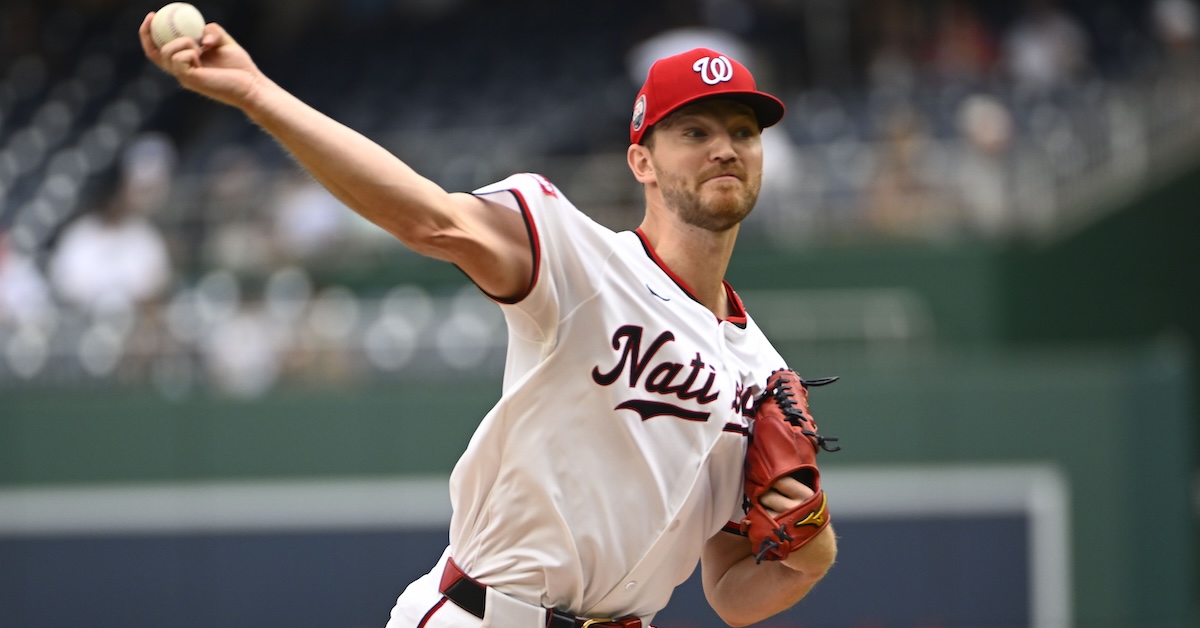
Coming off a series loss against the Brewers and with the trade deadline bearing down, the Cubs added some depth to their weaker side of the ball on Wednesday by acquiring pitcher Michael Soroka from the Nationals. Soroka will be a free agent at the end of this year, after signing a one-year $9 million dollar deal with the Nats last December. In return, Washington received Triple-A outfielder Christian Franklin, Chicago’s fourth-round pick in 2021, and 18 year-old shortstop Ronny Cruz, whom the Cubs selected in the third round of the 2024 draft. Read the rest of this entry »
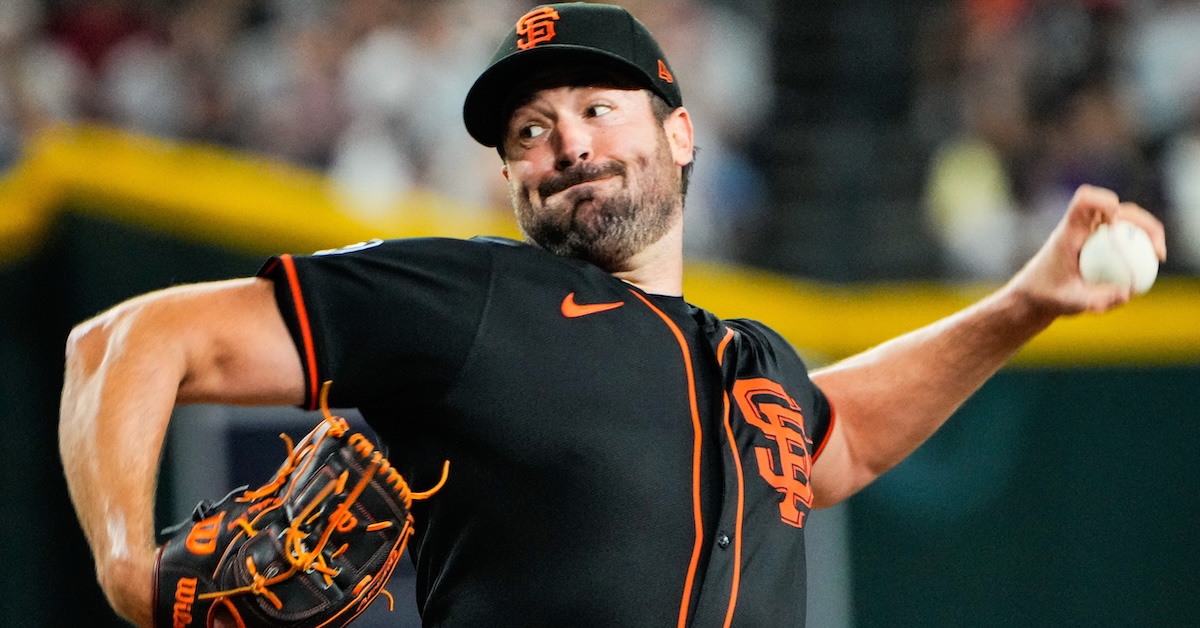
Every time I hear the name Robbie Ray, I think about the bar scene from 2002’s Sweet Home Alabama, where Reese Witherspoon’s character Melanie drunkenly stumbles up to an old friend as he’s about to attempt a pool shot. Through a fit of giggles she says, “Bobby Ray! Don’t blow this one, OK?”
Most recently, this happened when I read that Robbie Ray had been named to the National League All-Star team. Because Robbie Ray has not been blowing it this season. In fact, he’s been posting numbers not far off the pace from his 2021 Cy Young season. But despite the Cy Young on his résumé, I probably think about Bobby Ray more often than Robbie Ray, because Robbie followed up his award-winning performance with a merely average 2022, and then spent much of 2023 and 2024 on the IL. Overall, Ray’s career has been a bit of an up-and-down journey, and if we’re comparing career arcs to character arcs, Ray’s is more akin to Melanie’s than Bobby Ray’s, despite the similar name.
Dropping in on Ray’s 2021 season is roughly equivalent to where we drop in on Melanie Carmichael at the beginning of Sweet Home Alabama. Melanie (whose real last name is Smooter, but she chose to adopt a more sophisticated persona after leaving Alabama for the big city) is a fashion designer fresh off a successful debut at New York Fashion Week and newly engaged to the mayor’s son (Patrick Dempsey). Melanie has accumulated career accolades and social status, just as Ray spent his 2021 season reeling in award votes and leveling up his status as a starting pitcher. Read the rest of this entry »
In the offense edition, I used a game show format to evaluate whether the perspective offered by BaseRuns has a point, or if there’s something its methodology is overlooking. We’ll keep that framework going for the defenses as well. Here’s a reminder of how it works:
To determine whether or not BaseRuns knows what it’s talking about with respect to each team, imagine yourself sitting in the audience on a game show set. The person on your left is dressed as Little Bo Peep, while the person on your right has gone to great lengths to look like Beetlejuice. That or Michael Keaton is really hard up for money. On stage there are a series of doors, each labeled with a team name. Behind each door is a flashing neon sign that reads either “Skill Issue!” or “Built Different!” Both can be either complimentary or derogatory depending on whether BaseRuns is more or less optimistic about a team relative to its actual record. For teams that BaseRuns suggests are better than the numbers indicate, the skill issue identified is a good thing — a latent ability not yet apparent in the on-field results. But if BaseRuns thinks a team is worse than the numbers currently imply, then skill issue is used more colloquially to suggest a lack thereof. The teams that are built different buck the norms laid out by BaseRuns and find a way that BaseRuns doesn’t consider to either excel or struggle.
In a post yesterday, I wrote about the BaseRuns approach to estimating team winning percentages and how it attempts to strip away context that doesn’t pertain to a team’s actual ability, so as to reveal what would have happened if baseball were played in a world not governed by the whims of seemingly random variation. In this world, a win-loss record truly represents how good a team actually is. Try as it might, the BaseRuns methodology fails to actually create such a world, sometimes stripping away too much context, ignoring factors that do speak to a team’s quality, or both.
I delayed for a separate post (this one!) a deeper discussion of specific offensive and defensive units that BaseRuns represents quite differently compared to the actual numbers posted by these teams. To determine whether or not BaseRuns knows what it’s talking about with respect to each team, imagine yourself sitting in the audience on a game show set. The person on your left is dressed as Little Bo Peep, while the person on your right has gone to great lengths to look like Beetlejuice. That or Michael Keaton is really hard up for money. On stage there are a series of doors, each labeled with a team name. Behind each door is a flashing neon sign that reads either “Skill Issue!” or “Built Different!” Both can be either complimentary or derogatory depending on whether BaseRuns is more or less optimistic about a team relative to its actual record. For teams that BaseRuns suggests are better than the numbers indicate, the skill issue identified is a good thing — a latent ability not yet apparent in the on-field results. But if BaseRuns thinks a team is worse than the numbers currently imply, then skill issue is used more colloquially to suggest a lack thereof. The teams that are built different buck the norms laid out by BaseRuns and find a way that BaseRuns doesn’t consider to either excel or struggle. Read the rest of this entry »
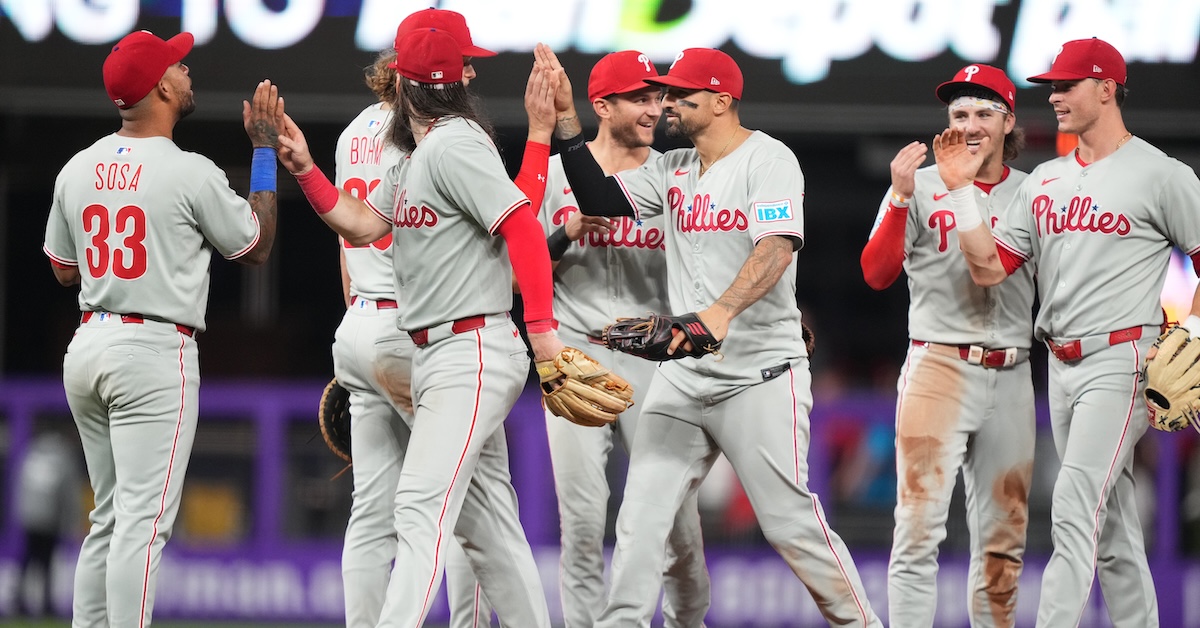
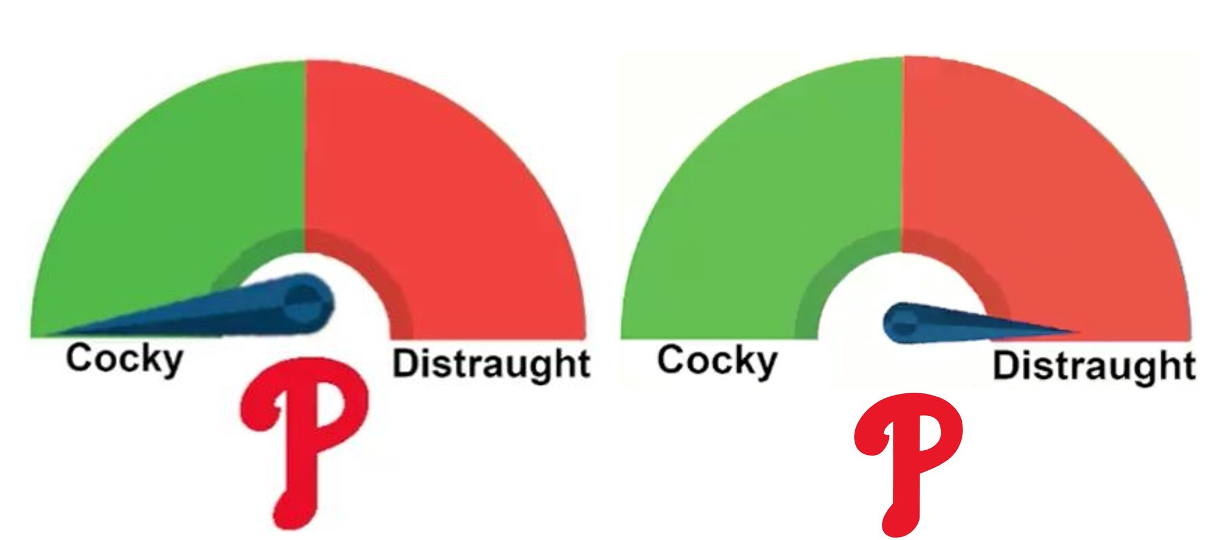
You’re probably familiar with the saying, “Happiness equals reality minus expectations.” Maybe because your Aunt Debbie shared a post from her favorite social media influencer. Maybe because you passed the time during a layover at the airport perusing the self-help books in the Hudson News near your gate. Like most self-help tropes, whether or not it hits for you depends a little on your life circumstances and a little on how you choose to apply it. When it comes to sports fandom, emotional hedging can be a useful tool to avoid disappointment, or maybe you prefer projecting confidence to manifest a desired outcome. And if you’re a Phillies fan, you’ve perfected the art of oscillating wildly between the two over the course of a single game. You even have a handy meme with a meter that only ever points to one extreme or the other:
(Please excuse the mismatched needle sizes and logo alignment. These images are precious internet relics that have been downloaded, clumsily edited, re-uploaded, compressed, and decompressed hundreds, if not thousands, of times. The pixelation is earned like callouses on the hands of a skilled laborer.)
But the formula seems to assume that expectations are set and controlled by the person in search of a happy existence. The entire notion is upended when mathematical models based on historical outcomes become the source for baseline expectations. In this scenario, if your team is outperforming expectations, then you can enjoy the banked wins, but you do so in fear of the rainier days that surely lie somewhere in the team’s future forecast. Whereas if your team is underperforming expectations, things might feel dire, but there’s reason to believe sunnier days lie ahead. Read the rest of this entry »
A couple of weeks ago, Hannah Keyser of The Bandwagon asked Kodai Senga about his reverse splits when it comes to times through the order. His .347 wOBA allowed the first time through the lineup drops to .275 the second time through it, and then sinks to .205 the third time through. However, his total batters faced sits at just 90 for each of the first two times through the order and 48 for the third time through. That’s a small enough sample that it’s difficult to say how much of the credit goes to Senga and how much is naturally occurring variation.
Either way it doesn’t matter much to Senga, who cares more about process than results, “Quite honestly, I don’t feel like I’m very good at any point during the game this year,” he told Keyser through his interpreter. Harsh words for a pitcher with an ERA- of 37. He does acknowledge that he makes adjustments throughout the game to get a better feel for his pitches and tweaks his strategy based on how each pitch is looking in a given start, which offers some explanation for the improved outcomes as the game goes on. But according to Senga, all of his pitches feel off this year, as he remains in the process of re-establishing his mechanics following the shoulder and calf injuries that sidelined him for nearly all of last year.
Senga’s self-evaluation reminds us that folks performing at the elite level of their fields don’t get there by letting good enough be good enough, but rather by insisting that nothing is ever good enough. To the layperson, it’s baffling to hear that Senga feels he’s pitching worse, despite posting better results than in 2023, his first MLB season, and the last in which he was fully healthy. Add on that he somehow manages to gain effectiveness throughout his starts despite a certain level of displeasure with all of his pitches, and it couldn’t be any clearer that regardless of what you read in Us Weekly, the stars are not actually just like us. Read the rest of this entry »
At one point or another, most of us have done the thing where we go to the refrigerator in search of a snack, decide nothing looks appealing, close the door, then come back 15 minutes later to check again and somehow feel annoyed when the contents remain unchanged. It’s a near-universal experience despite the illogical nature of the whole thing. And when we relate this experience to others, it’s always the refrigerator, even though we could just as easily choose to re-check a cabinet or the pantry. But I think this is where we do get some credit for being slightly logical. The contents of a refrigerator are far more transient than the dry and canned goods stored elsewhere in the kitchen. The fridge is where we keep the perishables, the food that by definition isn’t meant to last long. Food in the refrigerator comes and goes, rots and gets tossed, all at a much faster rate than elsewhere in the kitchen.
Park factors work a little like a refrigerator. They present a single value that contains within it the influence of several different components that vary from park to park, much in the way my refrigerator is two-thirds beverages and cheese, while yours probably has fruits and veggies and maybe some leftover ham from Easter that you should definitely throw away. Some of the components captured by park factors are static and easily measured, like surface dimensions and wall height. They’re the condiments that remain consistently stocked in the fridge door.
But sometimes you throw open the door to a park’s refrigerator and get whacked in the face with a stench of unknown origin. And that stench becomes all the more potent as it mingles with a to-go box of leftover Thai and a carton of milk growing more questionable by the day. Likewise, wind speeds, the daily dew point, and the angle of the sun at different points relative to the solstice all fluctuate and interact in a way that a scientist with the right expertise could tease out and quantify, but that remain a bit fuzzy to the casual observer.
It was these squishier components of park factors, the ones that ebb and flow as weather cycles in and out and the seasons change, that sparked my curiosity about how park factors might vary over the course of such a long season. Traditionally, park factors are calculated over multiple full seasons of data (though sometimes single-season park factors are useful for capturing more recent trends), and that’s not just a sample size consideration. A full season of data is needed to ensure a balanced schedule where every opponent faced on the road is also faced at home and vice versa. This ensures that when comparing runs per game at home to runs per game on the road, the team quality is consistent in both subsets. Read the rest of this entry »
On April 16, Jackson Holliday ended an 0-for-17 slump with a second-inning grand slam that put the Orioles up 4-0 in an eventual 9-1 win over the Guardians. But a commanding win wasn’t the only momentous occasion taking place at Camden Yards that evening — it was also Bark in the Park night. When asked in his post-game interview if there were any furry friends he’d like to shout out, he replied, “Oh yeah, Coconut’s here,” referring to the one year old Bernedoodle that Holliday and his wife added to their family during spring training last year. Coconut attended the game wearing Holliday’s jersey and acted as his good luck charm, though Holliday believes dogs beyond his own have the power to bring him positive vibes at the plate. “I have a good track record in the minor leagues of performing on Bark in the Park, so maybe we’ll have to have these more often,” Holliday continued. That is a claim simply begging to be fact-checked.
Over Holliday’s tenure in pro ball, he’s played in eight games where fans were encouraged to bring their pups to the park, five in the minors and three in the majors. In the minors, Holliday’s teams went 1-4, as he amassed 19 plate appearances with four walks, five strikeouts, two singles, two home runs, and four RBI. That’s good for a .266/.421/.666 slash line, which isn’t bad, but when you consider Holliday posted a .303/.443/.485 line in the minors, it’s really only impressive from a power perspective (Holliday’s slash line in big league Bark in the Park games is .222/.300/.500 with four RBI over 10 PA). Still, the home runs are clearly what stand out in Holliday’s mind, and given that he went deep just 23 times over 218 games in the minor leagues and is driving the ball over the fence even less frequently in the majors, it makes sense that those four-baggers would feature prominently in his memory. Especially since all three put his team in the lead.
Now, I will confess that I only checked Holliday’s home games for Bark in the Park events. As you’ll soon see, I did an absurd amount of manual data collection for this piece, but I drew the line at checking the theme nights for every minor league affiliate Holliday faced. Maybe he disappointed dog owners up and down the Mid-Atlantic as he posted monster numbers in opponent ballparks. We’ll never know. But Holliday’s assertion that he gets a leg up from the presence of his four-legged friends led to a broader research question. Are there other players who consistently outperform their typical production with all those good boys and girls in the building? Read the rest of this entry »