Author Archive

The Anomalous Offensive Outcomes of the 2015 Season

A couple months ago, we featured an annual article that detailed the most extreme home runs of 2015. It’s always a fun post to write, and this year, I had the honor of putting it together. We always include hardest-hit, longest, shortest, highest, lowest, you name it — it’s a veritable smorgasbord of dingers, and everybody likes dingers. Now that we’re a couple months removed from it, though, I realized it’s missing something: a thorough consideration of the players who hit those home runs.

Of course we expect and know that Giancarlo Stanton is probably going to hit the longest home run of the season. He tied himself in the category this year, even though he didn’t play in any games past June 26th — such is his domination of hitting baseballs long distances. But what if Erick Aybar – he of the .069 isolated-power mark — hit a massive home run to right field at AT&T Park, 2015’s hardest park to homer in for a left-hander? (Spoiler: he did not do this.) What if David Ortiz – he of the lowest speed score in baseball during 2015 – hit a triple in Anaheim, a very difficult park in which to triple for lefties? (Again, no, but you get the idea.)

Read the rest of this entry »


FG on Fox: The Precedent for Evan Gattis’ Triples

Evan Gattis was probably never fast. That is, he wasn’t fast in comparison to many baseball players he was around while coming up through the minors. He certainly isn’t fast now, and at this point, we can confidently say that he probably never will be. And that’s fine, because speed isn’t really his game: coming into the 2015 season, he had zero stolen bases and one triple in his career. We’re all familiar with how Gattis contributes in other ways, like hitting baseballs 450 feet. Yet despite his lackluster speed, by the end of the 2015 season, he updated his career statistics to read zero stolen bases – and 12 triples.

In the span of one season, Gattis increased his triples total by a factor of 12. Because of that fact, this was a big story for most of the season; a simple internet search yields many articles ranking and commenting on his ever-increasing number of triples during 2015. Today, instead of viewing and ranking each one, we’re going to go deep on how strange and rare it is for someone as slow as Gattis to do this.

To begin with, we’re going to use a statistic called Speed Score. Very simply put, it’s a way of measuring a player’s speed and baserunning ability. Speed Score is on a scale from zero (walks around the bases) to ten (fastest/best baserunning human who has ever lived), so it’s fairly easy to grasp, and it tends to make some intuitive sense. There are a few main factors that go into a player’s score: stolen base rate, number of stolen base attempts, triple rate, and double play rate being a few of the main ones. To give you some examples, the best qualified hitter by Speed Score since 1920 is Jarrod Dyson. If you’ve watched the playoffs during the past two seasons, you know how fast Dyson is. The worst players by Speed Score are usually catchers, with Chris Snyder (who mainly played for the Diamondbacks in the early-to-mid 2000’s) at the very bottom.

So let’s see where Gattis fits into this Speed Score spectrum. First let’s look at the first two seasons of his career combined – 2013 and 2014. Here are the worst position players by Speed Score in those two years (minimum 750 plate appearances), with the number of triples each player hit:

Worst Speed Scores (w/ Triples), 2013-2014
Name Speed Score Triples
Kendrys Morales 0.8 0
Billy Butler 1.0 0
Miguel Montero 1.1 0
Adam Dunn 1.1 0
Justin Smoak 1.2 0
Evan Gattis 1.2 1
Matt Dominguez 1.3 0
A.J. Ellis 1.4 1
Brian McCann 1.4 1
Alberto Callaspo 1.4 0
SOURCE: FanGraphs

We have three designated hitters here, a catcher, and a first baseman. Then we have Evan Gattis. We said before that he wasn’t fast, but let’s put it another way: Gattis was one of the very slowest — and worst — baserunners by Speed Score during 2013 and 2014. He was around the first or second percentile in the majors. These ten players above hit a combined three triples during these two seasons — basically, these types of players very rarely hit triples (and that helps bring their score down as well). Gattis actually improved remarkably by Speed Score in 2015, getting all the way up to 3.9 (46th percentile!) — but we can be quite confident that most of that increase was due to the number of triples he hit, and not other factors, like his aptitude at stealing bases (which did not improve).

Read the rest on Fox Sports.


FG on Fox: The Shortstop Youth Movement Is Back

On February 27th, 1997, the cover of the then newly-released March issue of Sports Illustrated featured two baby-faced baseball players — with the headline “Derek Jeter and Alex Rodriguez head up the finest group of shortstops since World War II.” The next season, Nomar Garciaparra had his breakout, and he joined the two in what was an embarrassment of riches at the position. Three years later, the trio was elected to the 2000 All-Star Game — a recognition of what was one of the finest multi-year periods by a group of three shortstops in the history of the game.

A historical convergence of that type of talent happens rarely in baseball, and it happens far more rarely at one position – and in just one league. During any particular season, there are usually only a certain number of players that are above a particular production level. Take, for example, the number of players that produced at least 6.0 Wins Above Replacement in 2015. We’ll focus on 6.0 WAR because above that level we consider production to be in the realm of a possible “MVP” performance.

In 2015, there were only ten players in all of baseball who had greater than 6.0 WAR. In 2014, there were only nine, and in 2013 there were also ten. Some years have more players and some years have fewer, but the point is that there are usually few players who are in this upper echelon of production. It’s also important to understand that shortstop is usually a less talented position than others on the field: the skill set to be successful both offensively and defensively at shortstop simply narrows the range of potential players down. Case in point: there hasn’t been a full-time shortstop with at least 6.0 WAR since Hanley Ramirez and Derek Jeter both topped that mark in 2009.

In 1998, Jeter, A-Rod, and Garciaparra all had over 6.0 WAR. They were all shortstops. They were all in the American League. The confluence of circumstances that came together for that to happen should be celebrated by its own holiday. In fairness, 1998 was a ridiculous year for great position players – there were 24 players with at least 6.0 WAR – the result of both great timing and, well, steroids. Still, there has rarely been a time when talent among American League shortstops – and shortstops in general – was more top-heavy than in the late ‘90s and early ‘00s.

Read the rest on Fox Sports.


Evan Scribner and the Cruel Realities of Relief Pitching

It might seem easy to envy the life of a major league baseball player: even the least famous of them make a lot of money, have a bunch of Twitter followers, and get to play a game for a living. But it’s always been a little tougher for me to envy the life of a relief pitcher, who seems to experience the worst drawbacks of the job with little of the upside. As opposed to starting pitching — where one’s mistakes can be more easily made up for by logging good innings — relief pitching is simply less forgiving, with every mistake massively amplified. And no pitcher has embodied that more in the past two seasons than Evan Scribner.

You might know about Scribner, as he was just traded from the A’s to the Mariners last month. There’s more than that to him, of course, and one of the big things is the number of strikeouts he’s recorded compared to the number of walks he’s issued. That’s important, because we like the K-BB% stat a lot for pitchers: it’s been shown to be the best ultra-simple ERA estimator we currently have. It’s not perfect, but it can be a handy way to get an idea of how a pitcher could perform in the future. There’s even some work that shows it performed better than xFIP, FIP, and SIERA at predicting second-half ERA after a first half was in the books. All of this is just a set up, really, for this table, which shows the 15 best K-BB% marks for relievers with at least 70 innings pitched between 2014-2015:

Top 15 Relievers by K-BB%, 2014-15, min. 70 IP
Player K% BB% K-BB% ERA
Aroldis Chapman 46.3% 11.9% 34.4% 1.80
Andrew Miller 41.6% 7.6% 34.0% 1.96
Kenley Jansen 38.7% 5.8% 32.9% 2.60
Sean Doolittle 35.5% 4.4% 31.1% 2.95
Dellin Betances 39.5% 9.5% 30.0% 1.45
David Robertson 35.8% 7.1% 28.7% 3.24
Craig Kimbrel 37.7% 9.9% 27.7% 2.08
Wade Davis 35.3% 8.1% 27.2% 0.97
Jake McGee 32.8% 5.7% 27.1% 2.07
Koji Uehara 31.1% 4.2% 26.9% 2.41
Evan Scribner 26.3% 1.4% 24.9% 4.40
Ken Giles 32.5% 7.8% 24.8% 1.56
Carson Smith 32.6% 8.0% 24.6% 2.07
Cody Allen 33.6% 9.0% 24.6% 2.53
Brad Boxberger 34.4% 10.0% 24.3% 3.03

The list is pretty much a who’s who of dominant relievers, as every guy in the top 10 is closing or has closed for their respective teams sometime during the past two years. Then there’s Scribner, who sticks out like a sore thumb mostly because of his ERA and the fact that he walks no one. Well, not no one, but in major league terms, he walks no one. He has the lowest walk rate among relievers who have pitched meaningful innings in the past two years (20+ innings), and it’s not particularly close; in raw numbers, he’s walked four batters in 71.2 innings.

Read the rest of this entry »


FG on Fox: The Top Plate-Discipline Improvements of 2015

We usually turn to the tried and true method of analyzing players season by season. There’s a point at which we have to demarcate sections of a player’s career, and the beginning and end of a season give us a handy and obvious way of doing so. But there are often many changes and adjustments that go on within a season, and looking at six months of baseball as one unit misses a lot of trends that we might otherwise notice. With that in mind, today we’re going to look at a few players who improved their eye and contact rate at the plate from the first half of the 2015 season to the second, giving consideration to how those improvements might help them in the upcoming 2016 season.

We’ll be looking at the most-improved players for two main plate discipline statistics: the rate of swings at pitches outside of the strike zone, and the rate of contact on pitches swung at in the strike zone. There are more plate discipline categories than just these two, but these carry a lot of weight in respect to strikeout and walk rates, so this is a great place to start. The other good news is that these types of improvements have been shown to stabilize over a short period of time – that is, once they show up, it doesn’t take too long before we can be confident that what we’re seeing is actually an improvement instead of just random noise.

To begin with, let’s look at which players showed the most improvement at laying off pitches outside of the strike zone (called O-Swing %) during the second half of the season compared to the first. I’ve included each player’s first and second half stats, the difference between them, and the second half O-Swing % minus a three year average for each player. That final column is to try to discern whether the second half improvement was actually real, or whether it was simply a response (regression) to a first half that was outside of the player’s “normal” performance from the past three years. For players with less than three years of MLB service time, as much playing time as possible was included in the final column. Let’s see our top 10 for O-Swing improvement:

Best 2015 2nd Half O-Swing % Improvements
Player 1st Half O-Swing % 2nd Half O-Swing % Change 3-Year 2nd Half Change*
Evan Gattis 44.2% 30.7% -13.5% -12.7%
Yunel Escobar 32.2% 24.3% -7.9% -2.4%
Nick Castellanos 37.9% 30.1% -7.8% -3.7%
Ian Desmond 38.3% 31.5% -6.8% -4.2%
Shin-Soo Choo 24.4% 17.9% -6.5% -5.0%
Chris Owings 41.0% 34.6% -6.4% -3.2%
Jose Abreu 41.2% 35.1% -6.1% -6.5%
Yadier Molina 38.9% 33.0% -5.9% -1.0%
Mike Trout 27.0% 21.2% -5.8% -3.8%
Jason Heyward 29.9% 24.4% -5.5% -5.5%
SOURCE: FanGraphs
O-Swing % = Swings on pitches outside the strike zone
*2015 second half O-Swing% minus three-year individual O-Swing% average from 2012-2014.

Evan Gattis basically became a completely different hitter in the second half of the season. Jeff Sullivan already pointed this out in September, and this should act as further confirmation: after a rough first half in which he struck out 22.4% of the time, Gattis showed a remarkable transformation, cutting down on the rate of swings at out-of-zone pitches by 13.5%. That lowered his second half strikeout rate to 16.3% — better than league average – and raised his walk rate from 3.5% to a more palatable 6.8%. These are very good signs for him getting back on track for the Astros in 2016 after a tough campaign last season.

Read the rest on Fox Sports.


Imagining a World in Which Barry Bonds Retired Before 1999

For the next five minutes, convince yourself that Barry Bonds retired following the 1998 season. Perhaps he suffered a bad injury in the offseason prior to spring training in 1999. Maybe he got tired of playing baseball and wanted to become a farmer. Make up whatever fantastic story you want to about his life after 1998 — just don’t have it include playing major league baseball.

We’re focusing on 1998, of course, because that’s the final year Bonds was considered “clean” by most sources. For our purposes, I’m not going to try to pinpoint specific months or dates: 1999 was the first season Bonds had Greg Anderson as a full time personal trainer, the man who supposedly introduced him to certain PEDs, and there are books written about this subject that can inform a reader on specific timing far better than I can here. For today, the offseason after the 1998 is the delineating line.

——–

It’s the winter of 1998. K-Ci & JoJo are on the top of the charts with “All My Life.” In theaters, You’ve Got Mail reigns supreme. When the news of Barry Bonds’ retirement breaks, newspaper columns talk about how incredible his 13-year career was — often juxtaposed to the outsized personality he showed in the clubhouses of the Pirates and Giants. SportsCenter is particularly watchable, and Stuart Scott and Rich Eisen reflect on what might have been: about how, if only he were able to play for a few more years, Bonds could have been the first player in baseball history to hit 500 home runs and steal 500 bases. What an honor to have been able to watch this guy play, they say to the camera.

Following the sudden shock of his retirement, writers and analysts turn to another subject: Bonds’ Hall of Fame chances. They tally his counting statistics through the 1998 season and compare them against every player since 1871:

Barry Bonds, 1986-1998, All-Time Ranks
Count All-Time Rank
Home Runs 411 26th
RBI 1216 93rd
Runs 1364 75th
Stolen Bases 445 45th
AVG/OBP .290/.411
Awards 3 MVPs, 8 Gold Gloves
SOURCE: FanGraphs
*Ranks include all player seasons from 1871-1998.

Given the exceptional power and speed numbers, as well as his stellar defense, Bonds has the statistics to get into Cooperstown on one of his first few tries. However, there is one issue that raises a flag for voters: his character. Always making the game about himself, Bonds’ history is littered with showing up coaches, arguing about his contracts, and always needing to to be the center of attention. After a couple years of not getting in, comparisons to Dick Allen’s situation starts to surface, but finally — after Bonds has paid his character penance — he’s voted in. A few years later, analysts run the numbers on the best players in history up to their age-34 season with a new metric, Wins Above Replacement. Bonds is the 12th-best player in baseball history up to 1998 by WAR for players aged 34 and under, and he ends up 19th overall with no age cap.

Even though he retired with seemingly so much left to give on the field (he put up 8.5 WAR in his final season, 1998), Bonds is a clear Hall of Famer.

Read the rest of this entry »


FG on Fox: Toronto’s Altered Offensive Approach at Home

Going into the 2015 season, we had a pretty good idea that the Toronto Blue Jays were going to hit a lot of home runs. After all, they hit the third-most home runs in baseball during 2014, and then added Josh Donaldson; the pieces were there for a huge offensive season from the entire team. But even with the talented personnel and a hitter-friendly home stadium, 2015 was the kind of season that was probably on the high-end of expectations: the Jays hit 232 home runs, the most by any team since the Yankees hit 245 in 2012.

As Matt Snyder pointed out in late September, the 2015 Blue Jays were only the 14th team in major league history to have three players with 35+ home runs each, and were the first team to have three since the 2006 White Sox. Those players, of course, were Josh Donaldson, Jose Bautista, and Edwin Encarnacion. Digging deeper into the stats, the offensive approach shown by those players at the Rogers Centre was a driving force behind the team’s power explosion.

By July, we had a sense that Donaldson was intentionally altering his plate approach at home to hit more homers: he was striking out more, walking less, and pulling the ball far more often when playing at the Rogers Centre than on the road. In short, he was being ultra-aggressive at the plate when at home, and it turned out to be a big part of what would become an MVP season for the third baseman. A quick look at the increase in his pull rate at home in 2015 when compared to 2013 & 2014 tells a big part of the story of his year:

Donaldson_Pull_Compare

Big power seasons often follow short-term increases in pull tendencies, and Donaldson was no different. And, looking further down the lineup, he wasn’t alone in changing his approach to get the most out of playing in Toronto’s hitter-friendly environment during 2015. Donaldson’s main partner in adopting these more aggressive changes was Bautista, who showed a few important tweaks to his Rogers Centre approach between 2014 and 2015. To begin with, he pulled the ball in Toronto more than he ever had before, owning the third-highest change in pull tendency out of all qualified hitters when at home.

Read the rest on Fox Sports.


FG on Fox: Projecting the Returning Pitchers From Tommy John Surgery

Out of context, throwing a baseball for a living is not a particularly dangerous job. There are hundreds of other occupations that provide a greater threat to health on a daily basis than standing on a pitcher’s mound. In the context of the game of baseball, however, pitching is a dangerous occupation. Besides the threat of a comebacker or awkward play at first base in which the pitcher has to cover, every pitch thrown during a game is a risk. Every pitcher in baseball is dealing with damage to their elbow in varying levels of severity, and as there’s no telling how healthy a given pitcher’s elbow is, the one pitch that could lead to serious injury is what makes the craft, in a word, totally unpredictable.

The success rate of Tommy John surgery is now so high that many fans take it for granted when an injury does occur, even going so far as to view it as some sort of rite of passage that every young pitcher must go through. But not everyone makes it back to the mound, and those that do are more likely to need another Tommy John at some point. We also know a lot more about how pitchers come back from Tommy John surgery than we used to, and it debunks a lot of previously-held beliefs.

On average, pitchers don’t gain velocity, don’t improve performance compared to their pre-injury numbers, and they’re more likely to go on the disabled list with an injury to their throwing arm than a pitcher that didn’t have surgery. While there is some evidence that TJ surgery might allow pitchers to not suffer as much age-related depreciation as those that have their original ligament, it’s clear that this is a major surgery, and not something to be taken for granted.

With that said, there are a number of All-Star-caliber pitchers who are likely to make their return in 2016 (if all goes well), and they should be included in any analysis of the ongoing offseason transactions around baseball. 2015 was a particularly difficult year in terms of the talent of pitchers requiring Tommy John surgery, as a number of current and potential future aces had to undergo the procedure.

To help visualize the talent of the pitchers who had the procedure last year and could possibly return this coming season, I’ve plotted the average Wins Above Replacement in the year prior to pitchers undergoing surgery (I’ve set the lower cutoff at the year 2000, as it was the first year in which the number of surgeries was in the double digits). In other words, how collectively good were each year’s Tommy John patients the year before they had surgery? Take a look:

Average WAR, Year Before TJ Surgery, All Pitchers

Read the rest on Fox Sports.


FG on Fox: Bartolo Colon’s Historically Bad/Improved Hitting

With the news that Bartolo Colon signed a one-year, $7.25 million deal with the New York Mets, we once again have a chance to talk about the skill set of one of the most beloved players in baseball. Add onto that the fact that his new contract includes a $50,000 bonus if he wins a Silver Slugger Award, and we’re perfectly set up to talk about the most loved aspect of one of the most loved player’s game: his performance at the plate. Any chance to talk about Colon is a good one. A chance to find a new angle on Colon’s hitting is the El Dorado of baseball writing.

The search for that city of gold could start in any number of places. Especially over the past few years, we’ve seen highlights of Colon’s exploits with the bat, from his helmet doing everything it could to escape the perch atop his head, to him legging out infield singles. He’s a human highlight reel when he gets a piece of maple in his hands, and it would be very easy to simply embed a few videos of his at-bats here and call it a day (I’ve linked to them instead).

Let’s dig a little deeper, however. One question we can answer is where Colon ranks among all pitchers who have accrued (or endured) their fair share of plate appearances. We all know of the jokes about him at the plate, and the at-bats in which he simply seems to have better things to do. But is Bartolo really one of the worst hitting pitchers of all time?

Read the rest on Fox Sports.


The Revitalization of Trevor Cahill

We had a pretty good idea of who Trevor Cahill was: owner of a career 4.13/4.27 ERA/FIP, back-end starter, ground ball pitcher. He lost his rotation spot while pitching for the Diamondbacks in 2014. During 2015, he was released by the Braves after a failed transition to the bullpen, and, after opting-out of a minor league contract with the Dodgers, there was the possibility that this might be the end of any meaningful career for him. Still only 27 years old, he wouldn’t have been the first fringy starter to flame out of the league.

In late August, however, he signed a minor league deal with the Cubs, and two weeks later they called him up to the major league bullpen. Something pretty drastic had happened over the course of his time in the bullpens of the three teams he was employed by during 2015, and it all seemed to culminate in his 17 September and October innings for Chicago: he posted a stellar 27% K-BB% during that stretch, returning successfully to his ground ball ways (61.8%) and a 2.12/3.13 ERA/FIP.

Those 17 innings were, of course, a tiny sample size. But in those innings, as well as his successful work during the playoffs, we glimpsed who the new Cahill might be, and it was the pitcher the Cubs think they just signed to a low-risk, one-year, $4.25 million deal last week.

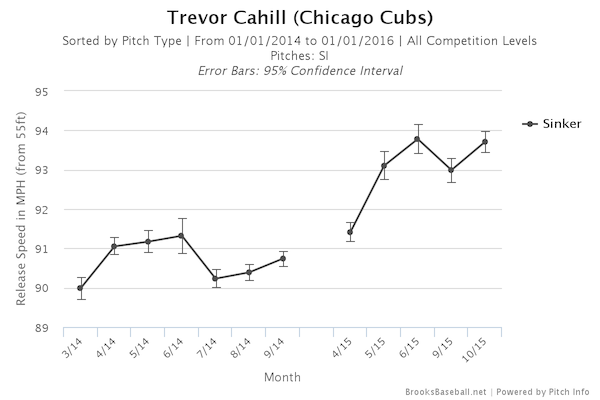
First, we saw a big velocity jump from Cahill in 2015. He almost exclusively throws a sinker as his main fastball, and he increased its velocity in 2015 by about two and a half mph from its highest point in 2014. Take a velocity look at a chart for his sinker for the months of 2014 and 2015, courtesy of Brooks Baseball:

Cahill_Sinker_Velo

Read the rest of this entry »